
🔎 At a Glance
- The Fed Rate Hike Won’t Fix The Inflation It Targets
- Market Brief & Technical Review
- From Lance’s Desk: K-Shaped Economy: Reality Or Media-Driven Perception – RIA
- Market stats, screens, and risk indicators
🏛️ Market Brief – Fed Hikes Rates
Unsurprisingly, this past week’s market action belonged to the Federal Reserve. On Wednesday, the FOMC delivered its first rate hike since 2023, lifting the funds rate to 3.75%-4.00%. While the hike was widely expected, the 12-0 vote and the lack of rate cuts scheduled in 2027 shocked the markets. Furthermore, Kevin Warsh made clear that more hikes could follow.
Stocks fell following the decision, but rallied sharply on Thursday. Friday was a sloppy trading day, as option expiration applied selling pressure to stocks early in the day, but stocks rallied back into the green by the close, with the S&P 500 closing Friday at 7,637.76. For all the volatility, the market ended roughly where it began. The Dow finished at 51,778, the Nasdaq at 26,418, and the Russell 2000 at 2,874.
The real story sat under the surface, in the sectors. Financials took the beating. The banks led the tape lower as the curve and the hike did their work, with Goldman Sachs and Bank of America each shedding roughly 8% on the week, the group’s largest weekly loss since March. Energy weakened a bit as crude prices fell back below $100/barrel.

Cross-asset told the same tale. The 10-year Treasury yield finished the week hovering at the 5% mark, a level not seen in 19 years, and the 30-year held near 5.34%. WTI settled around $95.46 a barrel. Gold held near $4,420. The dollar firmed at the margin, and bitcoin rose to $81,190, a sign the broader liquidity trade has not yet cracked. Under the hood, though, breadth stayed poor, the advance carried by a handful of megacaps, while the average stock, and especially anything that borrows, lagged badly.
While the underlying internals remain weak, the market continues to hold above key support levels. However, underlying investor sentiment took some damage. The latest AAII survey showed 53% of individual investors were bearish on the six-month outlook, a jump of roughly 14 points from the week before and the most pessimism since last spring. That is a reading that marks fear, not complacency, and fear is often a better friend to buyers than to sellers. The thread to carry into next week is simple. This tape now trades on two prices it cannot forecast: the price of oil and the price of money. Until one of them breaks lower, every rally is a rental rather than a purchase.
📈Technical Backdrop – Momentum Rolls Over, What Next?
The bulls maintained control this past week, despite significant volatility and bearish headlines. The S&P 500 ended the week at 7,637.76 in index terms, which is not far off from where it started. The Fed’s rate hike knocked the index down toward 7,585 midweek before Thursday’s and Friday’s rebound reclaimed the ground. The index still sits above both its rising 50-day and 200-day moving averages, so the primary uptrend that carried the tape to record highs all year remains intact, for now. What changed this week is not the trend. It is the conviction beneath it.
Despite that, our overriding concern remains both breadth and momentum. While the market rolled over hard into Wednesday’s FOMC decision, the late-week snapback kept the weekly candle from closing ugly. Many will overlook this week’s price action, but it’s the fingerprint of a market losing its footing at the highs rather than one breaking out from them.
As noted, we also remain concerned about breadth, which thinned as well this past week. With the banks and the rate-sensitive groups taking the brunt of the hit this past week, it was technology, AI-adjacent sectors, and the megacap complex that kept the market afloat. As we have noted many times before, when leadership narrows to a handful of names while the average stock struggles, the tape is more fragile than the index level would suggest. The weekly range was the widest in more than a month, the kind of expansion that tends to arrive at inflection points rather than in the middle of trends.
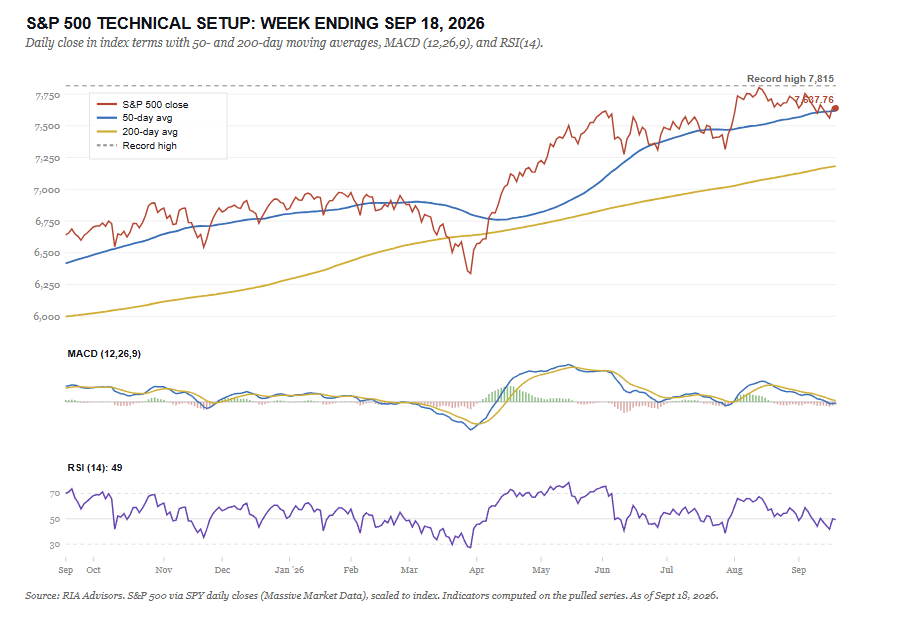
So, what does this mean for investors heading into next week as we begin to wrap up the third quarter? First, the levels that matter to investors are very close by. Resistance sits at 7,650, and then the round 7,700, the zone the rally must reclaim to prove Friday was more than a reflex. Support runs first to 7,585, Wednesday’s reaction low, and a failure there opens 7,500 and then 7,400, where the rising intermediate averages come into play.

For shorter-term investors and traders, the market setup argues for patience over conviction. I say that because the current backdrop does not provide the proper entry to chase risk. However, if the market can rally toward overhead resistance levels (7,650 and 7,700), trimming exposure and raising stops seems the most logical course of action, rather than adding exposure. For now, with the 10-year pinned at 5%, a rejection at that level seems the higher-probability outcome.
With that understanding, we would only suggest adding exposure if the market makes a decisive break and holds above 7,585, with improving breadth. Lastly, consider sizing positions for two-way volatility, which has been the case as of late, and keep stops tight beneath any reaction low. A defined-risk hedge here costs little, and it earns its keep the moment 7,585 gives way.
The most important level to watch is 7,585. If the bulls can defend that level, then the record-high structure survives to fight another week. If they lose it, the burden of proof shifts to the bulls, with 5% yields and a hawkish Fed offering them little help.
🔑 Key Catalysts Next Week
Thankfully, the economic calendar goes quiet next week. But that is also what makes it dangerous. With earnings season over and companies going into full blackout over the next two weeks, the market will be focused on the Federal Reserve. The coming days bring the first wave of Fed officials to speak since the hike, and every word will be parsed for how far and how fast the committee intends to go. After a decision that tilted the dots toward more tightening, the tone of that chorus is the week’s real catalyst.
There is some hard economic data this next week, but most of it is second-tier and largely overlooked by market participants. However, Wednesday brings the S&P Global flash PMIs, which are the first clean read on whether the energy shock is bleeding into activity. Then on Friday, we will see the latest update on Durable Goods and the final Michigan sentiment survey. The sentiment survey will be watched closely for the inflation-expectations component, which is higher than usual in a supply-shock tape.
Oil, as ever, sits outside the calendar and above it all, the one price that can rewrite the week in a single headline from the Strait.
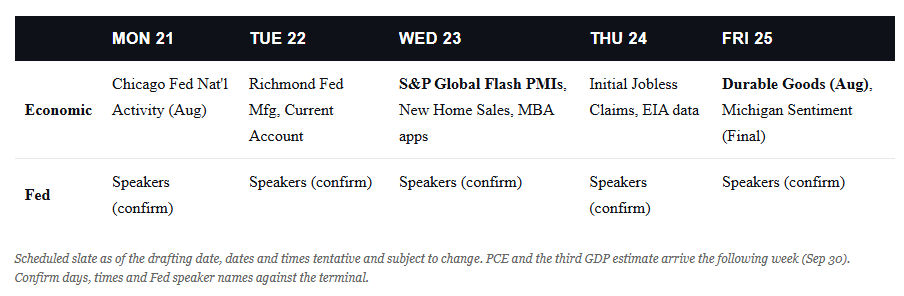
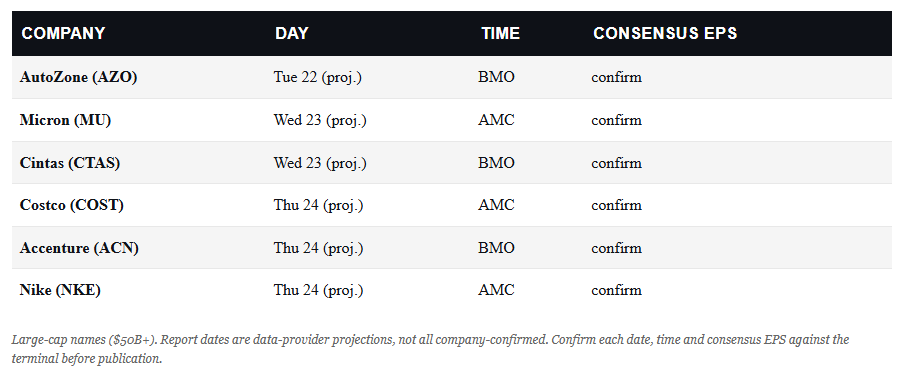
As noted, earnings largely thin out in the pre-quarter lull, but the names that report matter. Micron headlines as the memory-and-AI bellwether, its guidance a direct read on whether the AI capital-spending engine is still running hot. Costco arrives as the cleanest tell of consumer health, with $6 diesel in the tank. Accenture and Nike fill in the picture on enterprise demand and the global consumer. A Micron miss, or a cautious capital-spending signal, would land hardest because the AI trade is the one pillar still holding this market up, and it is priced for perfection. A Costco warning on the consumer would only confirm what $6 diesel already implies.
The single most important event is the collective Fed message, because it sets the path for the only variable that rivals oil, the cost of money. The asymmetric outcome cuts both ways. A hawkish chorus paired with a hot PMI would pull a second hike forward and press the long end past 5%, and the tape would not enjoy it. A dovish walk-back, or a further decline in oil, would hand the bulls the relief that Friday only hinted at. Watch the speakers, and watch the price of oil.
Need Help With Your Investing Strategy?
Are you looking for comprehensive financial, insurance, and estate planning services? Need a risk-managed portfolio management strategy to grow and protect your savings? Whatever your needs are, we are here to help.

💰 The Fed Rate Hike Won’t Fix The Inflation It Targets
The Fed did what the bond market dared it to do. This past week, in a unanimous vote, the FOMC raised the target range for the federal funds rate by 25 basis points to 3.75%-4.00%, the first Fed rate hike since 2023. The stated reason was “price stability.” Yet this is a Fed whose own chairman has spent the past year insisting that real growth does not cause inflation, and that the drivers of this one sit largely outside the central bank’s reach. As we argued in prior Bull Bear Reports on the debt-and-inflation problem, that tension is not a footnote; it is the entire story of the Fed rate hike, and something worth exploring more deeply.
Make no mistake, it was the bond market that forced the issue. Such is interesting when you consider that Kevin Warsh wants the market to create the signal. Well, he got what he wished for. The 10-year Treasury yield pushed to roughly 5.01% around Wednesday’s decision, a level not seen in 19 years, while the 30-year cleared 5.35%. In other words, the market’s message was clear: “Raise rates, or we will.”
What The Fed Rate Hike Actually Does
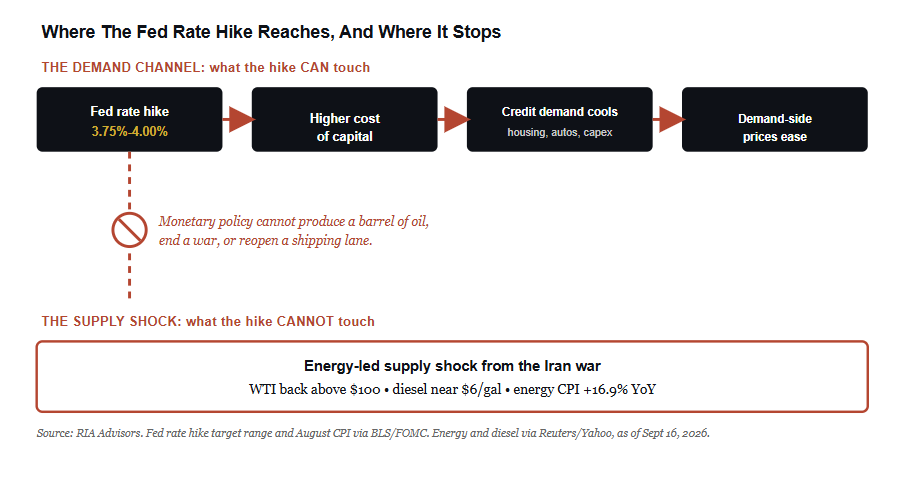
However, what gets lost in transmission is what the Fed is actually trying to achieve through interest rate policy. The mechanism behind rate hikes or cuts is a demand story, nothing more. Raising the policy rate raises the cost of money across the system. Credit-financed demand cools first, mortgages, auto loans, capex, anything that lives or dies on the cost of borrowing. As that demand softens, the economy loses some of its power to bid prices higher, and the pace of increase eases. “Price stability,” in the Fed’s own framing, is really “expectations” stability.
Now, notice what the Fed’s tool never touches, and this was mentioned by Warsh on Wednesday. A higher Fed funds rate does not drill a well, end a war, or reopen the Strait of Hormuz. The Fed rate hike works on one side of the ledger, and one side only: the demand side. Such is the design, and such is also the limit. When the inflation in front of you is a supply problem, a demand lever pulls on the wrong rope.
What Warsh Means By “The Fed Can’t Fix Prices”
However, this is where most of the mainstream commentary gets sloppy. The Warsh school separates two things that the word “inflation” quietly blends together.
- There are relative prices, set in the real economy by supply and demand for actual goods, and then
- There is the monetary unit, the purchasing power of the dollar itself.
An iPhone gets cheaper because of globalized production. Oil prices rise because of a war that threatens supply lines. No policy rate produces either outcome.
When Warsh implies the Fed cannot fix prices, the defensible version of that claim is narrow and correct. Monetary policy cannot repair a supply-driven, relative-price shock. It can only compress demand until something breaks. Milton Friedman’s line, that inflation is “always and everywhere a monetary phenomenon,” is usually quoted, incorrectly, to argue the opposite. However, read that carefully, because it makes Warsh’s point. Friedman described the slow erosion of the currency over the years (driven by a general rise in inflation amid economic growth), not the price of gasoline during a Gulf conflict. The Fed owns the monetary unit, but does not own the oil market.
Look at the composition of the number the Fed is fighting.
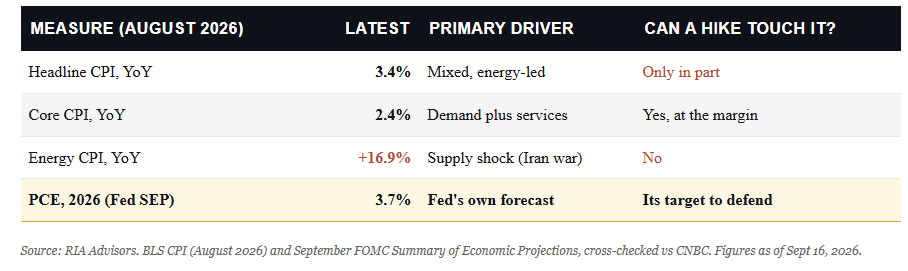
Headline ran 3.4% in August, but energy alone ran 16.9%. Strip the war out, and the overheating story gets much harder to tell. That is not a demand economy running too hot. That is a supply line on fire.
Then Why Hike Into A Supply Shock?
Fair objection. If the Fed cannot produce a barrel of oil, the Fed rate hike looks like “theater.” It is not, and the reason is CREDIBILITY. A central bank tightens into a supply shock for three defensible reasons, none of which involve lowering the price of crude.
- To keep inflation “expectations” anchored, so a one-off energy spike does not get built into wages and contracts and turn into the self-sustaining spiral of the 1970s.
- To protect the institution’s word after the “transitory” humiliation of 2021, when the Fed looked through a shock and watched it metastasize.
- Because the cost of being wrong twice dwarfs the cost of over-tightening once.
The dot plot shows the committee has made that trade. Sixteen of eighteen officials now see the possibility of at least one more hike this year, and four pencil in two.
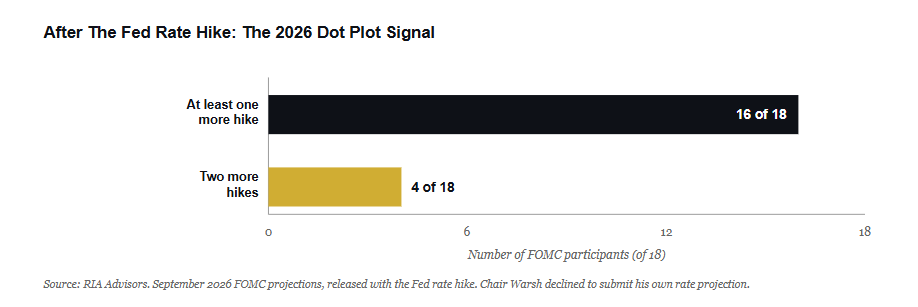
“Inflation remains elevated. Today’s policy action will support a timelier return to the Committee’s 2 percent goal.” – FOMC statement, September 16, 2026
Read that quote once again. The committee expressly said that it can steer prices with rates. However, history tells us more precisely that the Fed can reliably steer demand only. Those are not the same claim. Fighting a supply shock with a demand tool is the textbook recipe for stagflation, slower growth, and higher unemployment without curing the thing that lit the fire. Such is the box Warsh is in, the same Volcker-versus-Burns dilemma, now his to own.
Here is a clearer way to see the potential danger that Warsh is walking into. The same dot plot that pins the neutral rate at 3.1% now has the funds rate at 3.875% and climbing toward a 4.1% median by year-end. Once you strip away the language, the Fed is already about 90 basis points into restrictive territory, with more to come, even as Warsh insists conditions are not “broadly restrictive.”
That setup leaves the Fed with absolutely no margin for error. In the current environment, the Fed is hiking rates to offset an oil price spike. If energy costs continue to weigh on growth and the Fed continues to tighten, it will accelerate the deterioration. If oil reverses, the inflation impulse fades quickly, and the Fed’s hikes accelerate the economic bite. Both roads end at the same address, a Fed caught in a policy mistake, scrambling to fix the overshoot.
What Usually Happens To Stocks After A Hike, And Why This Time Is Different
The bulls have a comforting statistic ready for this week, and it is a real one. Going back to the late 1980s, the S&P 500 has slipped only modestly immediately after a first Fed rate hike, roughly 2% over the first three months, then recovered to average gains of nearly 9% over the following year, according to Goldman Sachs. LPL Financial puts the average 12-month gain at 6.7%, with a median of 10.7%. The tidy conclusion is that rate hikes are buying opportunities.

However, as is always the case, beware of “averages,” which in this case may well be lying to you. The reason I say that is due to the composition. The Fed almost always hikes into a strong, demand-driven expansion. It rarely hikes into a supply shock. When it has, the record is far uglier, and the damage tends to arrive late, once the energy spike feeds inflation and the tightening starts to bite.
After the 1973 oil embargo, the S&P fell 11% in a month and 41% over the next year. Another, more recent example, was when the Fed tightened amid the energy-and-inflation shock of 2022. During that period, the index lost roughly 19% for the year and remained underwater well past 12 months. Every “hikes are bullish” study carves 2022 out as the exception. Today, it is most likely not the exception, but the template.
One thing that matters is the pace of the Fed rate hikes. Charles Schwab’s strategists found that the S&P returned 10.5% over the year following slow tightening cycles and lost 3.6% after rapid ones. So what should you actually expect over the next year, hiking into a war-driven supply shock with the 10-year near 5%? Our read sits below. It is a judgment anchored in that history, not a backtest.
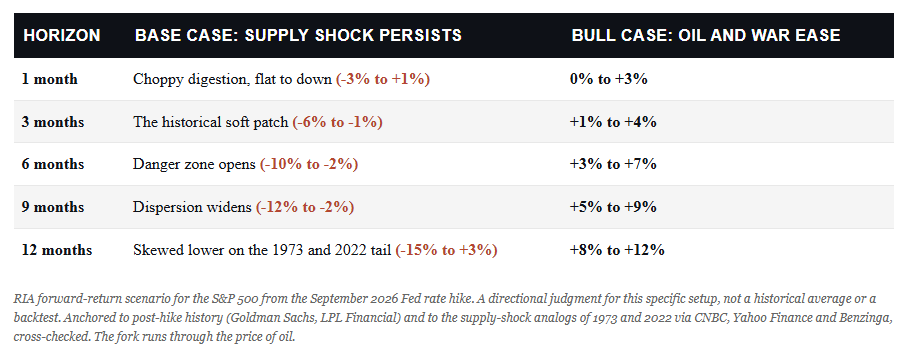
In the current market, the leadership is not subtle. When the Fed hikes amid an energy shock, money tends to flow to where inflation is a benefit rather than a hindrance. For example, in 2022, as shown below, energy led the market up by about 48%. This suggests that investors, today, like then, should favor energy, materials, and defensives with real pricing power, as well as staples and health care. On the other side, underweight long-duration assets such as technology and communication services, as well as rate-sensitive discretionary and real estate names. However, there is always a caveat. If oil breaks and the shock fades, that map inverts, and today’s laggards lead the way back.

Such is the danger of leaning on a historical average built almost entirely on the wrong kind of hike.
What This Means For Markets Over The Next Few Months, And How To Navigate It
So how do you navigate it? Rates are “higher for longer,” and the committee has told you plainly it is willing to go again. The 30-year above 5.35% and the 10-year near 5.01% raise the bar that every equity, especially long-duration growth, has to clear to justify its multiple.
The forecasters are already marking that reality. Ed Yardeni cut his year-end S&P 500 target to 7,900 from 8,400 on the decision, flagging the risk of a downturn over the next three to six months as yields climb on energy. We would take the warning seriously without treating it as gospel.
Let’s focus on the bond market, which is the harder call right now, and the argument cuts both ways.
The bull case is a good one.
“The term premium has expanded to levels that historically pay investors to own duration, and a hike that slows the economy is the classic tailwind for long Treasuries. If Warsh restores “credibility” and growth cools, the long end rallies, and this past week’s high yields will look like a gift.”
The bear case, however, also has teeth.
“The 30-year sits at a 19-year high for a reason: relentless issuance against a $40 trillion debt, layered on top of supply-driven inflation. Rate hikes can not fix that. That tail does not disappear either just because the Fed moved a quarter point. So, this argues that investors should take exposure at the point where the term premium is best paid for the risk. That is in the belly of the curve, with 5-7 year durations.”

Crucially, none of this argues for abandoning equities. It argues for respecting a market regime in which the risk-free rate finally competes with everything else. It is an environment where the biggest driver of “price stability,” the Fed cited, is a war it can’t control. The deeper problem lies one level down. The deficits and debt that we repeatedly flagged are the real long-run engine of price stability. Monetary policy sits downstream of all of it.
The Fed can raise the price of money. It cannot lower the price of a war. Size the portfolio for the difference.
🖊️ From Lance’s Desk
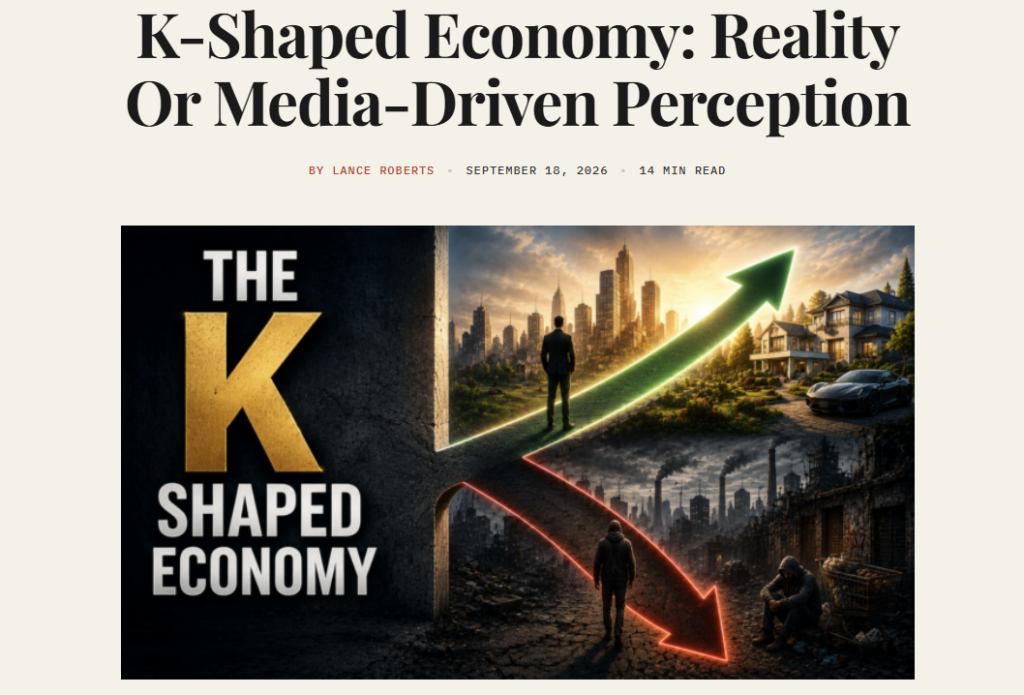
This week’s #MacroView blog explores what the K-shaped economy gets right, what it exaggerates, and what believing the worst version is costing a generation.
Also Posted This Week:
- Has The Bond Market Already Done The Fed’s Job? – RIA – by Michael Lebowitz
- Portfolio Risk Management: Winning The Long Game (Chapter 5) – RIA – by Lance Roberts
📹 Watch & Listen
Markets reversed sharply after Fed Chair Kevin Warsh signaled another potential rate hike by year-end and no rate cuts next year. Now the S&P 500 is testing support near the 100-day moving average as investors reassess what tighter monetary policy could mean for stocks.
Subscribe To Our YouTube Channel To Get Notified Of All Our Videos
📊 Market Statistics & Analysis
Weekly technical overview across key sectors, risk indicators, and market internals

💸 Market & Sector X-Ray: Market Gains Ground
The market struggled again this past week as September continues to play out to form. Technology gained ground and offset the weakness in the rest of the market. With Technology extremely overbought and everything else either approaching or at more oversold levels, a rotation is likely.

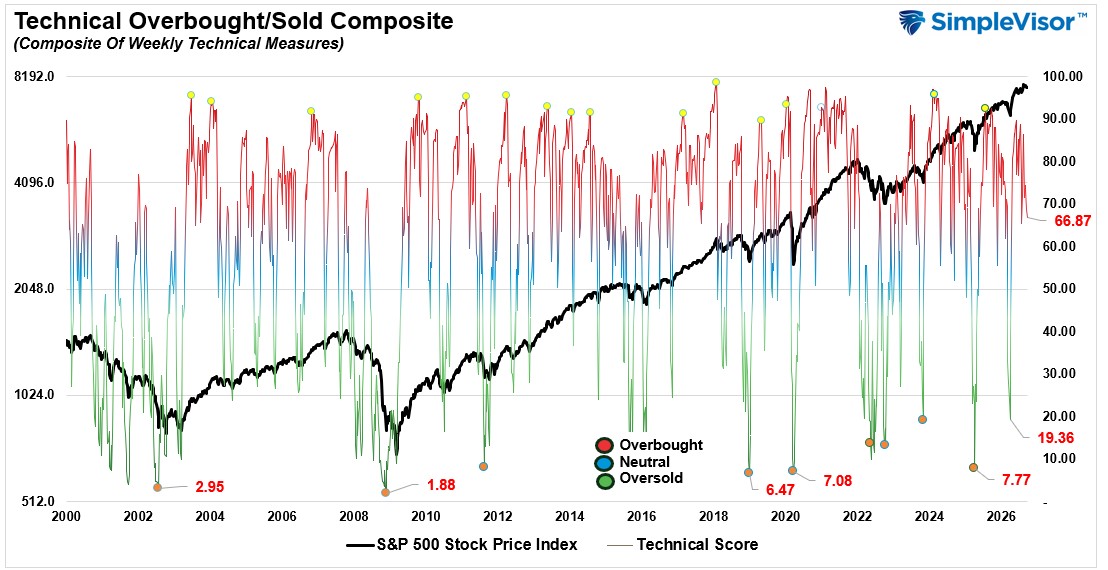
📐 Technical Composite: 66.87 – Overbought Reversing
The technical condition eased mildly again this past week as the market stalled. However, overall, the market remains technically overbought, and sentiment remains mostly bullish for now with no significant technical breaks. Indicator does suggest more struggles for the market next week.
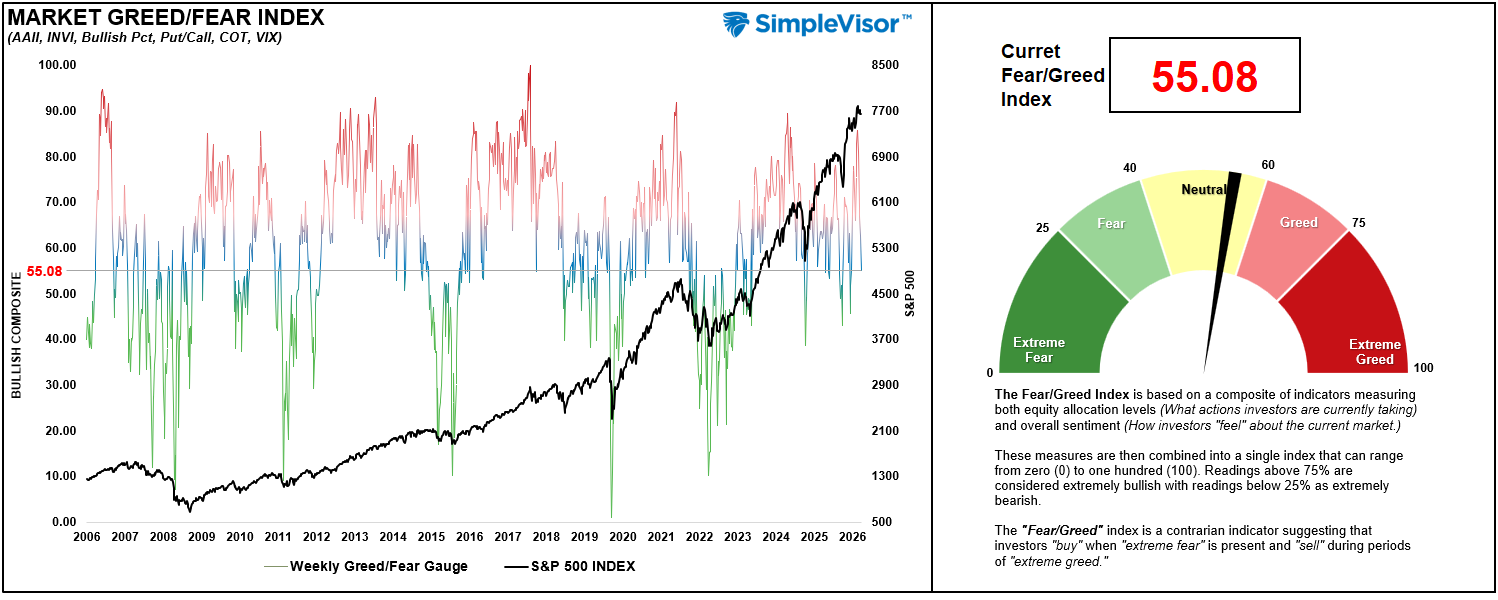
🤑 Fear/Greed Index: 55.08 – Investor Bearishness Increases
Even though the market remained mostly flat last week, the underlying allocation and sentiment to the market reversed further. There was a continued drop in the Commitment of Traders equity allocations, and investor sentiment turned more bearish last week. If the market can continue to hold up as the bearishness increases, it could provide a good buying opportunity in the next month or so.
🔁 Relative Factor Performance
Factor performance has diverged over the last couple of weeks, with Growth, Speculative Technology, and Megacaps now extremely overbought, while Value, Low Beta and Dividend Yield (interest rate sensitive sectors) now the most oversold. A risk-off rotation from seems highly probable. As noted below, this is a “risk aware” market currently and increasing controls seems logical.

📊 MFBR Index (Money Flow/Breadth Ratio Indicator)
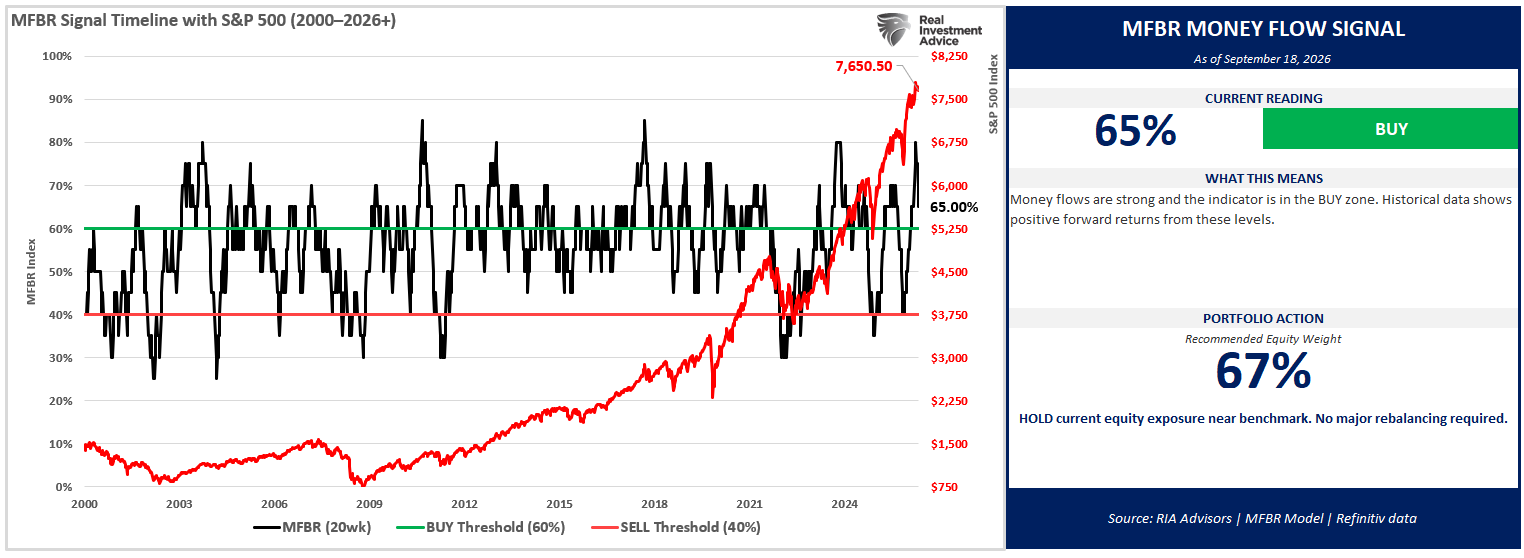
The Money Flow Breadth Ratio (MFBR) model is a rules-based equity allocation framework that uses weekly S&P 500 money flow data to generate buy, sell, and neutral signals. The MFBR systematically adjusts portfolio equity exposure in response to the direction and persistence of institutional capital flows. It aims to reduce drawdowns while capturing the majority of market upside.
“As of September 18, 2026, with the S&P 500 at 7,650.50, the Money Flow Breadth Ratio (MFBR) stands at 65%, down from a peak of 80% set 5 weeks ago and falling versus 70% the prior week. The trailing four-week change is still -10 percentage points, but the near-term trend has rolled over. This places the indicator in BUY territory (60-70%). The raw zone signal reads BUY, but the model still flags a TOP REVERSAL, with 15 points now off the peak. Read that BUY as a zone label, not as fresh confirmation – the model reached this band by falling out of overbought, not by building up from below.
Bottom line: hold the target weight. The roll-over off the 80% peak is real and worth watching, but it has carried the gauge into the band that has historically been the best place to own equities. This is neither a chase nor a de-risk. A sustained break below 60% would move the grid to an underweight; a move back above 70% would re-engage the contrarian trim.”
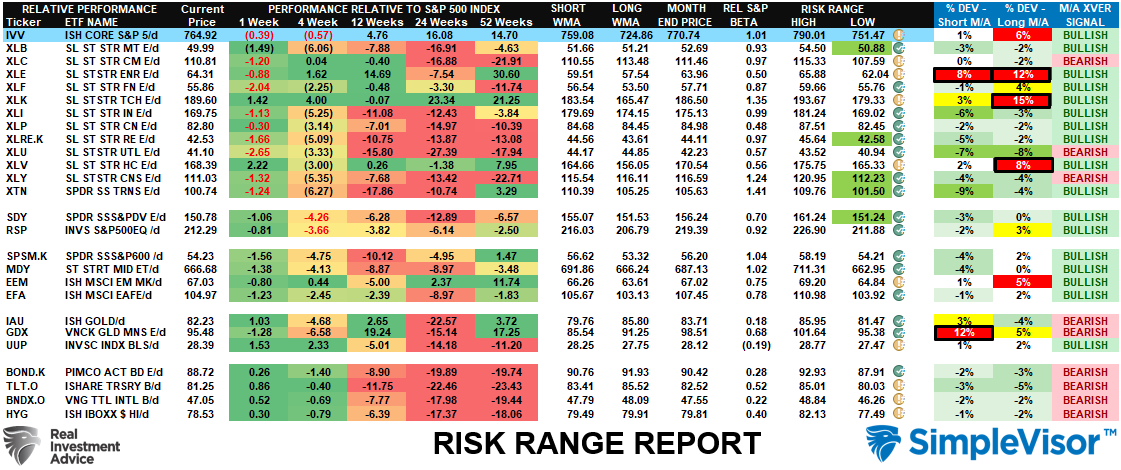
📊 Sector Model & Risk Ranges
Five weeks ago we noted that several sectors of the market were hitting extremes which typically denotes a good opportunity to reduce risk and rebalance holdings. That has remained good advice as the Fed hiked rates this past week and the market continues to consolidate within a small trading range. Energy, Technology and Goldminers are the most deviated from their long term means and should be rebalanced to target. Bonds are extremely oversold and if there is a risk off rotation, we could see money flows into bonds.
Have a great week.
Lance Roberts, CIO, RIA Advisors