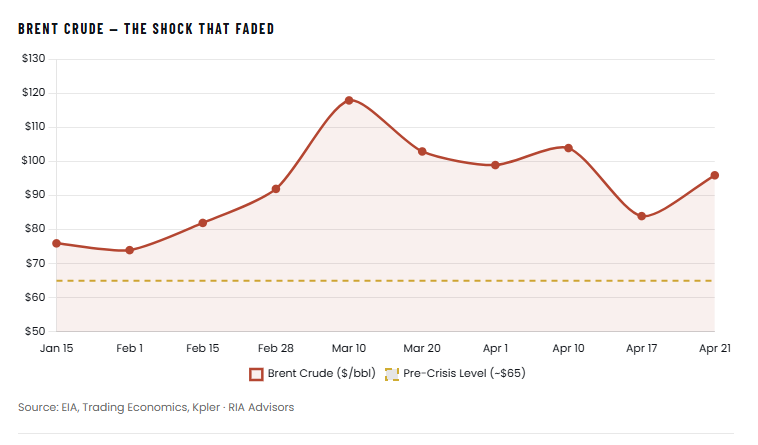
As of this writing, the Strait of Hormuz remains effectively closed since February 28. Roughly 20% of the world’s seaborne oil stopped moving through the chokepoint. The International Energy Agency described the event as “the largest supply disruption in the history of the global oil market.” Gulf producers shut in nearly 9 million barrels a day of production. U.S. gasoline at the pump jumped from $2.98 to over $4.00.
Every historical template for this kind of shock, 1973, 1979, 1990, pointed to a stagflationary body blow that breaks markets. After 30 years of watching cycles play out, I’ve learned that when the tape refuses to confirm a catastrophe narrative, it’s usually seeing something the headlines miss. That’s exactly what is happening with the Strait of Hormuz. Brent peaked near $120 and now sits around $96, well below the $132 the Dallas Fed modeled for a closure lasting three quarters. The S&P 500 is grinding higher. China, which takes roughly a third of its crude through the waterway, hasn’t buckled.
So the question isn’t why the catastrophists were wrong. It’s what they missed, and where the real risks now sit.
Why The Headline Was Worse Than The Reality
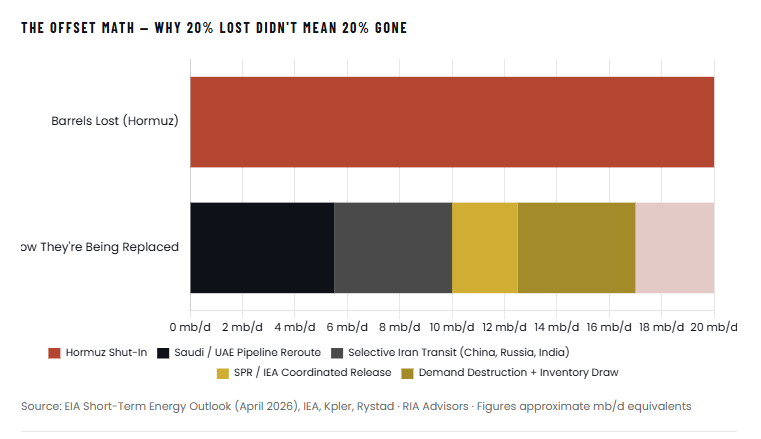
The “20% of global oil closed” framing was always misleading. In reality, the reduction in impact came primarily from four forces, and the primary source documents each.
First, Middle Eastern producers rerouted crude around the strait. Rystad Energy’s Tom Liles estimates that 5 to 6 million barrels a day can flow through Saudi and UAE pipelines terminating at the Red Sea and the Gulf of Oman. That’s roughly a third of the region’s normal seaborne exports, redirected within weeks. By late March, Iran had also granted transit rights to tankers flagged by China, Russia, India, Iraq, and Pakistan. In other words, Iran’s move to close the Strait of Hormuz served as a rationing mechanism rather than a closure.
Secondly, the strategic reserves finally worked as designed. The IEA coordinated a 400-million-barrel release, the largest in its history. The U.S. SPR alone is putting 1.4 million barrels a day on the water. Bernstein’s research team captured the ceiling on that policy response in a single line:

That’s correct, and that’s also enough. Buying time was the entire job while pipeline workarounds scaled and demand destruction started to bite.
Third, China came into the crisis loaded. EIA data show Chinese commercial oil inventories near 1 billion barrels heading into February 2026, plus another 360 million barrels of state reserve. That’s several months of imports on hand. Combined with Iran’s selective transit allowance, Beijing was never going to let this break its economy.

Finally, and most importantly, the United States has dramatically changed structurally since the 1970s. Domestic crude production exceeds 13 million barrels a day, which insulates the US against foreign shocks, as we saw during the Arab Embargo. Furthermore, LNG exports averaged nearly 18 billion cubic feet per day in March, according to the EIA’s April Short-Term Energy Outlook. Less than 10% of the U.S. crude supply transits the Strait of Hormuz. In a global supply shock, America is the marginal supplier, not the marginal victim.
Notably, the Dallas Fed’s worst-case scenario for a closure confines the damage to a single quarter, estimating a 2.9 percentage point annualized hit to global real GDP. We’re tracking closer to the base case, which assumed rerouting, reserves, and demand response would absorb most of the damage. So far, they have.

The Real Risk Sits On The Other Side
Here’s where I think consensus is mispricing the setup. If the catastrophist case on oil was wrong going in, the bullish case on oil from $96 is probably wrong going out.
When the Strait of Hormuz fully reopens, three things hit at once.
- Gulf producers restart roughly 9 million barrels a day of shut-in capacity, matching the EIA’s April forecast.
- Tankers parked in regional storage release their cargoes, and
- U.S. shale, recapitalized at $95 crude, keeps pumping at peak rates.
This is a textbook oversupply setup.
The only genuine offset is SPR rebuilding. More than 30 IEA countries drew down reserves and will spend the back half of 2026 refilling them. Kpler’s commodity analysts recently noted that “the back end of the curve is widely viewed as undervalued,” with Brent for late 2026 delivery priced around $74, versus their fair-value estimate of around $85.
I agree with the direction but not the magnitude. Restocking demand is real, but it spreads over quarters while supply returns over weeks. That asymmetry is the dislocation risk. My base case is that Brent retraces toward the low $70s within 90 days of a durable ceasefire. However, there is a decent risk of an overshoot toward $60 if demand destruction from $4+ gasoline lingers. That’s not a prediction of a crude collapse, but rather a prediction that the pain won’t be symmetrical. The upside from here is modest. The downside scenario is sharp.
The Market Has Already Pivoted To Earnings
I really think the market already knows all of this, the supply shock has been metabolized, and earnings are now driving the tape. And in this case, the bulls have the data.
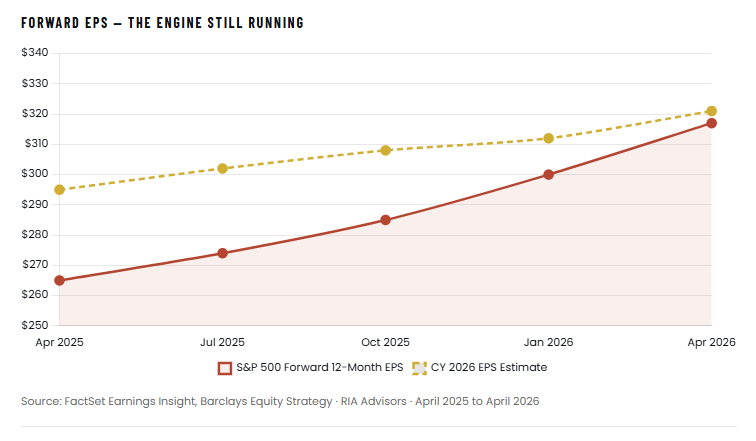
FactSet’s April 17 Earnings Insight shows 88% of reporting S&P 500 companies have beaten first-quarter EPS estimates, well above the 10-year average of 76%. Aggregate earnings are coming in 10.8% above estimates, versus the historical 7.1%. Analysts now project 18% full year 2026 earnings growth. Barclays’ Venu Krishna lifted his 2026 EPS estimate to $321 from $305. FactSet’s 2026 net margin forecast sits at 13.9%, the highest on record. Goldman Sachs framed the dynamic in a January note, arguing that earnings growth, not multiple expansion, would do “the heavy lifting” for index returns.
Furthermore, as shown, analysts are not only hiking earnings projections for 2026, but 2027 as well with those upward revisions heavily outpacing historical norms.

That’s a legitimately constructive backdrop. Stocks do follow earnings over time, and the Q1 beat rate is signaling real operating resilience. The market isn’t bid higher on hope. It’s bid higher on delivered numbers.
Two caveats, though.
First, forward earnings estimates almost always rise until they don’t. Rising forward EPS is the default state of every expansion, not a unique bullish signal. What matters is when revisions roll over, and they roll over with a lag. Goldman’s Ben Snider recently noted that a narrow slice of revisions, concentrated in names like Exxon Mobil and Micron Technology, has done most of the work behind the S&P 500’s record highs. The median index constituent has seen little upward revision. That’s a rally leaning on a few winners, not a broad upgrade.
Furthermore, the forward 12-month P/E sits at 20.9, above the 5-year average of 19.9 and the 10-year average of 18.9. At those multiples, a clean beat earns a muted reaction. A guidance cut gets punished hard. The real test isn’t Q1 numbers. It’s Q2 guidance. If retail, travel, and discretionary names start trimming outlooks once the $4+ gasoline hits flows through consumer wallets, forward estimates finally break their uptrend.
Until that happens, the path of least resistance is still higher.

How To Position From Here
I realize that many readers will not agree with me. That’s okay, and as always, it takes two opinions to make a market, and both think they are right. However, after 30 years of navigating portfolios through shocks like this one, here are some suggestions to consider, given the Strait of Hormuz setup and stretched equity valuations.
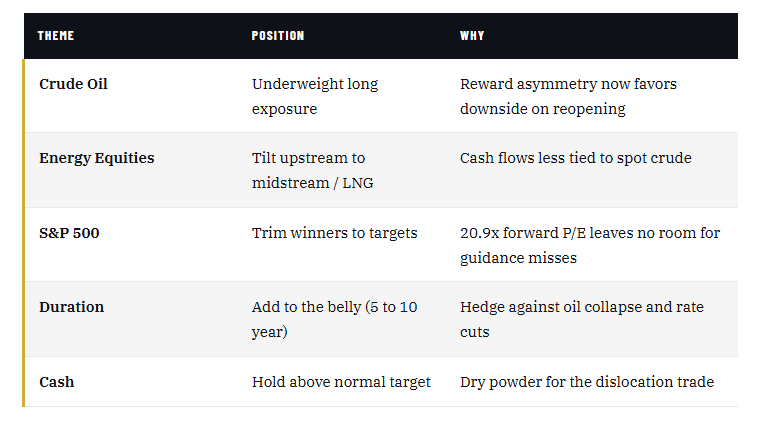
Don’t chase the oil rally. Crude is trading geopolitics, not fundamentals. The reward profile on long crude from $96 is skewed against you. Therefore, if you own energy producers up 40%, take the win and don’t get greedy. Furthermore, don’t add to them at this juncture.
Own energy infrastructure, not barrels. Midstream operators and LNG exporters have less exposure to commodity prices and benefit from a world that now prioritizes energy security over cost. Those cash flows don’t collapse at $70 Brent.
Respect the equity message without stretching for it. At 20.9x forward earnings, the S&P 500 isn’t priced for accidents. Trim your biggest winners back toward target weights. Adding to the strength here is paying a tax.
Hold duration. Treasuries have priced in resilient growth. If oil retraces hard and demand destruction lingers, the Fed gets cover to ease. The belly of the curve rallies. That’s a natural hedge against the oversupply scenario described above.
Keep cash. Equities, oil, and credit are all pricing a clean exit from the conflict. If that exit slips, either through a broken ceasefire or through oversupply hitting before restocking ramps, dry powder becomes the most valuable asset in the book.
Bottom line: The market isn’t wrong to be calm about the Strait of Hormuz, and it isn’t wrong to be bid on earnings. But the risk has rotated. It’s moved from a spike in oil to a collapse in oil, and from geopolitics to the equity multiple. Both sides of that trade need managing, not ignoring, because the tape is calm.
Sources
- Wikipedia, “2026 Strait of Hormuz crisis” (IEA characterization of supply disruption; Iran selective transit policy).
- PBS NewsHour, “Oil prices spike again following latest standoff in the Strait of Hormuz,” April 2026 (AAA retail gasoline pricing).
- Trading Economics / Fortune, Brent crude spot pricing, April 21, 2026.
- Federal Reserve Bank of Dallas, “What the closure of the Strait of Hormuz means for the global economy,” March 20, 2026.
- CNBC, “The biggest release of emergency oil stockpiles in history was announced,” March 14, 2026 (Rystad Energy and Bernstein commentary).
- U.S. Energy Information Administration, “China, the United States, and Japan hold most strategic oil inventories in 2025,” April 2026.
- U.S. Energy Information Administration, April 2026 Short-Term Energy Outlook.
- Kpler, “Iran war and the Strait of Hormuz: oil market implications six weeks in,” April 7, 2026.
- FactSet Earnings Insight, April 17, 2026.
- FinancialContent / TheStreet, “Barclays and FactSet Upgrade 2026 S&P 500 EPS Forecasts,” April 2026 (Venu Krishna commentary).
- TheStreet, “Goldman Sachs sends strong message on S&P 500 earnings outlook,” January 9, 2026.
- Prism News, “Goldman says narrow earnings revisions are driving S&P 500 record highs,” April 2026 (Ben Snider commentary).

