
As we wrote in Yesterday’s Commentary, the broad market indexes have surged since the April lows, driven largely by a handful of technology and AI stocks and the benefit of massive options volumes. Among the leaders is Nvidia (NVDA), climbing nearly 40% from the April lows. Tomorrow, NVDA reports earnings, which, given its leadership role and massive market cap, could spark volatility in the stock as well as in many of the technology stocks that have driven the strong bullish uptrend.
The bullish case is well discussed in the media. AI infrastructure spending from the hyperscalers (Microsoft, Google, Amazon, and Meta) remains robust, and NVDA’s data center revenue will consistently exceed expectations. As is the norm with NVDA, they will likely beat expectations, and the market’s primary focus will be on their forward guidance.
However, there are a few factors that could result in a negative outcome:
Rates are rising. The 30-year UST yield is now above 5.00%. High interest rates compress the multiples that help justify NVDA’s valuation. A strong earnings report may not be enough if the rate backdrop continues to deteriorate.
The Gamma setup is extreme. As we noted in yesterday’s Commentary, S&P 500 gamma exposure has surged to one of the highest levels since 2021. A disappointment from NVDA could trigger an unwind of the gamma squeeze.
Expectations are high. Semiconductor stock prices are likely getting ahead of their future earnings. Earnings and guidance beats are getting harder to hit, and the bar is rising with every quarter.

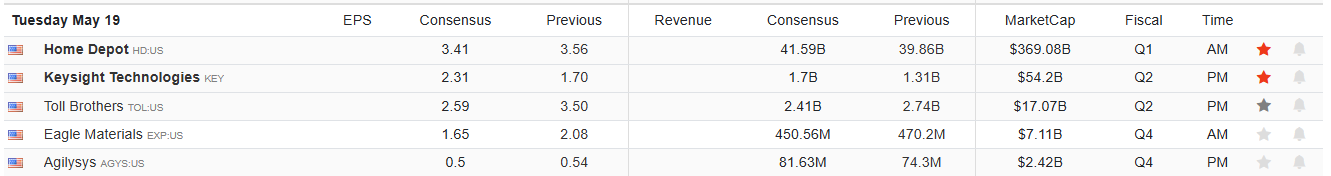
What To Watch Today
Earnings
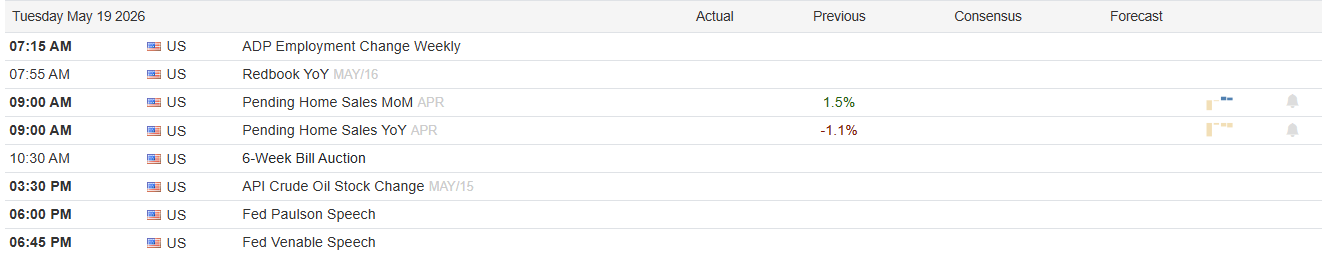
Economy
Market Trading Update
Yesterday, we discussed the technical backdrop of the market. Friday’s semiconductor pullback finally landed a real punch on the chip complex. After running roughly 70% year-to-date, the VanEck Semiconductor ETF (SMH) gave back 3.8% to close at $556.34. Nvidia (NVDA) fell 4.4%, AMD lost 5.7%, Micron dropped 6.6%, and ARM was hit for nearly 8.5%. The selling wasn’t subtle. It was the kind of session that grabs your attention after months of one-way price action, and you can see the damage spread across the major names below.

Yesterday gave us a first read on whether the bid would show up after the flush. It didn’t. SMH leaked further, and Nvidia slid a bit even as several analysts, including Morgan Stanley, raised price targets ahead of Wednesday. However, AMD, Micron, and ARM stayed soft, and the broader Nasdaq drifted lower. The dispersion underneath tells you something, and the risk is that anything that starts to worry investors about future earnings growth could get ugly, quickly.
So here’s the question every momentum trader is wrestling with this morning. Is this the end of the chase, or just a pause ahead of the catalyst?
The bottom line is that one ugly Friday after a 70% YTD run is normal tape behavior, not a regime change. Markets don’t reverse trends on a CPI surprise. They reverse when fundamentals turn. But the setup matters. The SOX is up roughly 250% from the April lows, and YTD prints for Sandisk (+552%), Intel (+251%), and Micron (+179%) rhyme uncomfortably with the late 1990s. When too many positions crowd into the same trade at the same valuation, even a small shift in narrative produces an outsized move. That’s exactly what Friday looked like.
Wednesday’s Nvidia print is the next real test. Consensus calls for roughly $78 billion in revenue, $1.76 in EPS, and gross margins north of 74%.

Options are pricing in a close to 8.6% move post-earnings, which tells you how loaded the setup is. A clean beat with strong forward guidance on data center capex re-arms the bulls and likely extends the trend through summer. A miss, or softer guidance, hands the bears the story they’ve been pitching for six months.
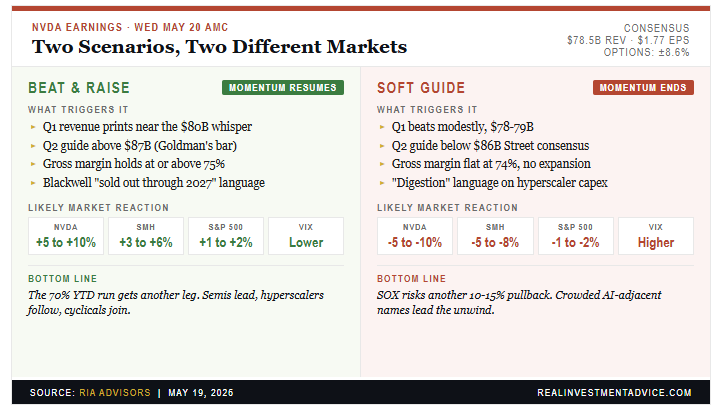
What are we watching specifically? The data center growth rate and the hyperscaler capex commentary. Those are the two variables that decide whether the AI capex cycle is still expanding or starting to mature. As we’ve noted previously, the day the hyperscaler commentary turns is the day the trade changes. Not before.
For now, this looks like a breather, not a top. However, after a 70% ramp, “breather” can still mean another 10% to 15% pullback before real buyers reappear. Position accordingly into Wednesday’s print, and don’t confuse two days of price action for a thesis.

Micron And Johnson & Johnson: Will The Rotation Reverse?
Over the last month, Micron (MU) has risen by nearly 70%, while Johnson & Johnson (JNJ) is down about 2%. The graphic below looks at the Momentum factor ETF (MTUM) and two of its top ten holdings to better highlight how extreme the growth-value rotation has been. The graph on the right shows that over the last six weeks, MU has moved from slightly oversold on an absolute basis and from fair value relative to the S&P 500, to grossly overbought on both metrics. At the same time, JNJ moved from slightly overbought on an absolute and relative basis to fair value on an absolute basis but slightly overbought on a relative one.
So, as we contemplate how this period of bad breadth, marked by high sector dispersion, may play out, this graph offers a possible answer. The value stocks of the world, like JNJ, may be due for outperformance, while the high-flying technology companies, like MU, are due for relative underperformance. From a macro perspective, the question is whether this likely growth-to-value rotation occurs in a down market, or whether the market remains stable as value sectors compensate for weaker technology stocks.

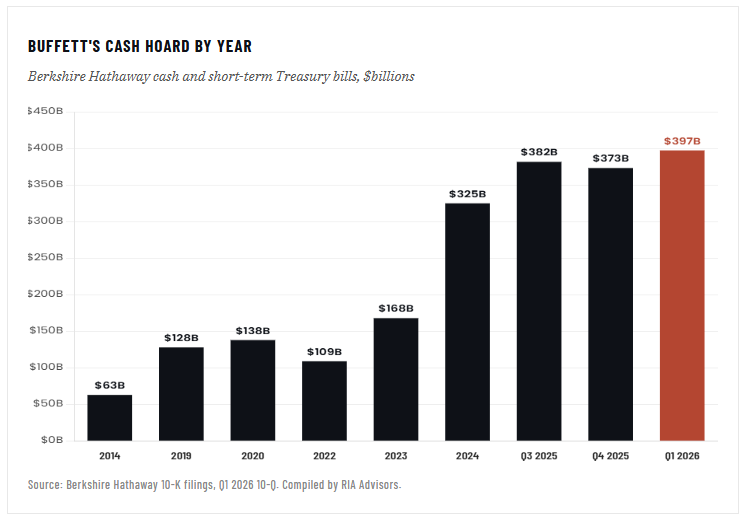
Buffett Cash Hoard: Why $397 Billions Sits On The Sidelines
$397 billion. That’s how much “Buffett cash” now sits on Berkshire Hathaway’s balance sheet after Greg Abel’s first quarter as CEO. Warren Buffett left $373 billion behind when he stepped down at the end of 2025. Three months later, after Abel’s debut earnings report on Saturday, the hoard had grown by another $24 billion. The figure is bigger than the GDP of Hong Kong or Norway. It exceeds the market value of every American corporation except a tiny handful of mega-cap names. And it earned roughly four to five percent in Treasury bills while the S&P 500 ripped through three of its best consecutive years in modern history.
That Buffett cash hoard has also created a lot of speculation, innuendo, and assumptions, which is what I want to walk through in today’s discussion. Primarily, what that cash hoard actually represents, the popular theories explaining it, and what it really costs shareholders to hold.
The headline cash hoard number is striking on its own. Berkshire Hathaway ended Q1 2026 with a record $397.4 billion in cash and short-term Treasury bills, surpassing the prior $381.7 billion peak set in Q3 2025 and adding another $24 billion to what Buffett left behind. Of that, roughly $52 billion sits in plain cash and equivalents, with the bulk parked in Treasury bills earning short-term yields. By the time Abel released his first quarterly print on May 2, Berkshire was one of the largest holders of US Treasury debt in the world.
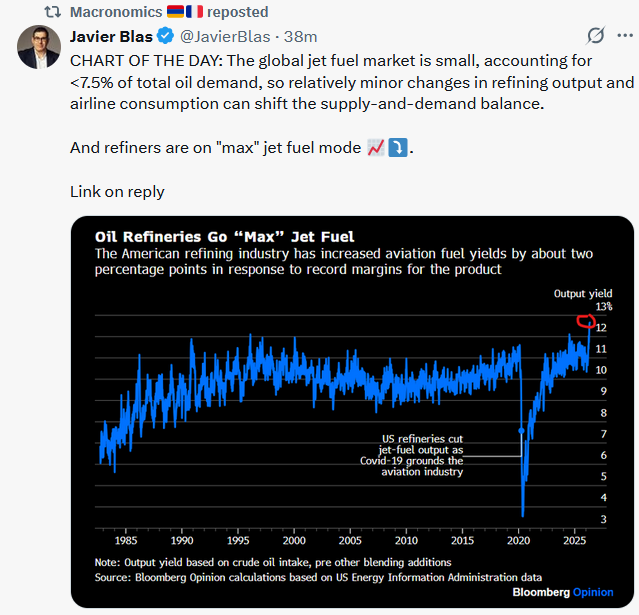
Tweet of the Day
“Want to achieve better long-term success in managing your portfolio? Here are our 15-trading rules for managing market risks.”
Please subscribe to the daily commentary to receive these updates every morning before the opening bell.
If you found this blog useful, please send it to someone else, share it on social media, or contact us to set up a meeting.

