
Since the Iranian conflict started on February 28, 2026, gold has fallen by about 25%. The decline is shown in the graphic below, but more importantly, we highlight FinViz’s rationale for why gold traded lower on June 10th. That day, they claim war and hot inflation are the culprits for gold falling by 1.1%. We bet that if you asked 1000 gold investors on the eve of the Iranian conflict how gold would perform if the war raged for months and significantly higher oil prices pushed inflation over 4%, 999 would be looking for gains. Despite what most investors thought was good news for the metal, gold prices disappointed. Let’s explore why we think this is occurring.
For starters, and as we have mentioned on numerous occasions, the price of gold more than doubled from January 2025 to the end of February 2026. The rationale was that high deficits were debasing the dollar. The narrative and strong momentum roped in many gold investors, resulting in the metal grossly outperforming. Bottom line, regardless of the news and narratives, gold prices were grossly extended and due for corrective action.
Second, the gold rally occurred while real rates (nominal yields less inflation) were high and rising. As we have quantified in numerous articles, gold prices often have a strong negative correlation with real rates. High real rates, denoting a hawkish, restrictive monetary policy, typically correlate with lower gold prices. Conversely, low to negative real rates point to easy policy and are usually friendly to gold investors. The relationship stopped working for the last two years. With real rates remaining high and the Fed moving to a more hawkish stance, might the historical correlation be reasserting itself? Might gold investors be betting on a hawkish Fed?
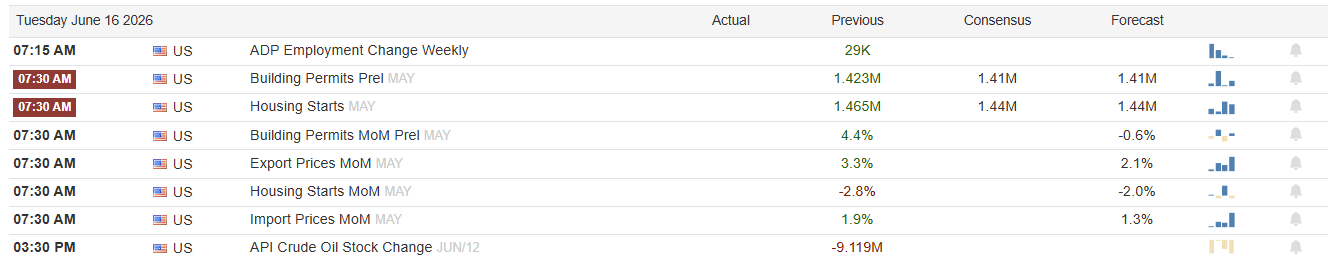
What To Watch Today
Earnings

Economy
Market Trading Update
Yesterday, we discussed the technical backdrop of the market following the 50-DMA test. The setup heading into this week is as clean as the tape allows. Over the weekend, Washington and Tehran reached a peace agreement reopening the Strait of Hormuz and lifting the U.S. naval blockade, with the signing set for Friday, June 19. Oil did what oil does when a war premium evaporates. WTI fell to around $80, and Brent dropped near $84 Monday morning, down hard from the $114 Brent print we saw back in March when the shooting started. The single biggest macro overhang of the past three months just got cleared.
Back up and look at how we got here. The S&P 500 sank to 6,343 in late March as the conflict and the oil spike hit, then ripped roughly 16% off that low to better than 7,609 by early June before a profit-taking pullback. As of Friday’s close, the index sat at 7,431, holding above its 50-day average near 7,248, with RSI back to a neutral 52.7. Make no mistake, the market already did the hard part. It corrected to the moving average, washed momentum out below 40, and rebounded. The deal is the match on the next leg.
So I ran the history. Going back to 1950, I screened for every time the S&P got overbought above 70 on RSI, corrected to its 50-day line while RSI fell under 40, then turned back up. That has happened 115 times. The forward numbers lean firmly bullish through the intermediate term. Six months out, the median gain is 5.5% with a 77% hit rate, well ahead of the 70% you get buying on any random day. And a full quarter of those episodes returned north of 20% over the following year.

Here’s the trade-off, and I won’t bury it. This signal failed badly in 1973, 1987, and 2001, the times when a real bear market was already running underneath the bounce. The base rates favor the bulls, but they don’t guarantee it.
What does this mean for how we’re trading it? Stay long and lean into strength, but do it with a plan, not a prayer. Use the 50-day near 7,248 as your line in the sand. Above it, the rebound playbook remains intact, and dips are buying opportunities. A daily close back below it, especially on a failed retest of the 7,600 highs, is your cue to raise cash and respect the 1987 tail. Trade the setup you have, not the one you fear.
If you didn’t read yesterday’s blog, the list remains a good process to follow.


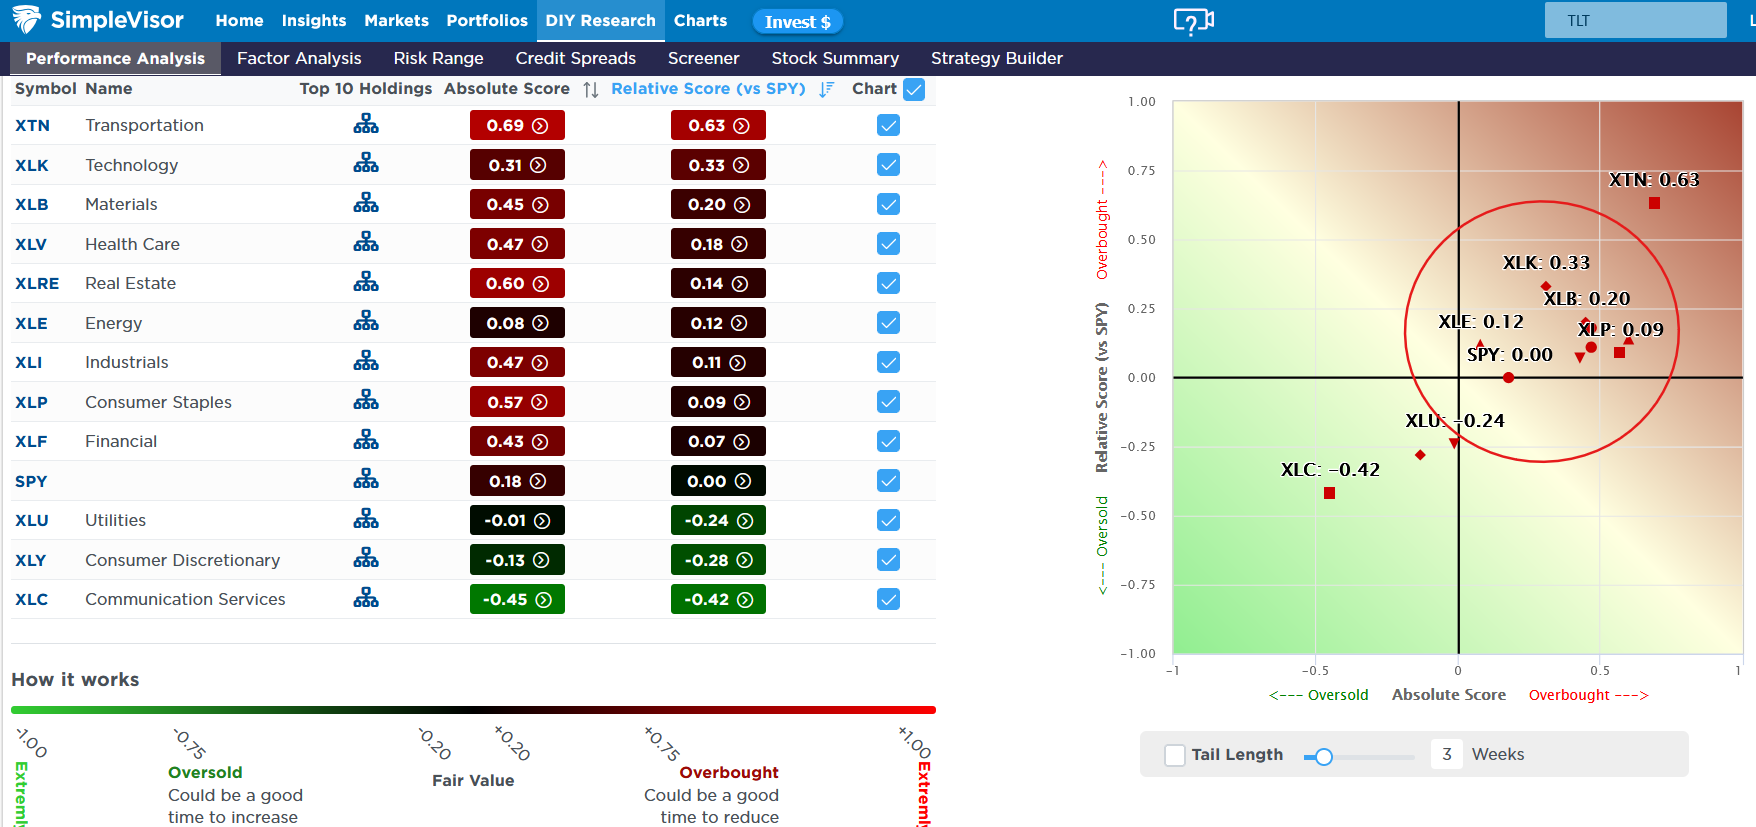
Pullback Cleans Up Bad Breadth
Corrections are healthy market adjustments. As the term suggests, they temper episodes of investor over-bullishness. Such was the case over the last few weeks with high-growth chip and hardware technology stocks grossly outperforming the market, while most other sectors and factors woefully underperformed. With the recent correction, breadth has vastly improved, and many sectors are now clustered as we circle. Technology and utilities, sectors we flagged as very overbought and oversold two weeks ago, are now much more aligned.
With the market trading better on the Iran situation, will we once again see breadth weaken, with the larger-cap technology sector leading the way? We suspect that may be the case, but we are cautious that the recent rally could be short-lived. Keep an eye on the key moving averages that are currently acting as support and resistance for clues.
Bull Market Pullback
Two weeks ago, after the S&P 500 logged its ninth consecutive weekly gain, we discussed that a bull market pullback was coming. It came. From the May 27 record near 7,621, the index slid 4.5% and bottomed almost exactly on its 50-day moving average before ripping back to close Friday at 7,431.46. That is not the opening act of a bear market. That is the kind of bull market pullback that resets sentiment and, more often than not, clears the runway for the next leg higher. The harder question is what happens after the bounce.
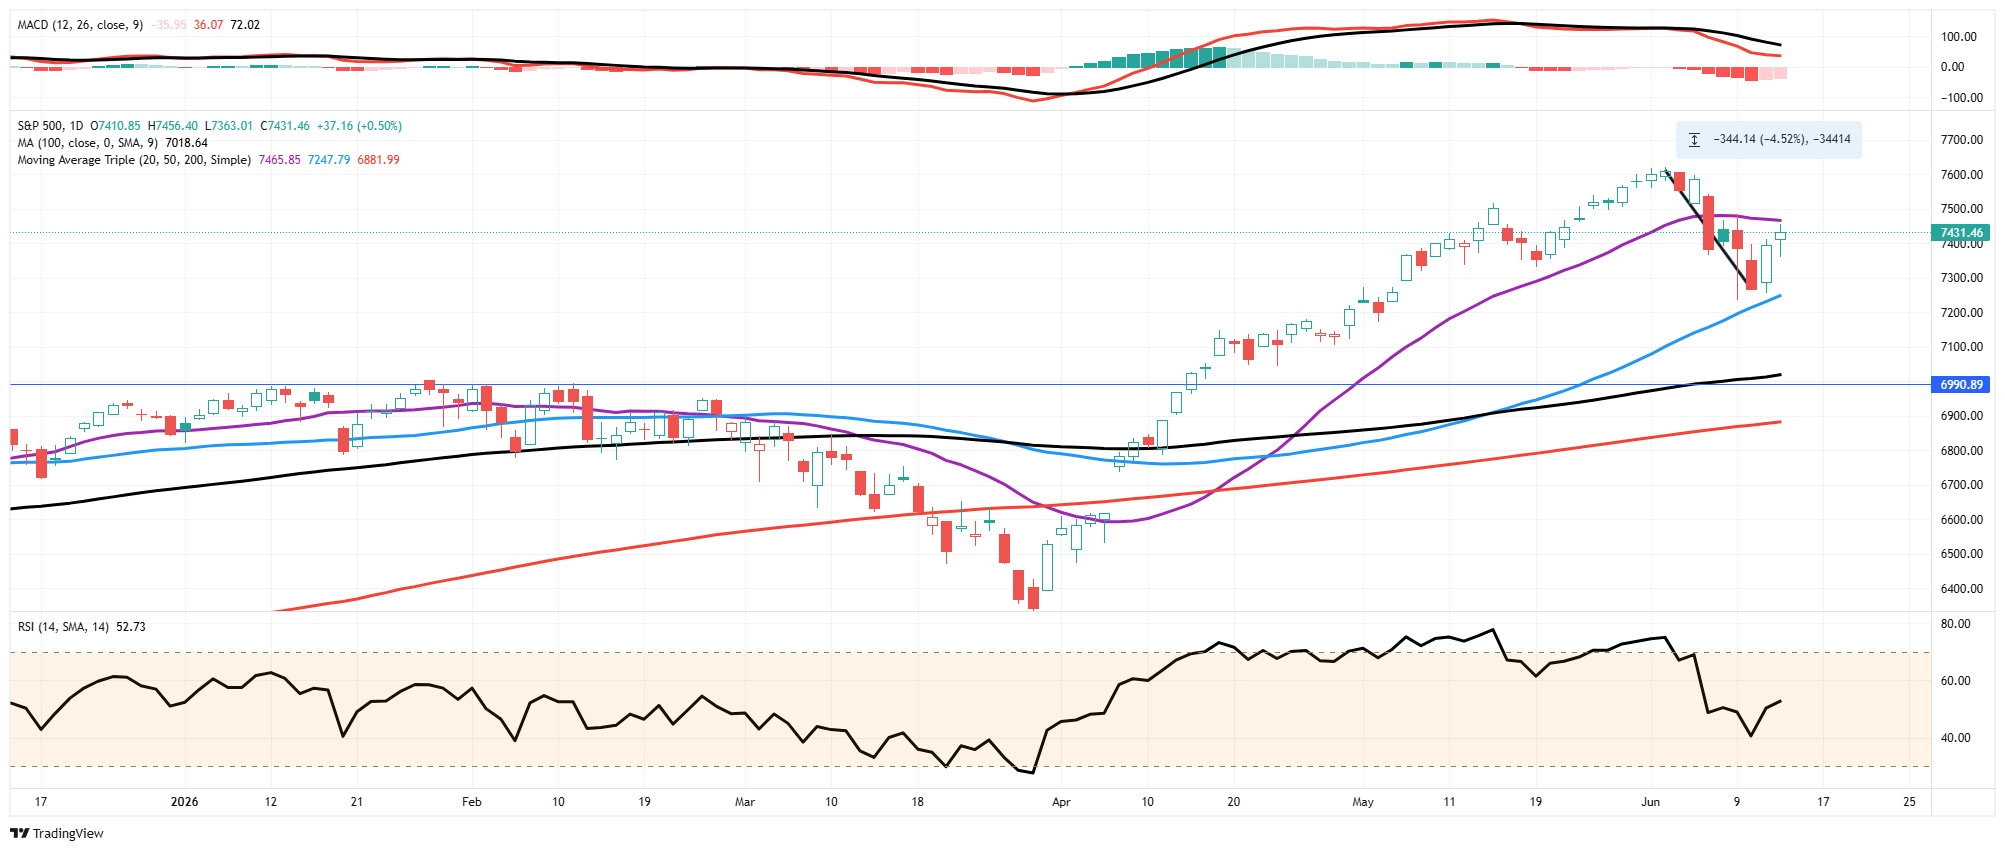
Make no mistake, I have been warning about the potential for a pullback over the last few weeks and repeatedly discussed taking profits and rebalancing risk. As I wrote in “Two-Month Market Rally: What Comes Next,” a market that climbs for 9 straight weeks gets stretched, and stretched markets tend to mean-revert. The only real questions were the “when” and “how much.” We suggested a bull-market pullback of 3% to 5%; toward the 50-day moving average, would be most likely. However, a larger correction is still possible. As noted, the actual decline ran 4.5% peak to trough and found its floor exactly where trend-followers add rather than abandon.
Notably, the dip buyers showed up on cue. When the S&P probed the mid-7,200s on Tuesday and Wednesday of last week, the same crowd that has bought every dip since the April 2025 low stepped in again, and by Friday the index had clawed back roughly a quarter of the prior week’s 2.64% drubbing. That close at 7,431.46 leaves the larger uptrend fully intact, sitting about 2.5% below the high rather than careening away from it.
Crucially, the setup still favors the bulls, at least for now.

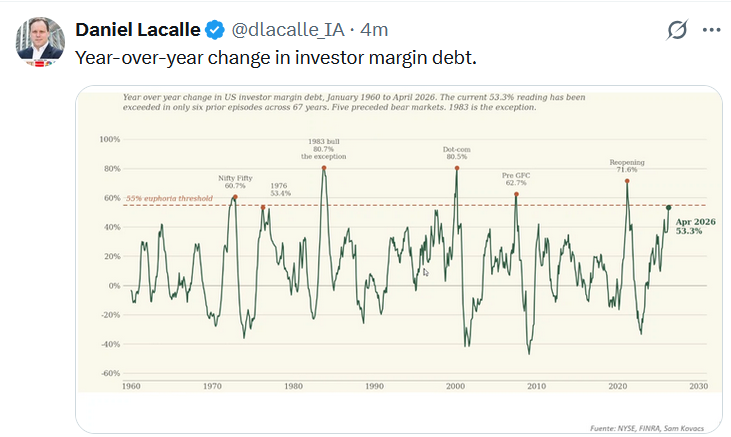
Tweet of the Day
New UPDATED Trading Rules With Desktop Printout
“Want to achieve better long-term success in managing your portfolio? Here are our 15-trading rules for managing market risks.”
Please subscribe to the daily commentary to receive these updates every morning before the opening bell.
If you found this blog useful, please send it to someone else, share it on social media, or contact us to set up a meeting.

