
Twenty-five years ago today, nearly 3,000 people lost their lives in the September 11th attacks, a tragedy that reshaped our country. We pause to honor those who lost their lives in the event. In the years since the crisis, financial markets have absorbed the shock, adapted, and moved forward. Beyond remembering the event and honoring the victims, we can also use the 25th anniversary to remind ourselves how geopolitical crises impact markets.
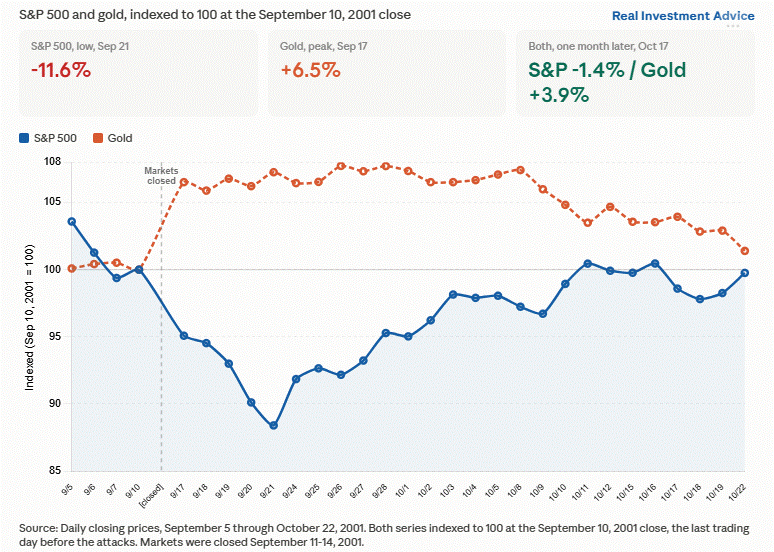
On September 17, 2001, after a four-trading-day closure, markets reopened, with the S&P 500 falling 4.9% and gold jumping 6.5% in a predictable flight-to-safety trade. In the following days, the S&P 500 fell further, bottoming at nearly 12% below the pre-attack close. As we show below, within a couple of weeks, both assets started to reverse their initial moves. Within a month, the S&P 500 completely recouped its loss, and gold’s spike faded.
That pattern, a sharp initial move that reverses meaningfully within weeks, isn’t unique to the September 11th crisis.
A Yahoo Finance review of nine major geopolitical shocks since 1990 found that the direction in which gold and stocks moved on day one matched the direction they’d moved a month later less than 56% of the time. The lessons of post-September 11th trading are worth remembering, especially as the situation in Iran remains hot. A market’s first reaction to a crisis reveals fear and often unsubstantiated concerns. However, when some rationality returns, more information emerges, and the initial shock fades, most asset prices reverse course and trend back to where they were before the crisis.
What To Watch Today
Earnings
- No earnings reports today.
Economy
Market Trading Update
Yesterday, we walked through how crowded this market has become, with the 10-year yield at its highest since 2023 as one more trade leaning the same way. Today, let’s pull on that one thread, because rising interest rates are the crowded trade that reprices every other one.
For most of this year, higher yields didn’t stop stocks. The two climbed together. The 10-year has ground up from a 3.97% low last October to 4.80% now, its highest since 2023, and the index kept printing records into August. Notice in the chart below where that stopped working.

Since the August 13 peak at 7,796, the tape has slipped while yields pushed to new highs. That divergence is the whole point. When the multiple has to carry the load on its own, a discount rate that keeps climbing finally starts to bite. The 30-year above 5.25% only sharpens it. This market cycle ran on a falling cost of capital that has now stopped falling.
So where does the risk actually sit? Start with the tape.

The S&P trades near 7,610 as I write, pinned to its 50-day average around 7,600, the floor of a month-long range. Momentum turned weeks ago. The 14-day RSI has held below 50 for weeks, and the MACD rolled under its signal line. We flagged that September setup earlier this month, and it had teeth. As we noted yesterday, Deutsche Bank puts vol-control positioning at the 100th percentile, and a VIX near 14 is what Santoli called “eerie complacency.” When everyone leans one way, the exits get narrow.
Here’s the math that matters. The index still sits about 7% above its rising 200-day near 7,150. Lose 7,600, and there’s little real support until that line, roughly 6% below the tape and 8% below the record. That’s a garden-variety correction, NOT a crash, but it’s the air pocket rising rates are quietly repricing. Stretched is not broken. The asymmetry just stopped rewarding the reach.
For now, continue to manage risk rather than predict it. We previously trimmed winners back to target weight, lifting quality, and holding the cash buffer. We’re not adding duration or the most rate-sensitive momentum names into a tape where the discount rate is the swing factor. Howard Marks put it plainly: you can’t predict, but you can prepare.
Watch 7,600. Manage risk at the line, not after it breaks. The reward for riding the last of a rate-fueled melt-up is thin. Handing back a year of gains to make a point is not a plan.

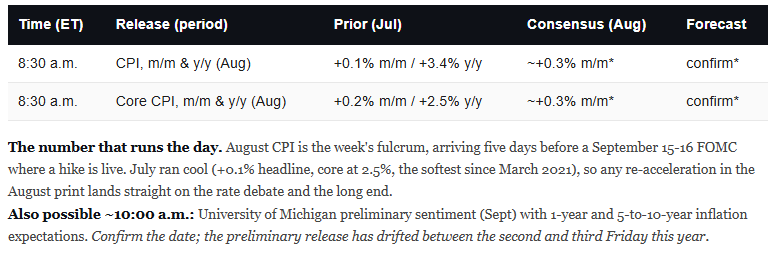
PPI And What To Expect From CPI
August producer prices rose 0.4% for the month, matching the consensus and pushing the annual rate to 5.4%, 0.1% above expectations. However, strip out food and energy, and core PPI rose just 0.2%, undershooting the 0.3% forecast. Two very different inflation narratives are likely to emerge from the data.
Final demand energy jumped 4.2% in a single month with diesel fuel spiking 24.1%, consistent with the crude oil surge. Energy accounted for over three-quarters of the entire rise in goods prices. Hawkish opinions will point to the 5.4% annual headline, the highest since this cycle began, reaccelerating, and argue the Fed must act at next week’s FOMC meeting.
Core PPI decelerating to 0.2%, below forecast, is, in our opinion, the more important number for anyone trying to gauge underlying inflation momentum. Services prices rose just 0.1%, the lowest reading in months, and even the core PPI less trade services data point was mild. Those who think the Fed should hold rates steady will argue this is an energy shock on top of cooling underlying inflation. Since the Fed can’t impact the war and oil prices, they should hold rates steady.
PPI feeds directly into CPI, meaning the same themes should carry over to today’s CPI report. Expect headline CPI to run hot on energy prices and related costs, while core CPI will likely be tame, mirroring PPI’s divergence. Whether the Fed treats tomorrow’s headline or core number as the more important will tell us a lot about which camp holds the upper hand at the Fed.


Tweet of the Day
New UPDATED Trading Rules With Desktop Printout
“Want to achieve better long-term success in managing your portfolio? Here are our 15-trading rules for managing market risks.”
Please subscribe to the daily commentary to receive these updates every morning before the opening bell.
If you found this blog useful, please send it to someone else, share it on social media, or contact us to set up a meeting.