
🔎 At a Glance
- Big Bank Earnings Kick Off Earnings Season
- Market Brief & Technical Review
- From Lance’s Desk: AI Capex Risk Cuts Both Ways In The American Economy – RIA
- Market stats, screens, and risk indicators
🏛️ Market Brief – Mega-Cap Tech Retakes The Lead
The tape flipped its script this week. As we noted two weeks ago, we rotated back to the mega-cap growth stocks. Since then, the mega-cap complex grabbed the wheel again and dragged the index within a whisker of a new record. The S&P 500 rose 1.38% to close Friday at 7,575. That leaves it less than 1% below the June 2 all-time high of roughly 7,612. The Nasdaq Composite added about 1.8%, and the winners were exactly the names you would guess.
Meta Platforms exploded 14.5% on the week. Nvidia tacked on 7.8%. That is where the fuel came from, and the breadth numbers prove it. The Dow slipped 0.30%, the Russell 2000 fell 0.53%, and the S&P 500 Equal Weight index dipped 0.18%. Read that again. The cap-weighted benchmark climbed while the average stock went nowhere or lost ground. That is the opposite of the broadening we flagged in last week’s discussion of the rotation. Narrow leadership is back.
The macro backdrop is where things get interesting. June payrolls came in at just 57,000, roughly half of what economists penciled in. Furthermore, the unemployment rate ticked to 4.2%. Softer labor data would normally be a warning, yet the market cheered it, because it pushed the odds of a September rate cut up toward 80%.
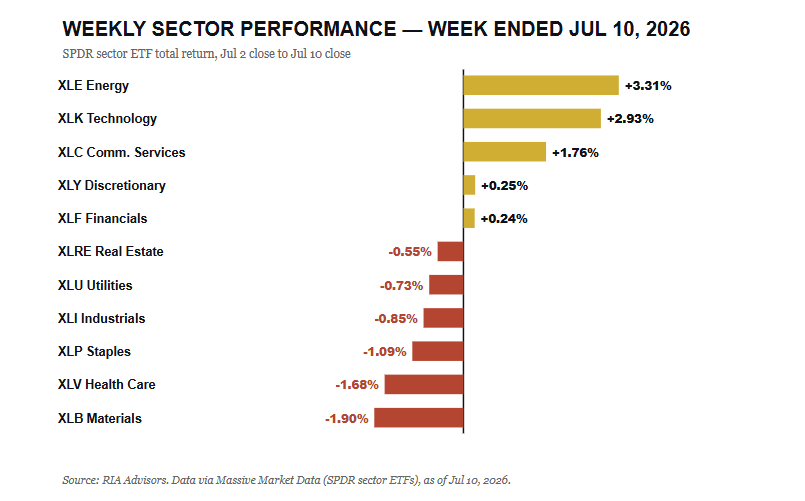
The problem is that inflation refuses to cooperate. May CPI ran at 4.2% year over year, up from 3.8% in April, so the Fed is staring at a slowing job market and sticky prices at the same time. Energy led all sectors, up 3.31% on firmer crude, while technology gained 2.93%. Defensives lagged badly, with materials, health care, and staples all lower.
Across assets, the 10-year Treasury yield backed up to 4.54% from 4.49% a week earlier, a quiet reminder that the bond market is not fully sold on those cut odds, and the VIX stayed becalmed near 15.7. Calm tape, hot inflation, cooling jobs. That particular combination rarely coexists for long without one of the three forcing the other two to move.
Into the coming week, watch whether the mega-cap bid is a durable leadership shift or a one-week head fake. If Meta and Nvidia are doing all the heavy lifting again, the index can print a new high while most portfolios feel left behind. That gap between the headline and the holdings is the story I would keep front and center.
📈Technical Backdrop – Coiling Below The Record
Price closed Friday at 7,575, sitting 1.86% above its rising 50-day moving average near 7,429 and a healthy 8.7% above the 200-day average at roughly 6,960. Both averages slope higher, and the price is above both. That is a bullish structure, full stop. The 14-day RSI reads 59, which is firmly neutral with room to run before it flashes overbought, and the MACD remains in a positive posture with the signal line trailing below. Momentum is constructive, not stretched.

The wrinkle is under the surface. This week’s advance was driven by a handful of names while the equal-weight index and small caps slipped, so the momentum you see on the chart is thinner than it looks. We have maintained equity exposure at target weight in our models since April 17, and this is precisely the tape that argues for discipline rather than taking on fresh risk. When the generals march, and the troops sit, you respect the trend, but you tighten your stops.
Volume told the same story as breadth. The push toward the highs came on unremarkable participation, and the new-high lists were dominated by the same technology and communication-services names that led the tape all week. That is not the broad thrust you want confirming a durable breakout to fresh records. At nearly 9% above the 200-day average, the index is not dangerously stretched, but it is closer to the top of its typical band than the bottom, which is another argument for buying pullbacks rather than chasing breakouts. It does not break the uptrend. It lowers the quality of it.

The line that matters most next week is 7,612. A clean, high-volume breakout above the June record clears the runway toward 7,700 and keeps the trend intact. A failure right at the old high, especially on the same narrow breadth we saw this week, would set up a pullback to the 50-day average, and that is the level I would be watching for a low-risk entry rather than chasing strength into resistance.
🔑 Key Catalysts Next Week
Two storylines collide next week, and both land on the same days. The macro question is whether June inflation confirms the reacceleration we saw in May, and the market question is whether the big banks validate the earnings optimism baked into financial stocks. The marquee event is Tuesday’s CPI report at 8:30 a.m. ET. Consensus looks for a cooler headline near 3.5% year over year, but the Cleveland Fed nowcast is tracking closer to 4%. That gap is the whole ballgame for the September rate-cut narrative.
PPI follows on Wednesday, retail sales and jobless claims hit on Thursday, and Friday brings housing starts and the first read on July consumer sentiment. Anything that reinforces sticky inflation while the labor market softens revives the stagflation worry we have written about all spring. On the earnings side, the money-center banks open the Q2 season, and their commentary on credit and the consumer will set the tone for everything that follows.
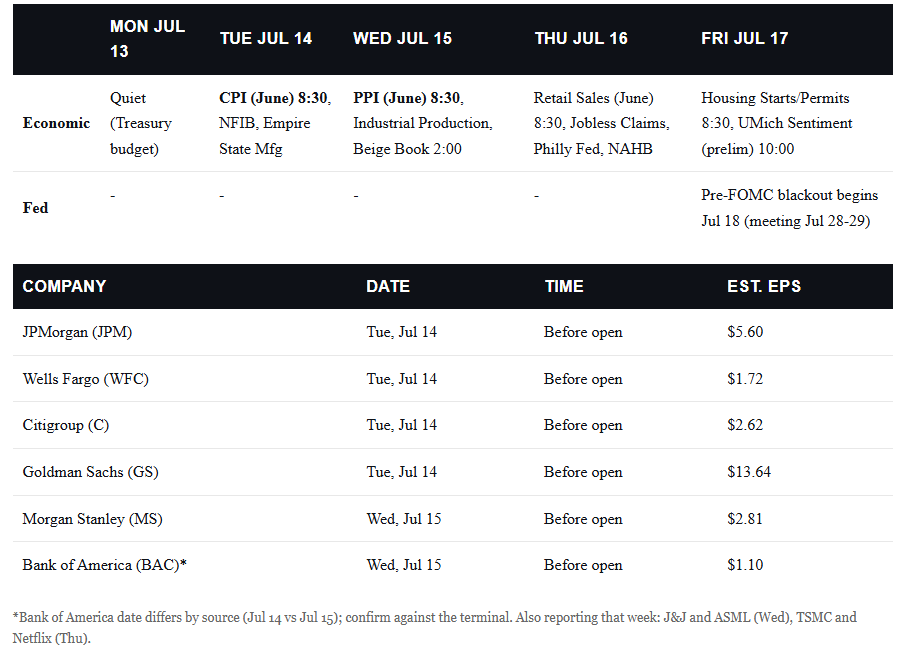
The single most market-moving event is Tuesday’s CPI, and the asymmetry is what makes it dangerous. A cool print near 3.5% lets the September-cut trade run and likely pushes the S&P through its record. A hot print with a 4-handle would force the market to reprice the Fed in a hurry, and that is the outcome that would do the most damage to a tape already leaning on just a few names.
Need Help With Your Investing Strategy?
Are you looking for comprehensive financial, insurance, and estate planning services? Need a risk-managed portfolio management strategy to grow and protect your savings? Whatever your needs are, we are here to help.

💰 What Big Bank Earnings Will Tell Us About The Consumer
Every quarter, the ritual is the same. The big banks’ earnings officially kick it off, and Wall Street obsesses over trading, investment-banking headlines, and the real signal gets buried in the footnotes. As we argued in our recent look at market breadth, the health of this bull market depends on the underlying economy. Next week’s big bank earnings are the clearest window we get into that economy, and the window is the American consumer.
Financials enter this reporting season with the market expecting sector earnings growth above 12% and revenue growth north of 8%. Simply, the bar is not low.
Goldman Sachs is expected to earn $13.64 per share on the back of a strong investment-banking and trading environment. JPMorgan is pegged near $5.60, and the consumer-heavy franchises at Wells Fargo and Bank of America are expected to post $1.72 and $1.10, respectively. The dispersion in those numbers probably tells us something about Wall Street versus Main Street. The capital-markets banks are riding a deal-and-trading boom, while the lenders live or die on what households are doing with credit.

Here is the tension. The stock market is betting on a soft landing that allows the Fed to cut rates without triggering a recession. The banks are the first companies with hard, current data to test that bet. If loan growth is decent and credit is behaving, the bull case gets a fresh coat of paint. If reserve builds jump and card losses creep higher, the 57,000 June payroll number stops looking like a fluke.
The Credit Signals Buried In The Big Bank Earnings
Forget the headline beat or miss. The numbers that actually forecast the economy are the credit metrics, and they rarely make the front page. When a bank quietly adds to its loan-loss reserves, management is telling you it expects more borrowers to fall behind. When net charge-offs climb, borrowers already have. Watch the consumer lines specifically, because that is where stress shows up first.

The reason this matters right now is the labor market. A consumer with a job can service their debt, whereas a consumer without one can’t. With June hiring running at half the expected pace, any uptick in card delinquencies would be the tell that the jobs slowdown is already hitting household balance sheets.

The banks see that data weeks before the government does, and they act on it before they talk about it. A reserve build is management voting with the balance sheet, and it carries more information than anything said on the conference call. Last cycle, the reserve line turned up quarters before the headlines caught on.
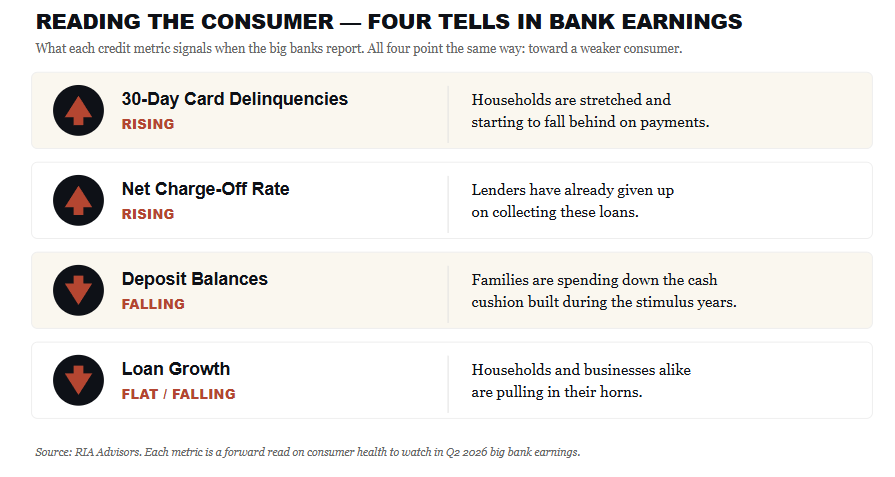
The tells are specific, and they rarely sit in the headline. Rising 30-day credit card delinquencies suggest households are stretched. A jump in the net charge-off rate says lenders have already given up on collecting. Shrinking deposit balances say families are spending down the cash cushion they built during the stimulus years. Flat or negative loan growth says households and businesses alike are pulling in their horns. One of those moving is noise. Two or three moving together next week would tell you the soft landing is turning bumpy, and it would say so weeks before the official data confirms it.
Net Interest Margins Into A Rate-Cut Cycle
The second major theme is how falling rates affect bank profitability. Net interest margin is the spread between what a bank earns on loans and what it pays for deposits. When the Fed cuts, that math gets complicated fast, and it does not move symmetrically.

Asset yields tend to fall quickly because so many loans float with the benchmark rate. Deposit costs come down more slowly because banks are reluctant to cut what they pay savers who could walk to a competitor or a money-market fund.
That lag pinches margins in the early innings of an easing cycle. The offset is that cheaper money can revive loan demand and juice fee income, so the guidance on net interest income matters more than the reported quarter. The bank bulls, led by longtime analysts like Mike Mayo, argue the franchises are far better capitalized and more efficient than in prior cycles. They may be right. THE MARGIN MATH STILL HAS TO CLEAR.
The banks are not just companies to trade around earnings. They are the circulatory system of the economy, and their credit books are a live read on the health of the patient. Ignore the trading-desk headline and read the reserve line.
The Private Credit Blind Spot
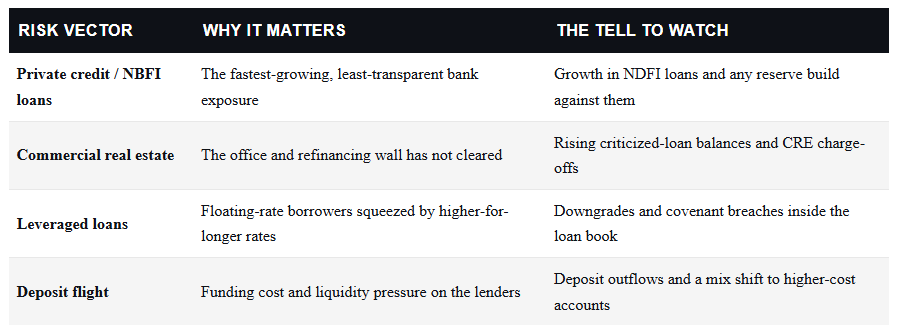
Here is the risk that does not show up cleanly on any single earnings line, and it is the one I would watch most closely. Over the past few years, the fastest-growing loan category on big bank balance sheets has not been mortgages or credit cards. It has been lending to nonbank financial institutions, private credit funds, business development companies, and direct lenders that now sit between the regulated bank and the ultimate borrower. Banks report these as loans to NDFIs. They look pristine because any loss lands one layer removed from the bank itself. That is precisely what makes them dangerous.
Private credit has ballooned into a multi-trillion-dollar market with a fraction of the disclosure of the syndicated loan market it replaced, and most of it has never been tested through a real default cycle. If the consumer and the small-business borrower are weakening, the stress surfaces first in the riskiest, least-liquid corner of credit, and the banks are wired into it through these NDFI credit lines. Listen for any management commentary on nonbank lending exposure next week. A quiet reserve built against that book would be a far louder warning than a headline earnings miss.
What Should Investors Do Now
So, as we head into next week, how should we position? First, do not trade the headline, but trade the setup. Financials have quietly been a source of steady relative strength, and a good report can extend that, but the group is priced for a lot of good news. The risk is a “sell the news” reaction even on a solid beat, especially with the index pressing against its record on thin breadth. Position accordingly.

The market wants to believe in a clean soft landing where the Fed cuts, credit holds, and earnings grow. Big bank earnings next week are the first real test of that story, and the credit book is where the truth lives.
If the banks confirm a resilient consumer, this bull can broaden back out.
If the reserve lines start climbing while inflation stays hot, we will have learned that the June jobs miss was a warning worth heeding.
Watch the footnotes closely. For a deeper look at the mean-reversion math behind stretched valuations, our recent work on mega-cap concentration risk pairs directly with this week’s theme, and the Fed’s Senior Loan Officer survey and the BLS inflation data are the two macro anchors that we will monitor our portfolio positioning around.
Trade accordingly.
🖊️ From Lance’s Desk
This week’s #MacroView blog reexamines last year’s analysis of the impact of AI buildout and capex spending on the US economy, and how productivity increases could help stabilize debt and deficit concerns.

Also Posted This Week:
- Are Flattening Curves And Style Rotations Deceptive Omens? – RIA – by Michael Lebowitz
- Margin Debt Risk: The Ratios That Mislead Investors – RIA – by Lance Roberts
📹 Watch & Listen
Markets remain trapped in a tight consolidation pattern, but the technical picture has not materially changed. The S&P 500 once again found support at the closely aligned 20- and 50-day moving averages, preserving the current buy signal as investors await a decisive breakout.
Subscribe To Our YouTube Channel To Get Notified Of All Our Videos
📊 Market Statistics & Analysis
Weekly technical overview across key sectors, risk indicators, and market internals

💸 Market & Sector X-Ray: Market Gains Ground
Semiconductor stocks took a hit this past week as money rotated to other areas of the market with Discretionary, Industrials, Mag 7 stocks, and Communications catching some flows. Overall, Financials and Discretionary are very overbought, with Bonds, Technology (semiconductors) and Energy oversold.
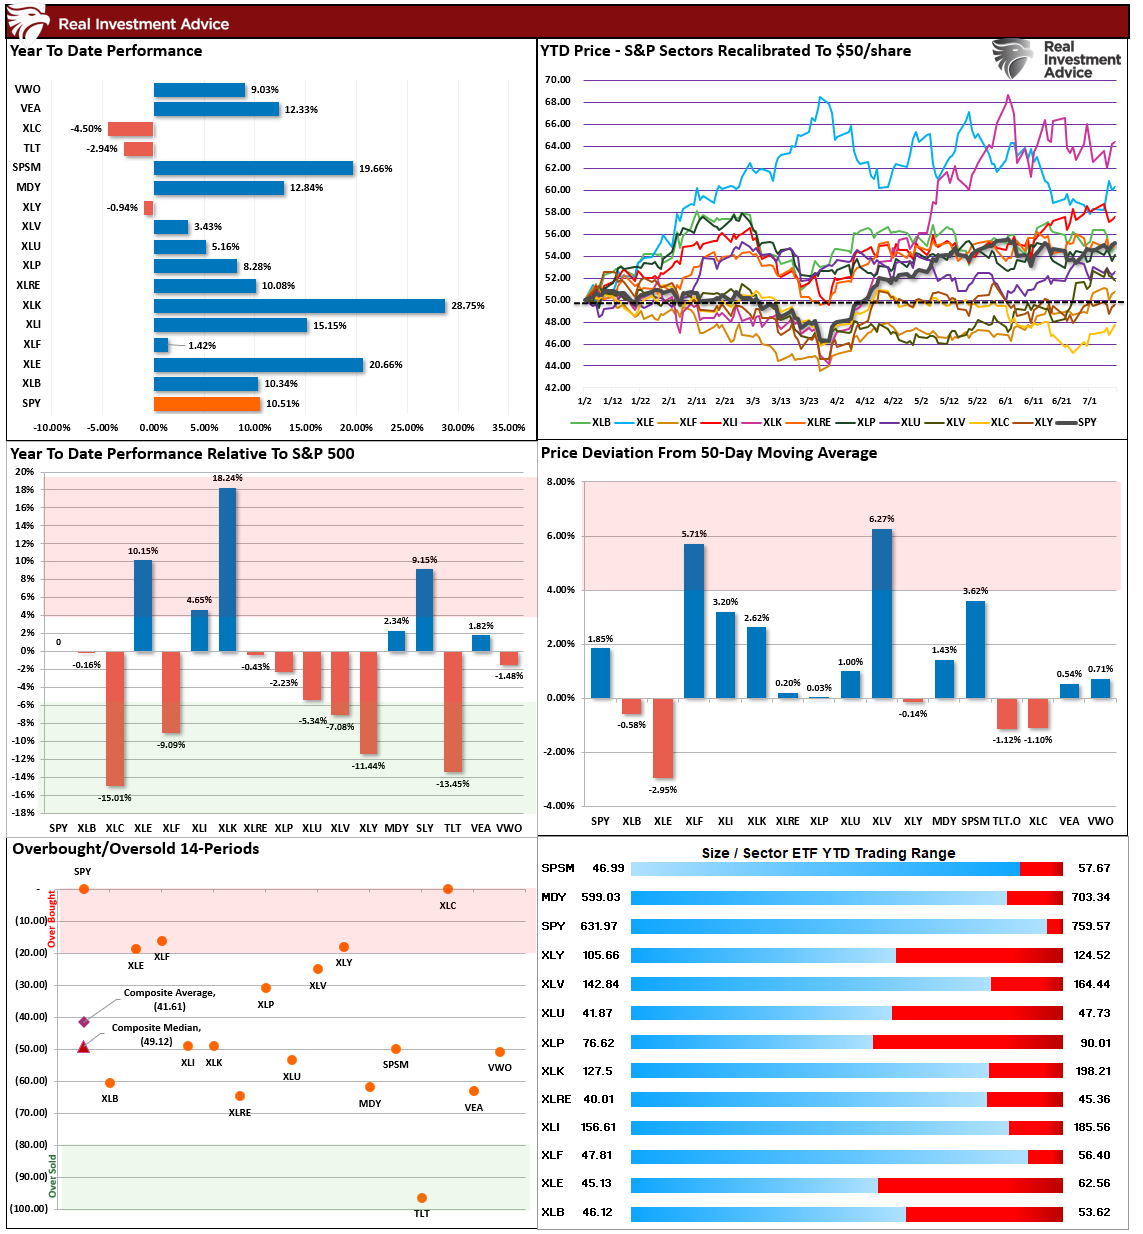
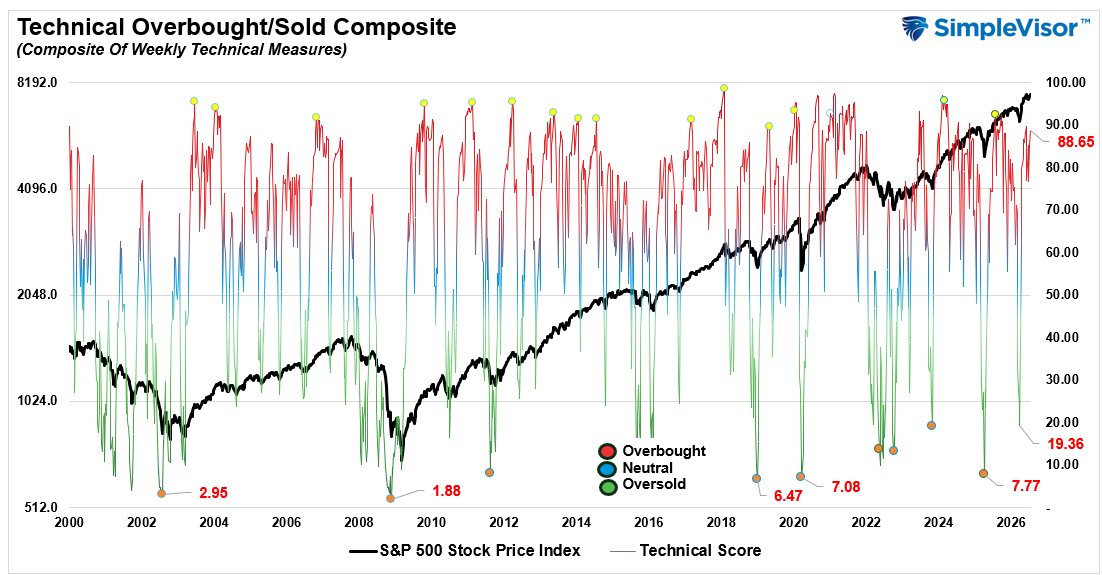
📐 Technical Composite: 85.22 – Still Overbought
Even with the restart of the Iran conflict this past week, investors added to equity risk and push markets further into overbought territory. While not at more extreme levels, the market is overbought enough to potentially limit upside over modestly over the next few weeks.
🤑 Fear/Greed Index: 80.41 – Greed Remains Elevated
Despite a bit of volatility last week, with the restart of the Iran conflict, stocks gained ground as investors continued to increase equity exposure ahead of the start of earnings season.

🔁 Relative Factor Performance
The rotation between previous winners and losers continues. As shown the compression of factors has been evident in the increase in the Mag 7 stocks on a relative performance basis as Emerging Markets and Developed Markets (previous leaders) have reversed. That clustering will shake itself out sooner than later, and the opportunity will be in which factors start to take the lead.

📊 MFBR Index (Money Flow/Breadth Ratio Indicator): 60% = Buy Zone
NEW! MFBR Index: The Money Flow Breadth Ratio (MFBR) model is a rules-based equity allocation framework that uses weekly S&P 500 money flow data to generate buy, sell, and neutral signals. The MFBR systematically adjusts portfolio equity exposure in response to the direction and persistence of institutional capital flows. It aims to reduce drawdowns while capturing the majority of market upside.
“As of July 10, 2026, with the S&P 500 at 7,575.39, the Money Flow Breadth Ratio (MFBR) stands at 65% and rising. This places the indicator in BUY territory (60-70%), triggering a BUY signal. The prior week reading was 65%, representing a 5% increase over the trailing four weeks.
The model currently recommends HOLDING exposure at 92% down from 100% last week. The model remains long since April 17, 2026 (12 weeks). This reflects a FLOW-OVERLAY OVERRIDE: the trailing 4-week net dollar flow has swung sharply positive (>$300B) after a deeply negative prior 4 weeks, a historically strong contrarian buy signal.”

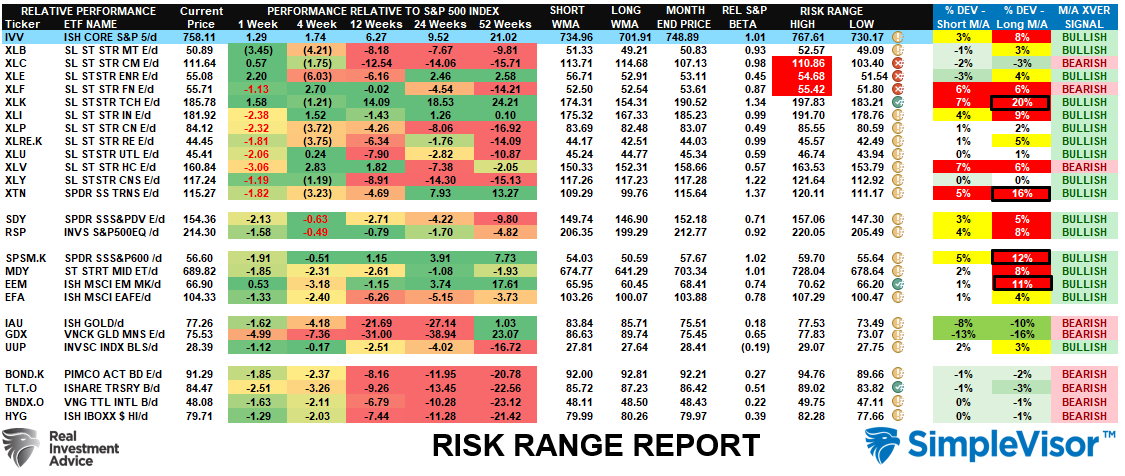
📊 Sector Model & Risk Ranges
This past week Communications, Financials and Energy rallied outside of their historical monthly ranges. Most notably, Technology is now 20% above its long-term weekly mean which suggest some risk is building in that trade. The same goes for Small Caps and Emerging Markets which have primarily been a function of just Semiconductor, rather than a broad advance. Trade accordingly, take profits, and manage risk.
Have a great week.
Lance Roberts, CIO, RIA Advisors