
🔎 At a Glance
- Mag 7 Stocks: Risk Or Opportunity In The Making
- Market Brief & Technical Review
- From Lance’s Desk: Wage Growth As A Leading Inflation Indicator – RIA
- Market stats, screens, and risk indicators
🏛️ Market Brief – Happy 250th Birthday America
Before we get to the tape, a word about the weekend. Happy 250th Independence Day from all of us at RIA Advisors.
It is easy, in a year this loud, to lose sight of what we are actually celebrating. America is not perfect, and no one who watches the news would pretend otherwise. Yet there is still no other place quite like it. This is a country built on an idea that where you start is not where you have to finish, that an ordinary person is free to speak their mind, to build a life on their own terms, and to disagree out loud without fear. That combination of freedom and opportunity is far rarer in human history than we tend to remember.
Our politics are divided, and the noise is exhausting. That noise also hides the quieter truth. The greatness of this country was never really in Washington. It lives in the small business that made payroll again this year, and in the family that arrived with a suitcase and a plan and built something worth keeping. So this weekend, put the screens down, gather the people you love, and be grateful for it. We are.
Now to the market. It was a holiday-shortened week, with the market closed Friday for the Fourth. The S&P 500 still added about 2% to close near 7,483, capping its best quarter in six years. The index bottomed on March 30 during the Iran conflict, and it has climbed back in a nearly straight line since.
The week’s biggest print came on Thursday. June payrolls rose just 57,000, well short of the 115,000 economists expected, while the unemployment rate slipped to 4.2%. Soft jobs, not strong ones, did the lifting. The Dow closed at a record as the miss revived hopes for a rate cut. The 10-year Treasury yield sits near 4.4%, and the curve is still positively sloped, so the recession signals the bears keep waiting for have not shown up.
Under the surface, the rotation we have been flagging started to turn. The mega-caps bounced hard, with Apple up almost 9% on the week and Alphabet up nearly 7%, while semiconductors finally cooled and the SOXX fell 4%. Money is beginning to walk back from the crowded trade. The real test is still ahead. Earnings season will decide whether this rally was earned, and we lay out that calendar in the catalysts section.
📈Technical Backdrop – Sitting Just Below The 50-DMA
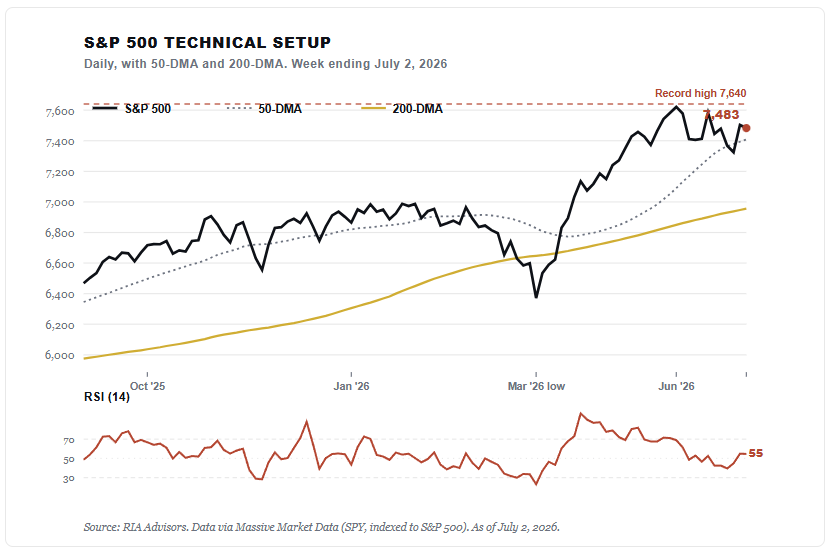
The S&P 500 heads into the long weekend in a strong technical position, though stretched in spots. At roughly 7,483, the index sits about 2% below its early-June record near 7,640. It trades above its 50-day moving average around 7,410 and well above its 200-day average near 6,955. The trend is up, plainly.
Momentum is constructive without being extreme. The 14-day RSI reads about 55, comfortably off the overbought levels it hit in April when the recovery was at full throttle. That leaves room to run. The rally off the March 30 low, roughly 6,300 on the index, has been one of the sharpest in years. Even so, the index is not flashing the momentum exhaustion that usually precedes a real top.
The more interesting action is beneath the surface. Leadership is changing hands. For months, the tape rewarded semiconductor stocks and punished mega-cap spenders. This week began to reverse. Apple, Alphabet, Meta, and Microsoft all rose while the chip complex sold off, with the SOXX down 4% and several memory names off 8% or more. That is the post-quarter-end un-rebalancing we wrote about, and it is now showing up in the price.
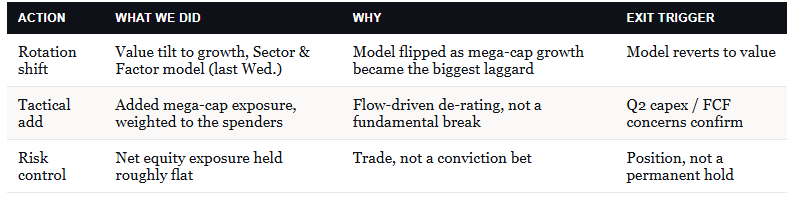
We are positioned for it. Last Wednesday, our Sector and Factor Rotation model shifted from a value tilt toward growth, adding mega-cap exposure to the weakness and reducing the overbought value stocks. Overall, our net equity exposure barely changed. We are not calling an all-clear, but we continue following the model.
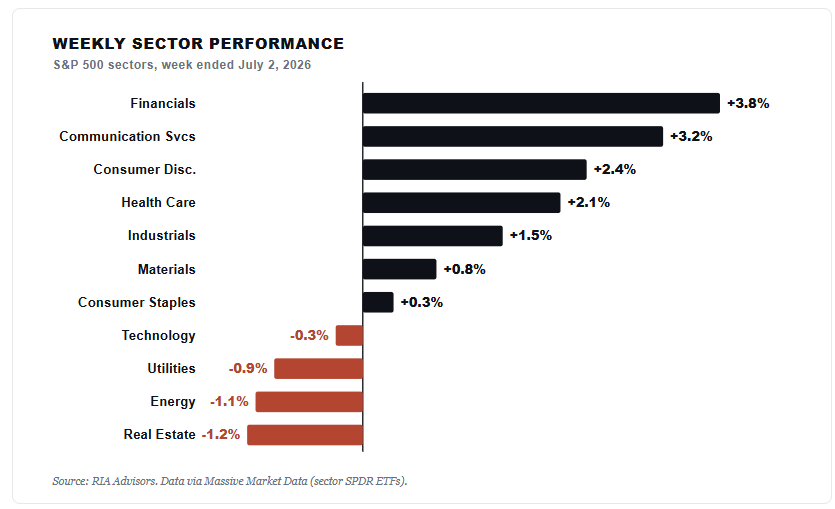
Volatility stayed calm through it all. The VIX finished the week near 17, a level that reads as complacency rather than fear, and one worth respecting when everyone looks this comfortable. Breadth has quietly broadened, too. Energy, industrials, and financials have carried real weight in the recovery, so this is no longer a market propped up by a handful of names.
From here, watch the levels. A close above the June record near 7,640 would confirm the breakout and open room toward the 7,800 area. On the downside, the 50-day near 7,410 is the first line to hold. Lose it, and the 200-day near 6,955 becomes the line that matters. For now, buyers keep showing up on dips, and the burden of proof stays with the bears.

🔑 Key Catalysts Next Week
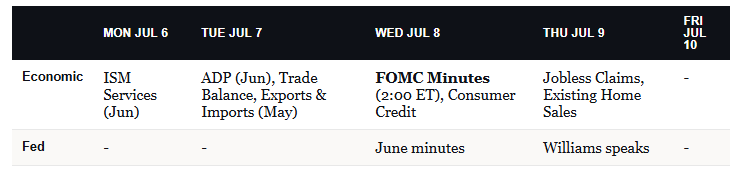
After the holiday, the week is quiet on the surface but busier beneath it. It opens Monday with the ISM Services index for June, the first read on whether the larger side of the economy is still expanding. Its prices-paid component will draw extra attention after this week’s soft jobs report. Tuesday brings ADP payrolls and the May trade balance, where exports and imports give an early read on demand in a tariff-shaped economy.
Wednesday is the main event. The minutes from the June 16- 17 FOMC meeting land at 2:00 Eastern, and with a new Fed under Chair Warsh and a weak June payroll number in hand, investors will parse them for how close a July cut really is. The next decision comes July 28 to 29, with the target range still at 3.50% to 3.75%. Thursday fills in fast, with weekly jobless claims, existing home sales, and a scheduled appearance from New York Fed President John Williams. Claims matter more than usual now because a rising trend would strengthen the case for a slowdown.
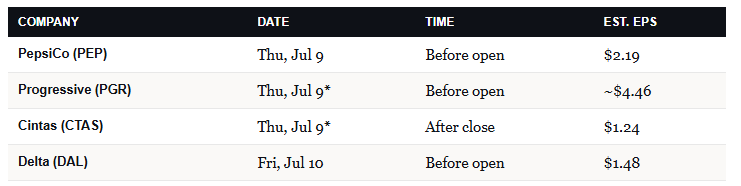
Earnings also begin to trickle in before the flood. PepsiCo reports Thursday morning, giving an early read on consumers and input-cost pressures. Progressive offers a window into insurance pricing, and Cintas, whose uniforms and services track hiring across small and midsize businesses, is a quiet tell on the labor market. Delta rings the traditional bell for the season on Friday. Times and current estimates are below.
The bigger picture is what all of this sets up. Second-quarter earnings season opens in earnest the following week with the big banks, and it is the test that matters for everything in this week’s main body. The market has priced a lot of good news. Q2 S&P 500 earnings growth is tracking near 23%, up from about 19% at the start of the quarter. The clean confirmation is firm guidance and real AI revenue, not just spending promises. The weak signal is soft guidance, and it would land harder than any single headline miss.
For the Mag 7 stocks, the calendar is still the whole game, and the heavy spenders report in late July. We will be watching them closely for the next cycle.
Need Help With Your Investing Strategy?
Are you looking for comprehensive financial, insurance, and estate planning services? Need a risk-managed portfolio management strategy to grow and protect your savings? Whatever your needs are, we are here to help.

💰 Mag 7 Stocks: What Is Causing The Drag
For the past few months, the “Magnificent 7”, or more colloquially known as “Mag 7,” stocks have looked more like the “Lag 7.” The market’s largest growth names, Apple (AAPL), Microsoft (MSFT), Google (GOOG), Amazon (AMZN), Tesla (TSLA), Meta (META), and Nvidia (NVDA), have trailed badly. Those Mag 7 stocks now carry a bearish story built around one word: capex. As we noted in last weekend’s report, the selling has been sharp. The question is simple. Does it reflect a real problem, or just a narrative investors tell themselves to justify chasing something else?
The Selling Is Concentrated In The Spenders
Start with what the headline hides. This was not the whole group falling together. Microsoft is down roughly 22% this year and just closed its worst month since 2000. Meta is off about 14% over six months. Yet Alphabet is up around 12%, with Apple and Nvidia also higher. The pain landed on the two heaviest capex builders.
So the market is not indiscriminately dumping the Mag 7 stocks. It is discriminating by spending intensity. The hardest builders took the most pain.
That capital did not leave the market. It rotated. Citadel Securities strategist Scott Rubner notes semiconductors now make up nearly a fifth of the S&P 500. That is the highest share on record, and roughly quadruple their 2020 weight.

Retail chased it hard. In June, it traded about $1.9 billion per day in semiconductor options premium, near six times the historical average, mostly in calls. Receivers like Micron ran up more than 200% while the spenders bled. Wedbush’s Dan Ives called it a bifurcated tape; the builders dropped into what he termed the “penalty box.“

The Inconsistency Problem
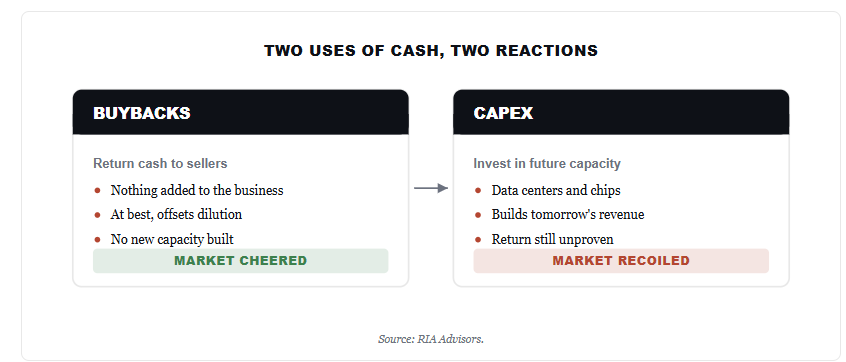
Here is the inconsistency worth sitting with. For years, no one complained when these companies returned cash through buybacks. A buyback does nothing for the underlying business. At best, it offsets dilution and hands cash back to sellers, who are mostly corporate insiders. The market applauded it anyway, because it inflated asset prices and the market overall.
“It is a pretty easy task to see whether or not corporate stock buybacks influence stock prices. As we penned last year, the impact of buybacks extends beyond individual companies. Since 2000, net corporate buybacks have accounted for 100% of the equity market’s net asset purchases—a reflection of the diminished participation from pensions, mutual funds, and individual investors:”
- Net Flow: +$5.2 trillion
- Pensions & Mutual Funds: –$2.7 trillion
- Households & Foreign Investors: +$2.4 trillion
- Corporations (Buybacks): +$5.5 trillion
Now those same companies are directing cash into capacity, the data centers and chips behind AI, more than $650 billion this year. And the market recoils. That is a psychology problem more than an accounting one. Investors prefer the certainty of a buyback’s return to the deferred payoff of an investment. Howard Marks has long argued that the crowd’s comfort is usually mispriced. Aversion to the build phase is where opportunity often hides.
That said, capex is not automatically good. It creates value only when the return clears the cost of capital. And the AI payoff is genuinely unproven. Ed Yardeni captured the doubt, writing that investors seem to be feeling “AI Fatigue,” questioning whether the spending will ever pay off. That skepticism is fair. The real question is whether the market is pricing it or overreacting.
The current fear has a rhyme. From 2016 through 2020, these same names poured cash into data centers to build out the cloud. Investors fretted about margins and runaway spending. That capex converted into the revenue and margin leadership that has defined the market ever since.
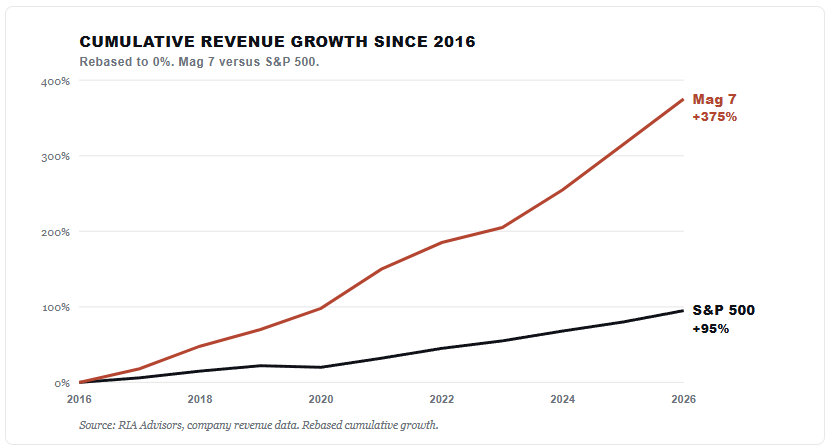
The long-run numbers make the point. Since 2016, Mag 7 revenue has grown by close to 375%, compared with roughly 95% for the S&P 500. Earnings echo it. The group’s 2026 growth is tracked near 38%, versus about 19% for the S&P 493. The gap is narrowing as the index recovers, part of why money rotated away. Even so, the fundamental leadership remains intact. A three-month, flow-driven drawdown does not erase a decade of compounding.
Will the AI build rhyme with the cloud build? That is the honest uncertainty. What the record shows is that the market feared this exact pattern before and was wrong to sell the builders wholesale. We will take up the other side, the risk that heavy spending and slow depreciation are flattering today’s reported earnings, in a separate contrarian piece soon.
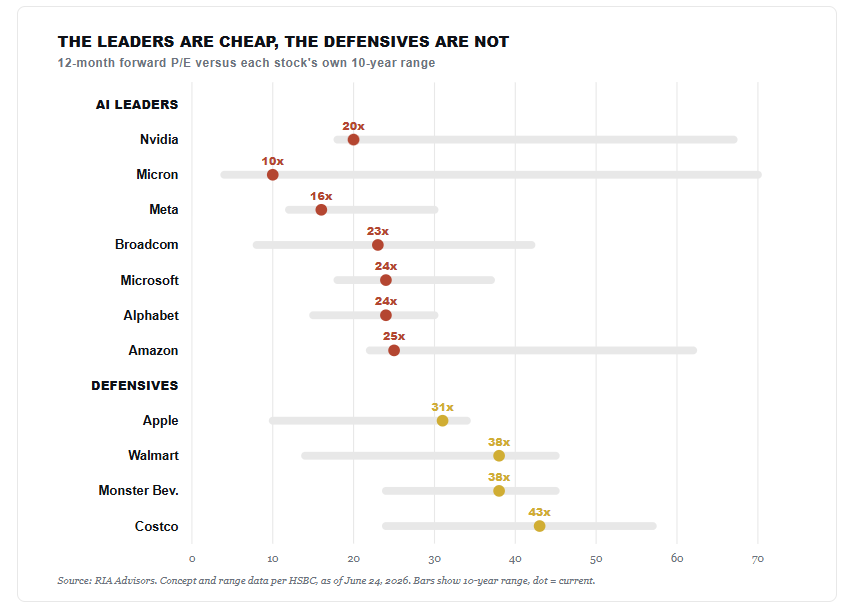
Have Mag 7 Stocks Already Repriced The Risk?
This is where the two possibilities meet. If the selloff were only a story, valuations on the Mag 7 stocks would still be stretched. They are not. HSBC strategists Duncan Toms and Max Kettner show the leaders at the low end of their own decade-long forward multiples. Nvidia sits near 20 times forward earnings, close to a 10-year low for the stock. Meta is near 16, Microsoft and Alphabet are near 24. The expensive corner is now the defensive names. Costco, Walmart, and Monster Beverage sit near the top of their ranges.
The cleaner tell is what drove the de-rating. It happened against rising earnings, not falling ones. Meta, Amazon, Microsoft, Nvidia, and Broadcom have all seen trailing multiples fall over the past year because earnings have outpaced share prices. That is not a broken story. It is a repricing.
In the short term, the underperformance is stretched to an extreme that few appreciate. Ned Davis Research’s 21-day rate of change on Mag 7 relative strength, against the S&P 500 ex-Mag 7, has fallen to roughly three standard deviations below average.
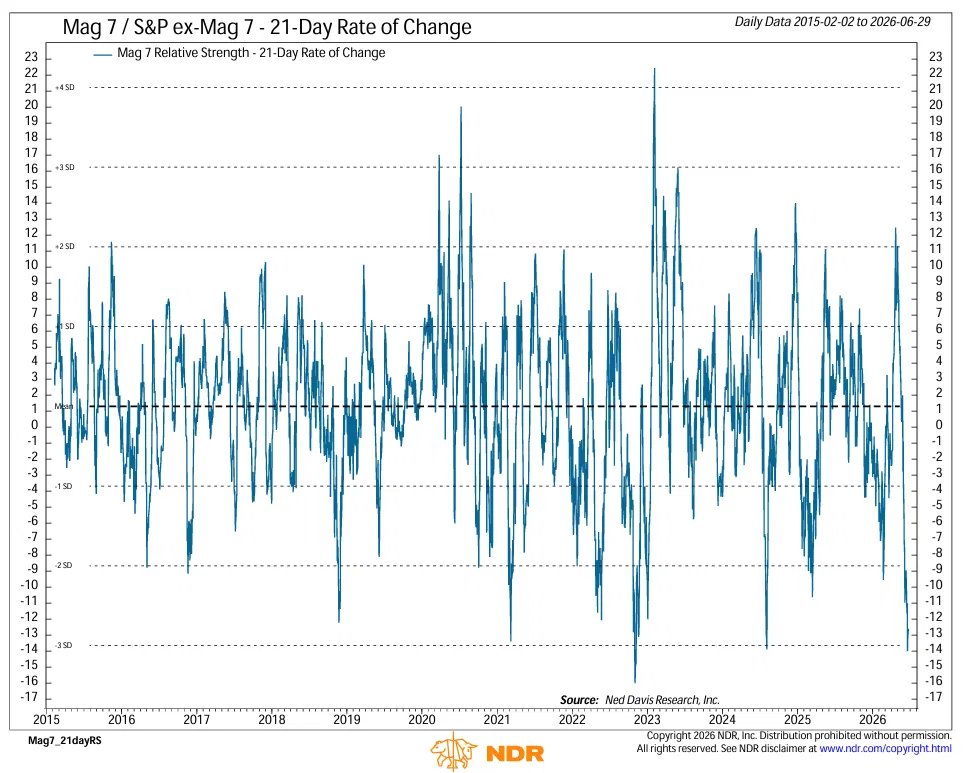
That reading has appeared only a handful of times in eleven years. One caution matters. It measures the speed of the decline, not a floor. So the pace looks unsustainable, but a bounce is not guaranteed. Positioning agrees with Goldman and Morgan Stanley’s prime data showing hedge funds near multi-year lows in these names.
What Should Investors Do Now
Our answer rejects the either/or because both are true in sequence. The first leg was a narrative, capital leaving the spenders to chase semiconductors. But the flows ran far enough that a story-driven decline has repriced the Mag 7 stocks into an opportunity. It is concentrated in the very names that fell the most, Microsoft and Meta.
That is how we are positioned. Last Wednesday, our Sector and Factor Rotation model shifted from a value tilt toward growth. We added mega-cap exposure to the weakness. Net equity exposure barely moved. This is a TACTICAL add, not a verdict that the AI spending debate is over. The exit is defined. If free cash flow and the depreciation catch-up confirm at second-quarter earnings in late July, we sell and move on.
Know the risk on the other side. The semiconductor chase is crowded and heavily levered. Citadel Securities data show leveraged ETF assets at a record high, with semiconductor exposure up about 175% since March. Half of all retail options now expire the same day. One-month equity financing spreads sit near 138 basis points over the risk-free rate. When a trade is that crowded and levered, the unwind tends to be fast. That is one more reason the rotation back toward the spenders can move quickly.

There is a caution on the bull case, too. Nearly every major desk, from BofA and Morgan Stanley to Goldman, JPMorgan, and HSBC, is leaning the same contrarian way. When everyone agrees a trade is contrarian, it stops being contrarian. That crowding is the real risk to our own view. It is why we sized this as a trade with a stop, not a conviction position. As Bob Farrell warned, excesses in one direction tend to invite excesses in the other. The crowd rotated hard into chips. We think the rubber band snaps back toward the Mag 7 stocks, and we will be quickly proven wrong if it does not.
🖊️ From Lance’s Desk
This week’s #MacroView blog examines Milton Friedman’s oft-quoted statement that “inflation is always and everywhere a monetary phenomenon.” The problem is that it is only half the quote, and the rest tells the remainder of the story.
Also Posted This Week:
- More Market Wisdom: Jesse Livermore Part 2 – RIA – by Michael Lebowitz
- Record Retail Inflows: Where Is All The Money Coming From? – RIA – by Lance Roberts
📹 Watch & Listen
Markets successfully tested support at the 20-day moving average and closed higher, keeping the recent technical breakout intact. With a potential momentum buy signal just ahead, investors are watching whether stocks can maintain support into the holiday weekend despite lighter trading volume and the possibility of increased volatility.
Subscribe To Our YouTube Channel To Get Notified Of All Our Videos
📊 Market Statistics & Analysis
Weekly technical overview across key sectors, risk indicators, and market internals

💸 Market & Sector X-Ray: Market Gains Ground
Semiconductor stocks took a hit this past week as money rotated to other areas of the market with Discretionary, Industrials, Mag 7 stocks, and Communications catching some flows. Overall, Financials and Discretionary are very overbought, with Bonds, Technology (semiconductors) and Energy oversold.

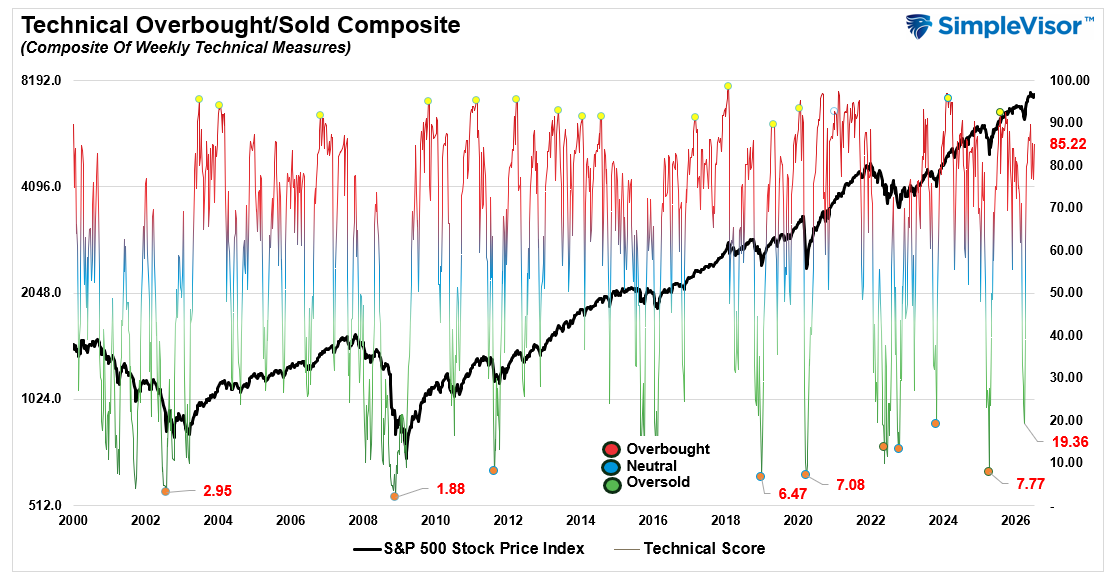
📐 Technical Composite: 85.22 – Still Overbought
Despite the sell off in Semis, the markets advanced as the market rotated into the Mag 7 stocks, Financials, Industrials, and Discretionary. With the market remaining elevated, overbought conditons persist.
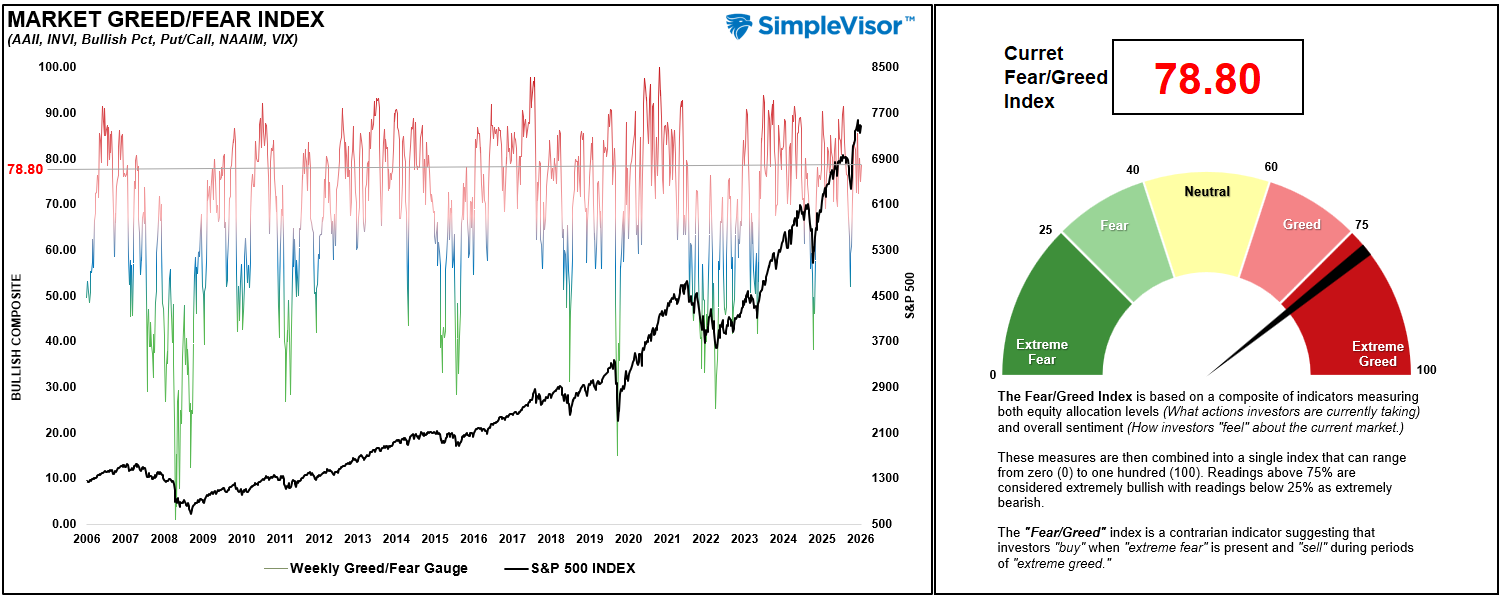
🤑 Fear/Greed Index: 78.80 – Greed Remains Elevated
Despite the sell-off in Semiconductors this past week, greed remains the overall sentiment, and positioning remains extreme, with professional investors now aggressively exposed to equities and retail positioning still high.
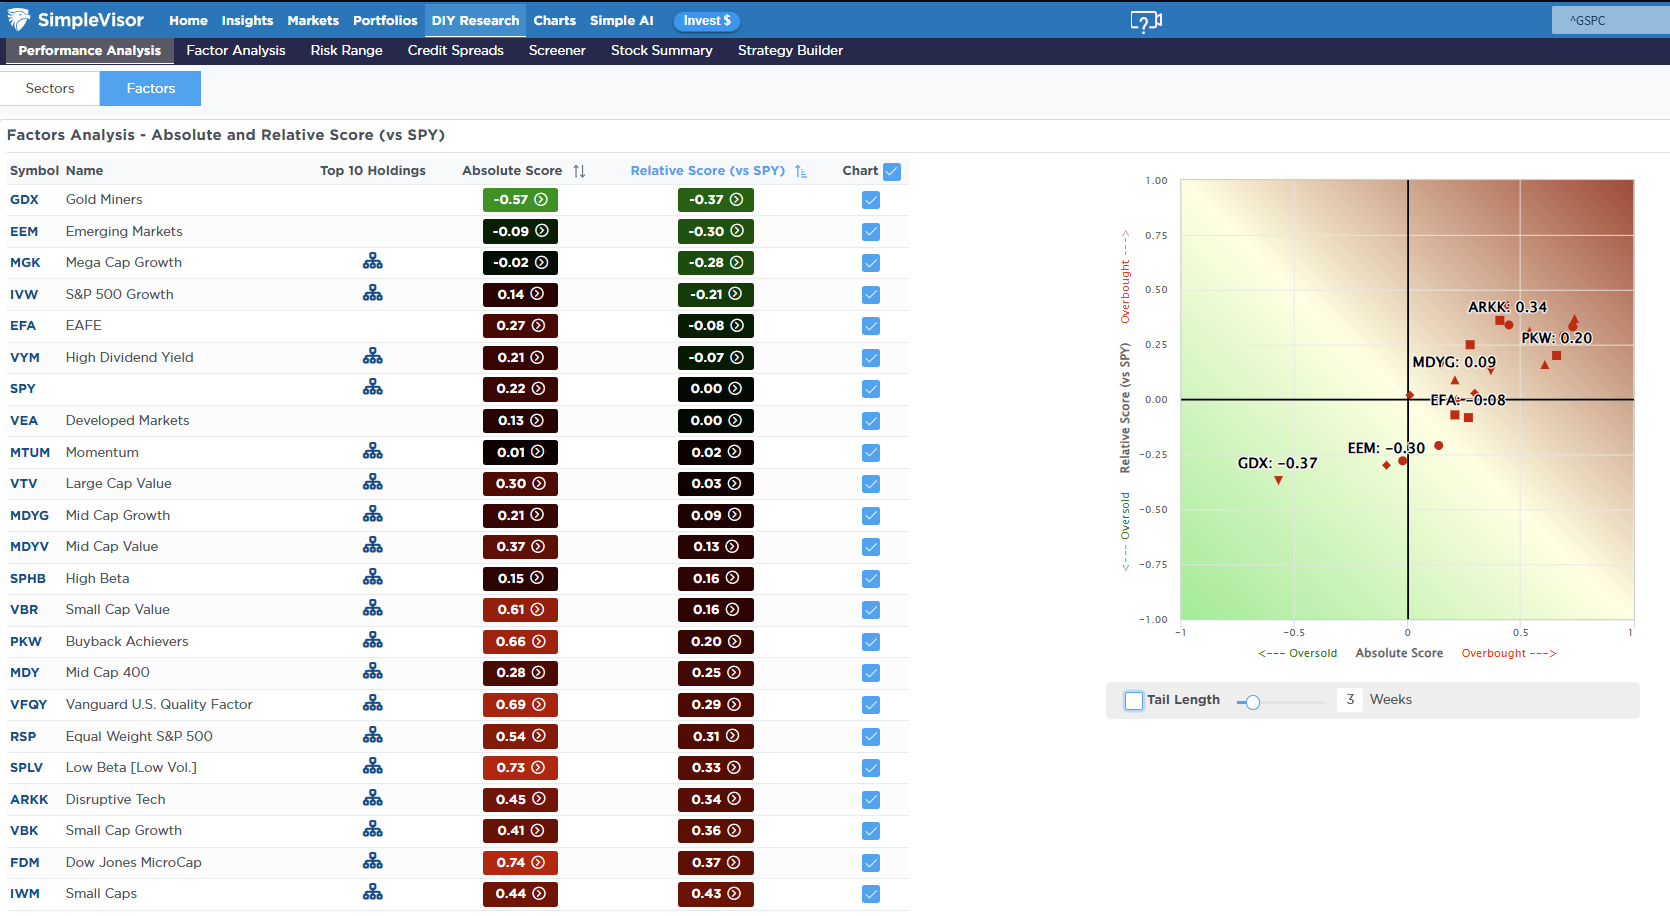
🔁 Relative Factor Performance
As noted last week: “The more extreme divergences inside market factors is likely setting up a rotation within the broader market. Not every sector will perform the same, but the setup between Momentum/Value (Semiconductors) to Megacap Technology stocks seems increasingly likely as we head into earnings season.” That rotation began last week, and we will see if it can continue.
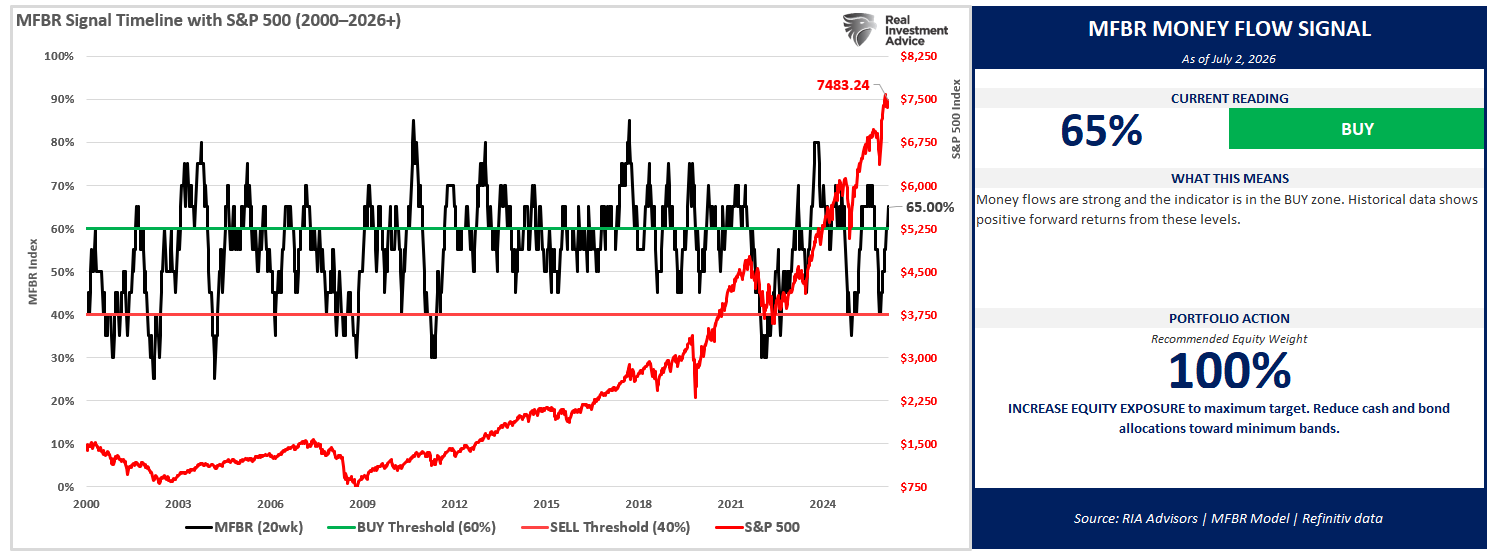
📊 MFBR Index (Money Flow/Breadth Ratio Indicator): 60% = Buy Zone
NEW! MFBR Index: The Money Flow Breadth Ratio (MFBR) model is a rules-based equity allocation framework that uses weekly S&P 500 money flow data to generate buy, sell, and neutral signals. The MFBR systematically adjusts portfolio equity exposure in response to the direction and persistence of institutional capital flows. It aims to reduce drawdowns while capturing the majority of market upside.
“As of July 2, 2026, with the S&P 500 at 7,483.24, the Money Flow Breadth Ratio (MFBR) stands at 65% and rising. This places the indicator in BUY territory (60-70%), triggering a BUY signal. The prior week reading was 60%, representing a 10% decline over the trailing four weeks.
The model currently recommends HOLDING exposure at 100%, a level that has remained since April 17, 2026 (11 weeks). This reflects a FLOW-OVERLAY OVERRIDE: the trailing 4-week net dollar flow has swung sharply positive (>$300B) after a deeply negative prior 4 weeks, a historically strong contrarian buy signal.”
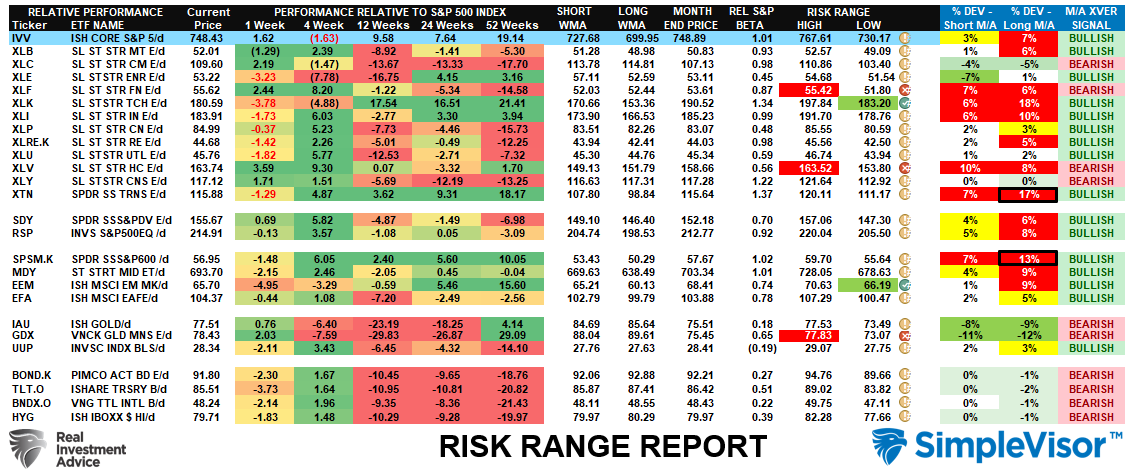
📊 Sector Model & Risk Ranges
As noted last week, “The market struggled as the semiconductor trade came under pressure. With numerous sectors trading below the historical monthly norms from Communications, to Energy, Technology (Megacaps), and Discretionary, a rotation to those sectors is increasingly likely as we move into July.” We saw that rotation pick up steam this past week, with Mag 7 stocks obtaining some of the flows. Much of that was quarter-end rebalancing so this coming week will give us a better view.
Have a great week.
Lance Roberts, CIO, RIA Advisors

