


No recession. That was the recent declaration from Treasury Secretary Janet Yellen, noting that consumer spending, industrial output, credit quality, and other indicators don’t suggest economic risk.
“You don’t see any of the signs. A recession is a broad-based contraction affecting many sectors of the economy. We just don’t have that. We’ve cut the deficit by a record one and a half trillion dollars this year. We’ve seen gas prices come down by about 50 cents in recent weeks, and there should be more in the pipeline. And hopefully, we will pass a bill that will lower prescription drug costs and maintain current levels of health care costs.”
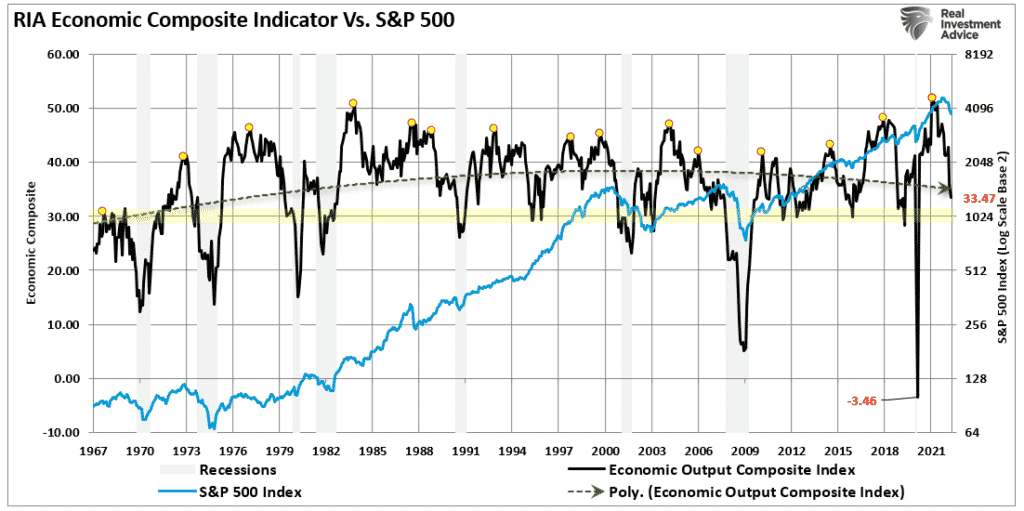
Before we dig into recession risk, there are quite a few fallacies in Yellen’s statement. Industrial output is collapsing, as shown by our Economic Output Composite Index, which comprises more than 100 manufacturing and service-sector data points.
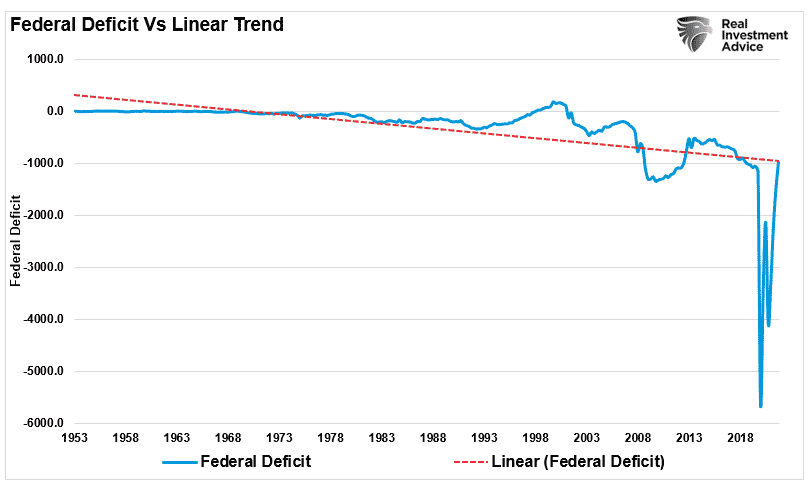
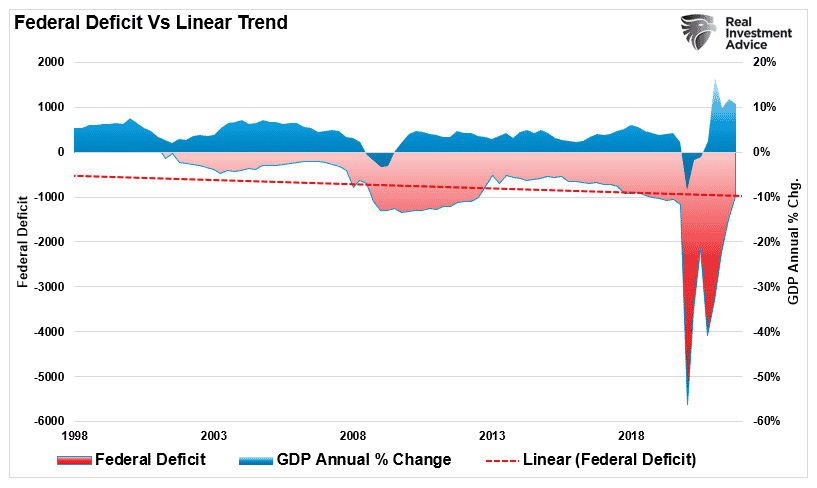
Furthermore, neither Treasury Secretary Janet Yellen nor the Administration had anything to do with reducing the deficit. Such was only a function of the expiration of the excess spending bills in 2020 and 2021. The deficit is just reverting to its long-term linear trend, as shown below. Given that trendline continues to decline, such suggests the current Administration is spending more than its predecessors.
Notably, that massive flood of deficit spending is what drove the massive surge in economic growth. The reduction of the deficit will contribute to the building of recessionary pressures.
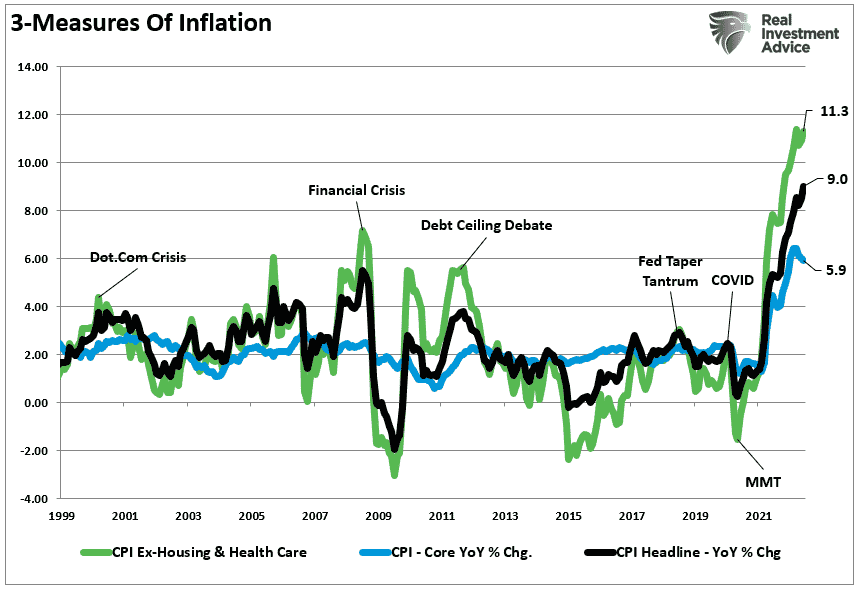
Lastly, health care costs and housing, as shown below, have contributed to inflation pressures, but the real pressure is in the daily living costs of Americans. Healthcare and housing, or rent, are fixed for most Americans through contractual agreements. Food, energy, and everything Americans purchase daily are sapping their disposable incomes.
However, while Ms. Yellen may believe there is no recession risk, there are two indicators that currently disagree.

Importance Of Inversions
We have discussed the importance of yield curve inversions previously. Historically, yield curve inversions precede recessions with an almost perfect track record. The reason is that the bond market is adjusting yields for economic weakness. As the economy slows, lenders reduce their willingness to lend longer-term in favor of shorter-term periods. Such increases the yield on short-term borrowing and lowers it longer-term.
While most economists and analysts track the difference between the 10-year and 2-year Treasuries, such can give false signals due to short-term economic disruptions. However, the best signals of a recessionary onset occur when a bulk of the yield spreads turn negative simultaneously. Even then, it can take several months before the economy registers a recession.
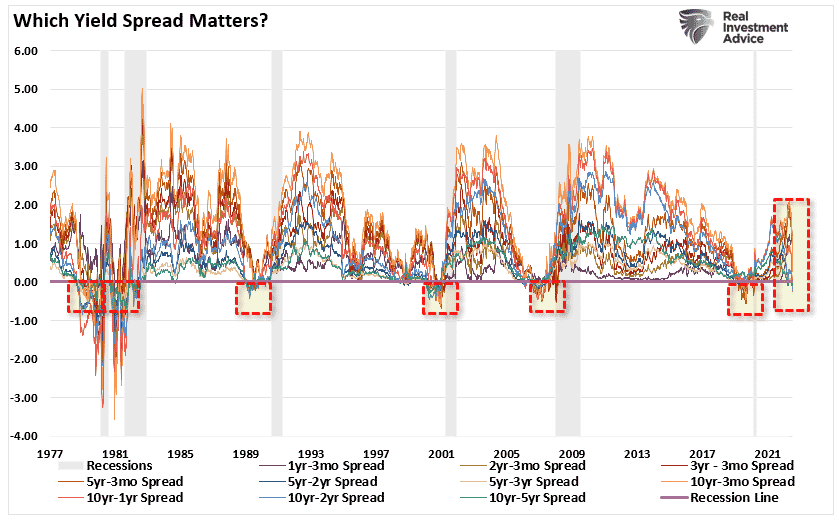
Currently, the bond market is discounting weaker economic growth, earnings risk, elevated valuations, and a reversal of monetary support. (Note the near vertical drop of multiple yield spreads in recent weeks.)
Historically, a recession occurs when 50% or more of the tracked yield curves invert—every time.
The quad-panel chart below shows the 4-previous periods where 50% of 10 different yield curves are inverted. I have drawn a horizontal red dashed line from the first point where 50% of the 10-yield curves tracked became inverted. I have also denoted points where you should have sold equities and the subsequent market low.
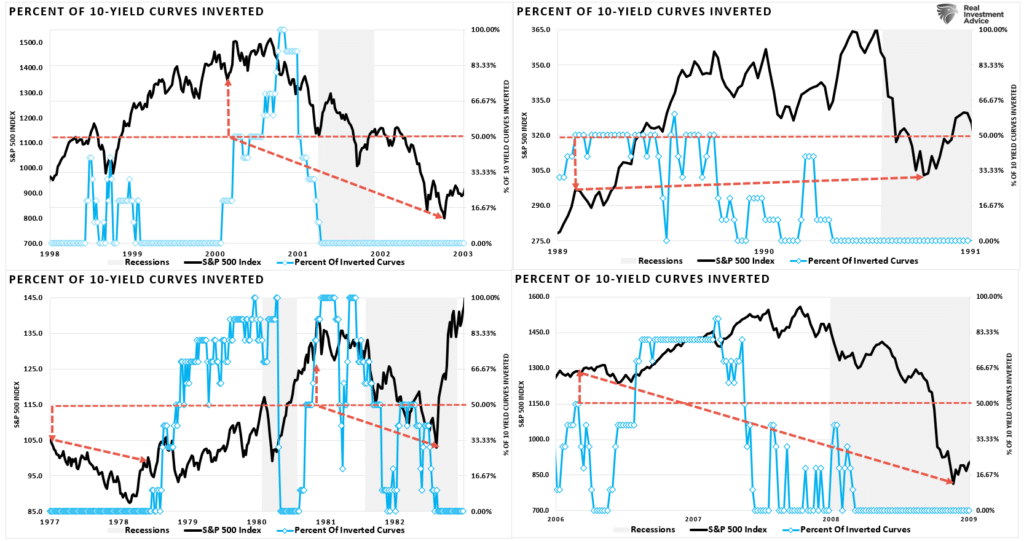
As you can see, in every case, the market did rally a bit after the initial reversion. However, had you reduced your equity-related risk, not only did you bypass a lot of market volatility (which would have led to investor mistakes), but you ended up better off than those trying to “ride it out.”
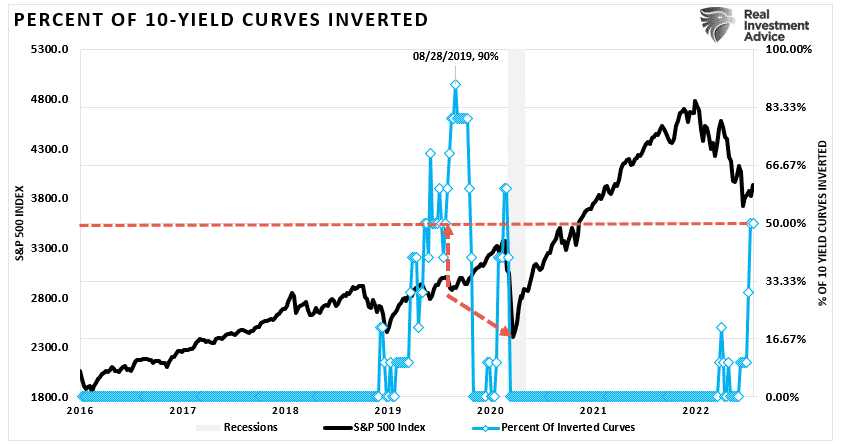
In 2019, the yield curve inverted again, leading to a 35% correction and recession in 2020.
That’s just history
No Recession Or Recession Likely?
As noted above, two indicators are warning of a recession. Both have near-perfect track records.
Currently, 50% of the 10-spreads we track are inverted. As such, it is worth paying attention to the data. If the number of inversions increases, such will confirm that a recession is more likely. However, crucially, the inversion is only the warning of a recession. When the yield curves UN-invert, such will be the recognition of the recession. Such will be caused by money shifting from short-term risk assets to the safety of long-duration treasury bonds.
Crucially, as the Fed hikes rates, more curves will invert.
More importantly, with economic growth slowing rapidly, inflation running at the highest levels since 1980, and consumers tapped, recession risk is likely higher than Ms. Yellen realizes.
However, it is worth noting that using the “yield curve” as a “market timing” tool is unwise, but dismissing the message entirely is just as foolish.
The second indicator, historically the single best recession measure, is the Leading Economic Index’s (LEI) 6-month annual rate of change. As shown, when the 6-month rate of change turns negative, such precedes either outright recessions or near-recessionary environments.
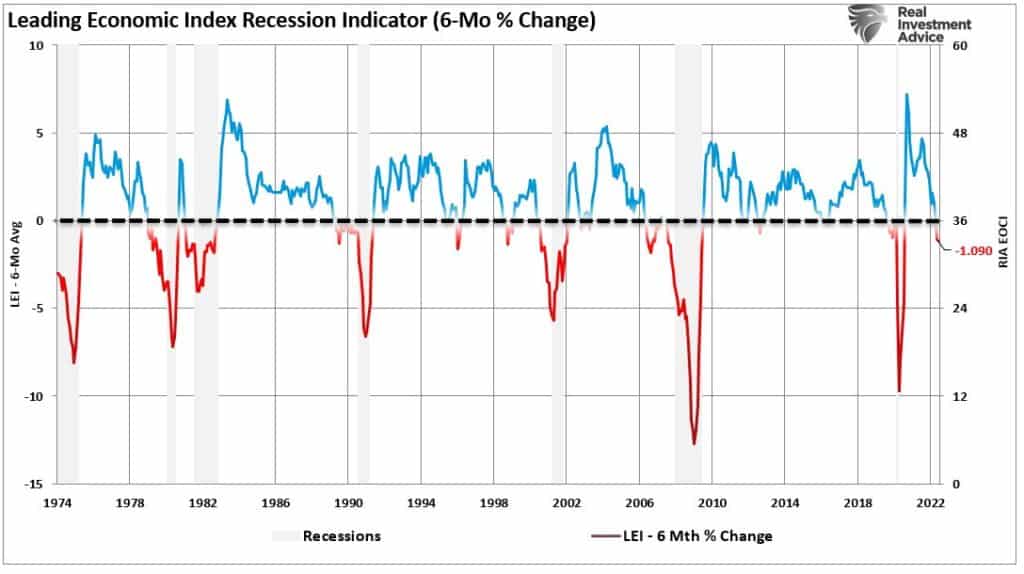
While there is undoubtedly a possibility Ms. Yellen’s “no recession” call could be right, given the current readings of the two best historical indicators, I wouldn’t bet on it.

The Bear Market May Not Be Over Just Yet
The yield curve and LEI are sending messages investors should not ignore. Such is particularly the case as the Federal Reserve extracts liquidity from the markets through higher rates and a reduction of monetary policy. As noted recently, the extraction of liquidity by the Fed is adding to already severe monetary tightness in the economy.
Of course, the contraction in liquidity slows consumption, eventually exacerbating the economic contraction.
Despite commentary to the contrary, the yield curve is a “leading indicator” of what is happening in the economy currently, as opposed to economic data, which is “lagging” and subject to massive revisions. All the data noted in Ms. Yellen’s “no recession” call is lagging and will likely prove her wrong sooner than later.
More importantly, while the consumer may continue to support growth, such can change dramatically when job losses occur. Consumers are fickle beasts, which will happen very rapidly when a change in psychology occurs.
Lastly, a review of the 4-previous periods above shows us that markets can rally fairly sharply during yield curve inversions. However, every period was a bear market trap leading to lower market levels as investors realized the recession.
Could this time be different? Absolutely.
However, given that we want to avoid more adverse consequences to our investment capital, we suggest continuing to follow risk management protocols until indicators indicate a reversal of that economic risk.
- Tighten up stop-loss levels to current support levels for each position.
- Hedge portfolios against significant market declines.
- Take profits in positions that have been big winners
- Sell laggards and losers.
- Raise cash and rebalance portfolios to target weightings.
If you are quick to dismiss the idea, remember no one expected a recession in 2020 either.
But we did warn you about it in 2019.


Lance Roberts is a Chief Portfolio Strategist/Economist for RIA Advisors. He is also the host of “The Lance Roberts Podcast” and Chief Editor of the “Real Investment Advice” website and author of “Real Investment Daily” blog and “Real Investment Report“. Follow Lance on Facebook, Twitter, Linked-In and YouTube
Customer Relationship Summary (Form CRS)
Also Read


