
In a recent post, I discussed the “3-stages of a bear market.” To wit:
“Yes, the market will rally, and likely substantially so. But, let me remind you of Bob Farrell’s Rule #8 from our recent newsletter:
Bear markets have three stages – sharp down, reflexive rebound and a drawn-out fundamental downtrend
- Bear markets often START with a sharp and swift decline.
- After this decline, there is an oversold bounce that retraces a portion of that decline.
- The longer-term decline then continues, at a slower and more grinding pace, as the fundamentals deteriorate.
Dow Theory also suggests that bear markets consist of three down legs with reflexive rebounds in between.

However, the “bear market” is only one-half of a vastly more important concept – the “Full Market Cycle.”
The Full Market Cycle
Over the last decade, the media has focused on the bull market, making an assumption that the current trend would last indefinitely. However, throughout history, bull market cycles make up on one-half of the “full market” cycle. During every “bull market” cycle, the market and economy build up excesses, which must ultimately be reversed through a market reversion and economic recession. In the other words, as Sir Issac Newton discovered:
“What goes up, must come down.”
The chart below shows the full market cycles over time. Since the current “full market” cycle is yet to be completed, I have drawn a long-term trend line with the most logical completion point of the current cycle.
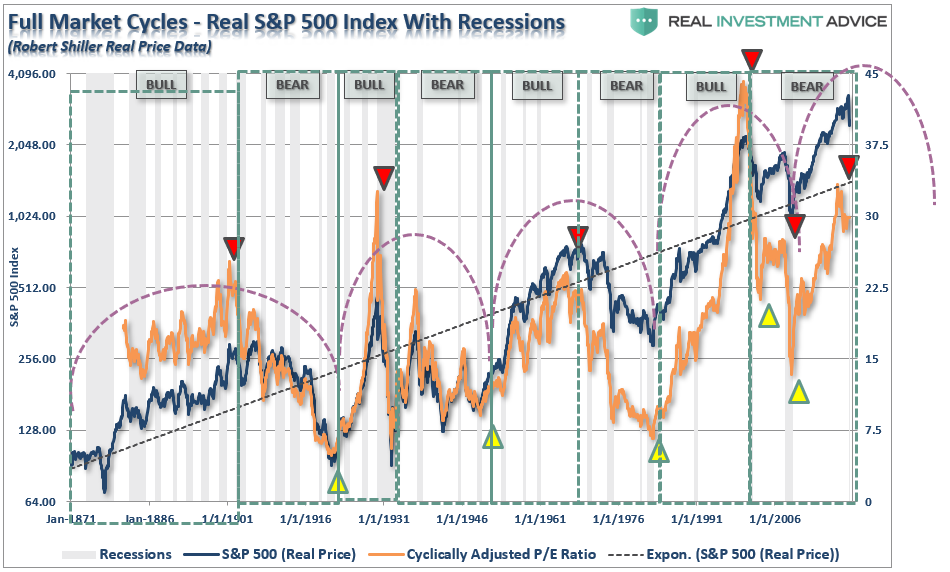
[Note: I am not stating the markets are about to crash to the 1600 level on the S&P 500. I am simply showing where the current uptrend line intersects with the price. The longer that it takes for the markets to mean revert, the higher the intersection point will be. Furthermore, the 1600 level is not out of the question either. Famed investor Jack Bogle stated that over the next decade we are likely to see two more 50% declines. A 50% decline from the all-time highs would put the market at 1600.]
As I have often stated, I am not bullish or bearish. My job as a portfolio manager is simple; invest money in a manner that creates returns on a short-term basis, but reduces the possibility of catastrophic losses, which wipe out years of growth.
Nobody tends to believe that philosophy until the markets wipe about 30% of portfolio values in a month.
The 4-Phases
AlphaTrends previously put together an excellent diagram laying out the 4-phases of the full-market cycle. To wit:
“Is it possible to time the market cycle to capture big gains? Like many controversial topics in investing, there is no real professional consensus on market timing. Academics claim that it’s not possible, while traders and chartists swear by the idea.
The following infographic explains the four important phases of market trends, based on the methodology of the famous stock market authority Richard Wyckoff. The theory is that the better an investor can identify these phases of the market cycle, the more profits can be made on the ride upwards of a buying opportunity.”
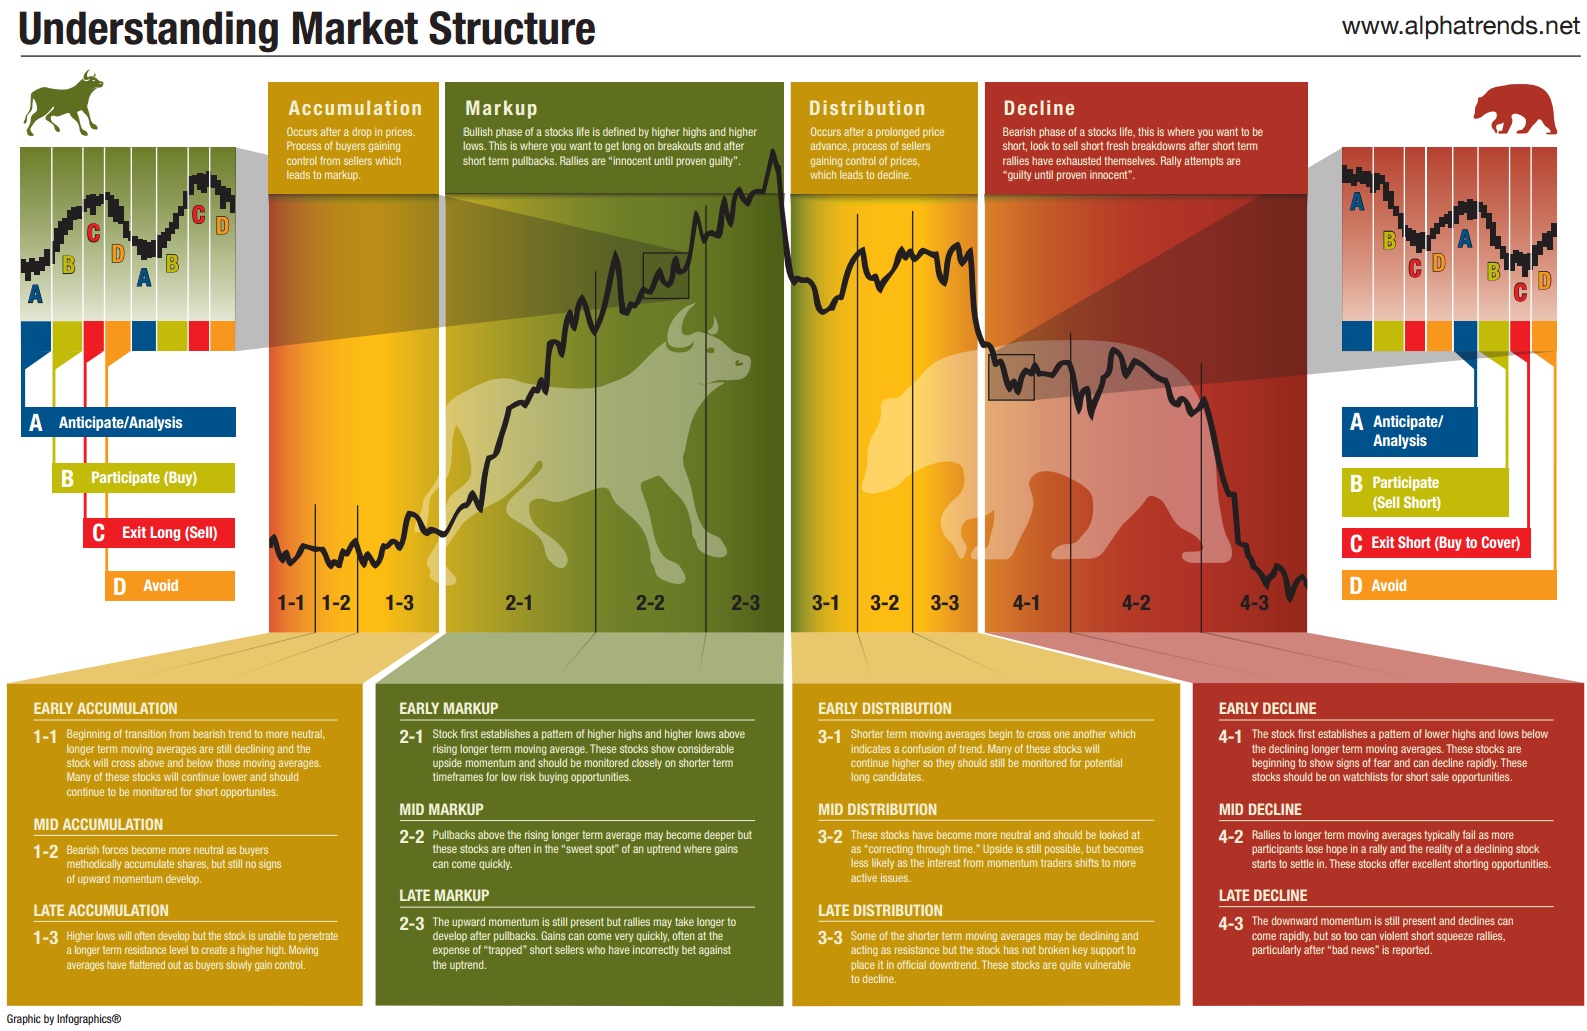
So, the question to answer, obviously, is:
“Where are we now?”
Let’s take a look at the past two full-market cycles, using Wyckoff’s methodology, as compared to the current post-financial-crisis half-cycle. While actual market cycles will not exactly replicate the chart above, you can clearly see Wyckoff’s theory in action.
1992-2003
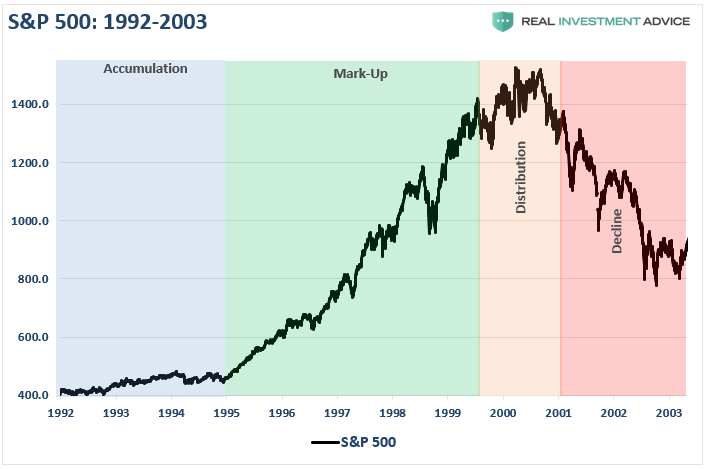
The accumulation phase, following the 1991 recessionary environment, was evident as it preceded the “internet trading boom” and the rise of the “dot.com” bubble from 1995-1999. As I noted previously:
“Following the recession of 1991, the Federal Reserve drastically lowered interest rates to spur economic growth. However, the two events which laid the foundation for the ‘dot.com’ crisis was the rule-change which allowed the nation’s pension funds to own equities and the repeal of Glass-Steagall, which unleashed Wall Street upon a nation of unsuspecting investors.
The major banks could now use their massive balance sheet to engage in investment-banking, market-making, and proprietary trading. The markets exploded as money flooded the financial markets. Of course, since there were not enough ‘legitimate’ deals to fill demand and Wall Street bankers are paid to produce deals, Wall Street floated any offering it could despite the risk to investors.”
The distribution phase became evident in early-2000 as stocks began to struggle.
Names like Enron, WorldCom, Global Crossing, Lucent Technologies, Nortel, Sun Micro, and a host of others, are “ghosts of the past.” Importantly, they are the relics of an era the majority of investors in the market today are unaware of, but were the poster children for the “greed and excess” of the preceding bull market frenzy.
As the distribution phase gained traction, it is worth remembering the media and Wall Street were touting the continuation of the bull market indefinitely into the future.
Then, came the decline.
2003-2009
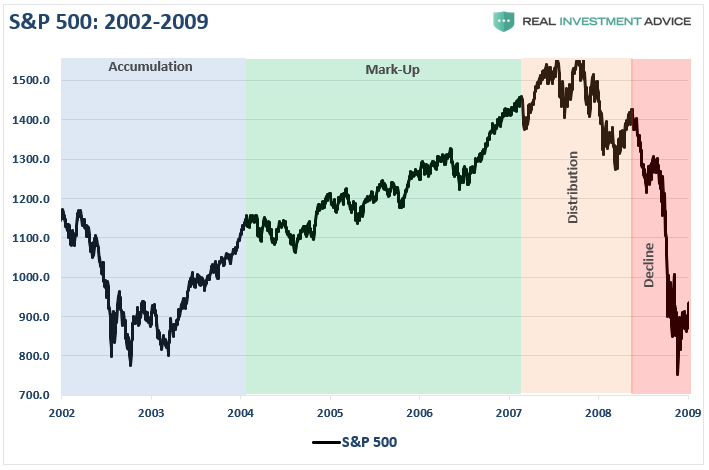
Following the “dot.com” crash, investors had all learned their lessons about the value of managing risk in portfolios, not chasing returns, and focusing on capital preservation as the core for long-term investing.
Okay. Not really.
It took about 27-minutes for investors to completely forget about the previous pain of the bear market and jump headlong back into the creation of the next bubble leading to the “financial crisis.”
During the mark-up phase, investors once again piled into leverage. This time not just into stocks, but real estate, as well as Wall Street, found a new way to extract capital from Main Street through the creation of exotic loan structures. Of course, everything was fine as long as interest rates remained low, but as with all things, the “party eventually ends.”
Once again, during the distribution phase of the market, the analysts, media, Wall Street, and rise of bloggers, all touted “this time was different.” There were “green shoots,” it was a “Goldilocks economy,” and there was “no recession in sight.”
They were disastrously wrong.
Sound familiar?
2009-Present
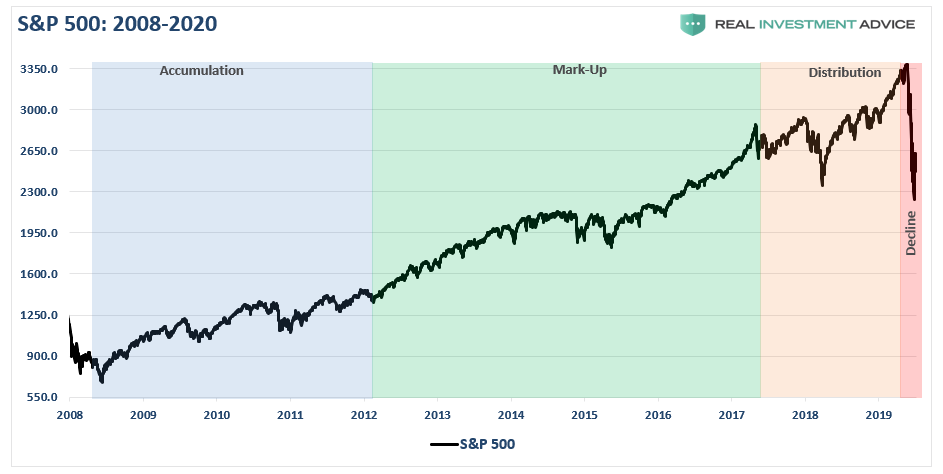
So, here we are, a decade into the current economic recovery and a market that has risen steadily on the back of excessively accommodative monetary policy and massive liquidity injections by Central Banks globally.
Once again, due to the length of the “mark up” phase, most investors today have once again forgotten the “ghosts of bear markets past.”
Despite a year-long distribution in the market, the same messages seen at previous market peaks were steadily hitting the headlines: “there is no recession in sight,” “the bull market is cheap” and “this time is different because of Central Banking.”
Well, as we warned more than once, all that was required was an “exogenous” event, which would spark a credit-event in an overly leveraged, overly extended, and overly bullish market. The “virus” was that exogenous event.
Lost And Found
There is a sizable contingent of investors, and advisors, today who have never been through a real bear market. After a decade long bull-market cycle, fueled by Central Bank liquidity, it is understandable why mainstream analysis believed the markets could only go higher. What was always a concern to us was the rather cavalier attitude they took about the risk.
“Sure, a correction will eventually come, but that is just part of the deal.”
As we repeatedly warned, what gets lost during bull cycles, and is always found in the most brutal of fashions, is the devastation caused to financial wealth during the inevitable decline. It isn’t just the loss of financial wealth, but also the loss of employment, defaults, and bankruptcies caused by the coincident recession.
This is the story told by the S&P 500 inflation-adjusted total return index. The chart shows all of the measurement lines for all the previous bull and bear markets, along with the number of years required to get back to even.
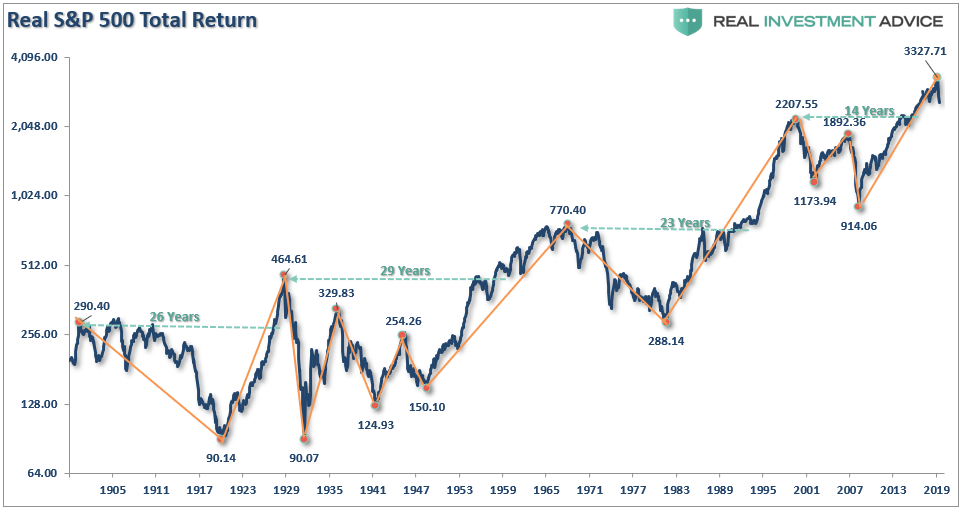
What you should notice is that in many cases bear markets wiped out essentially all or a very substantial portion of the previous bull market advance.
There are many signs suggesting the current Wyckoff cycle has entered into its fourth, and final stage. Whether, or not, the current decline phase is complete, is the question we are all working on answering now.
Bear market cycles are rarely ended in a month. While there is a lot of “hope” the Fed’s flood of liquidity can arrest the market decline, there is still a tremendous amount of economic damage to contend with over the months to come.
In the end, it does not matter IF you are “bullish” or “bearish.” What matters, in terms of achieving long-term investment success, is not necessarily being “right” during the first half of the cycle, but by not being “wrong” during the second half.

