


Markets were spared when the Houston Astros won the world series. As we highlighted in the 10/12/2022 Commentary, markets tumbled every time a Philadephia professional baseball team won a championship. Should we be anxious as the 2022 World Cup kicks off?
To see how the World Cup may sway markets, we share research from Is There a Correlation Between World Cups and the S&P 500? written by Ralph Baddour. He uses four trading strategies, which vary slightly by the starting and ending trade dates. The S&P 500 return for the four strategies ranged from -1.86% to -2.47%, with a mean return of -2.11%. Baddour’s World Cup trading advice:
Therefore, the ideal trading strategy for the S&P 500, as suggested by these empirical results, is to short the index prior to the start of a World Cup and cover the position immediately following the tournament’s final match.
The World Cup, like Philadelphia baseball, has zero effect on the fundamental or technical underpinnings of markets. However, as Baddour writes:
Whether it’s the potential for worker and investor distraction, or effects on investor morale (positive or negative, depending on which team one is supporting) spanning multiple weeks, there is clearly the possibility of a calendar effect tied to the World Cup, scheduled every four years.

What To Watch Today
Economy
- No Notable Releases Today
Earnings
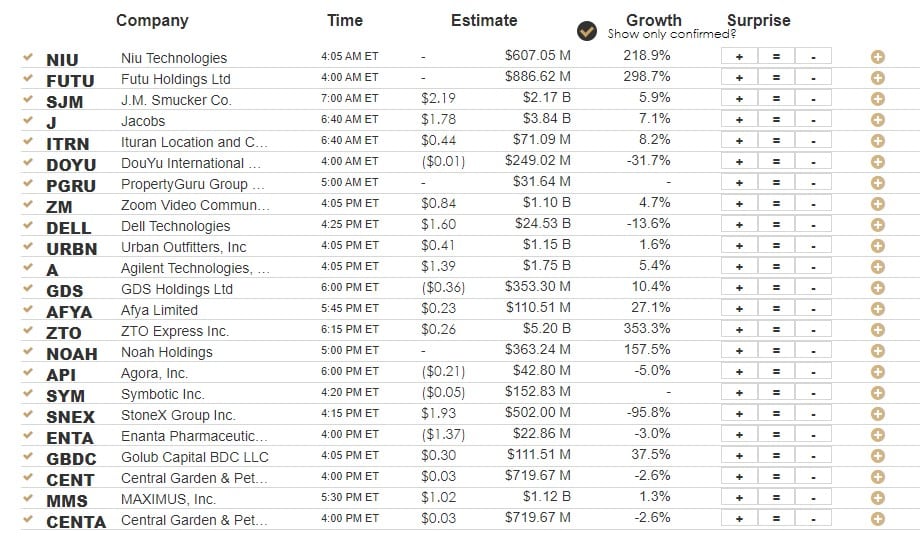
Market Trading Update
This week, the market touched our initial objective of 4000, but as we will discuss momentarily, tough talk from Federal Reserve officials knocked the markets back a bit. However, despite those comments, the sell-off was mild, holding above key supports heading into the holiday-shortened and light volume trading week where the “inmates will run the asylum.”
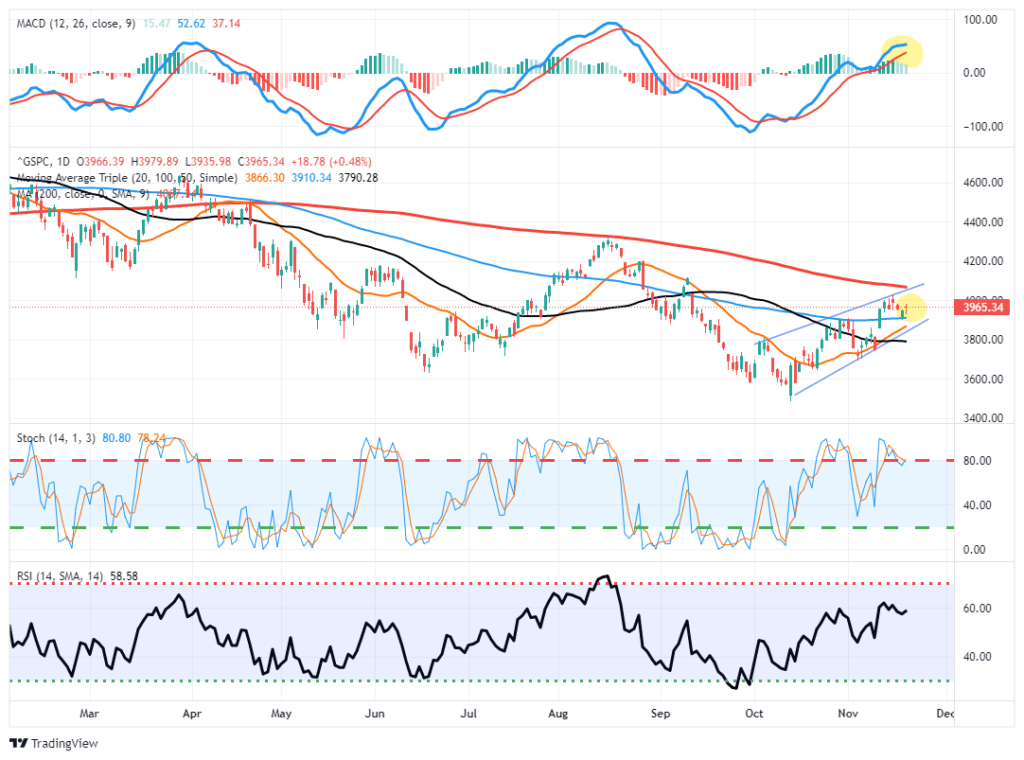
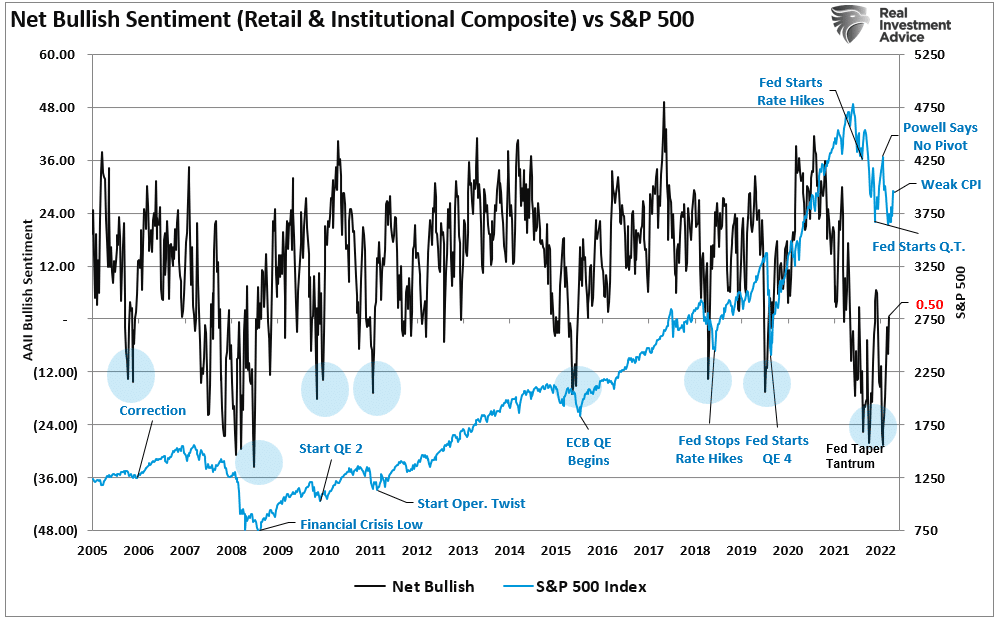
The good news is that the market tested, and held, 100-dma with the 20-dma crossing above the 50-dma. With the market contained in a rising trend channel, this all suggests the bulls remain in control for the time being. Speaking of “inmates,” the net bullishness of investors is now at the highest level since the July market peak.
With next week a holiday-shortened trading week, a continued advance through the end of the month is likely.
The Week Ahead
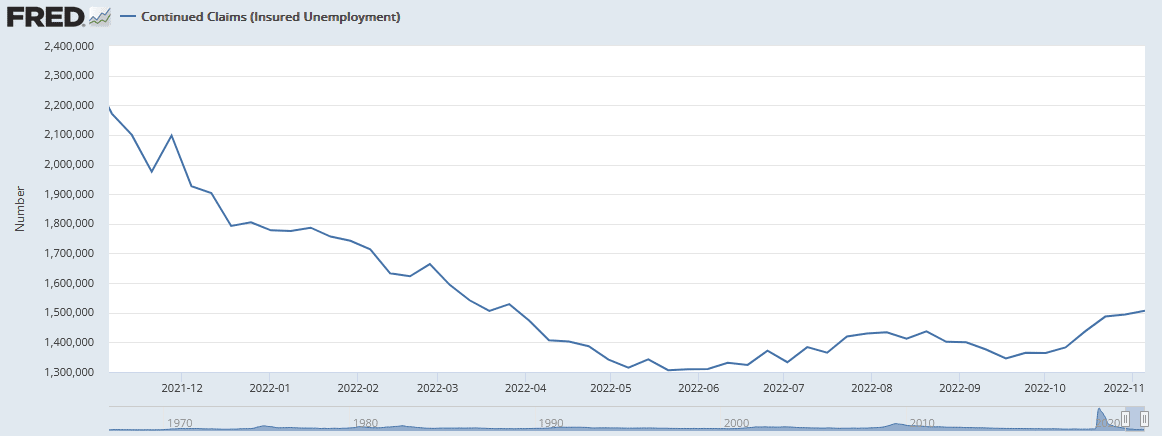
The week ahead will be quiet heading into the Thanksgiving holiday. A slew of data will be released on Wednesday, including jobless claims, durable goods, new home sales, and the University of Michigan Consumer Sentiment Index. We will focus on jobless claims and, in particular, continuing claims. This data point helps us understand how quickly recently laid-off people can find new employment. The figure remains historically low, but it has been rising since June. Of all employment indicators, this is often the first to signal changes in the labor market.
We suspect a few more Fed members will emphasize the Fed’s hawkish position. Further, the FOMC minutes, due on Wednesday, from the last meeting will likely stress the Fed’s sole intention to fight inflation with an extremely tight monetary policy.
Housing Market Standstill
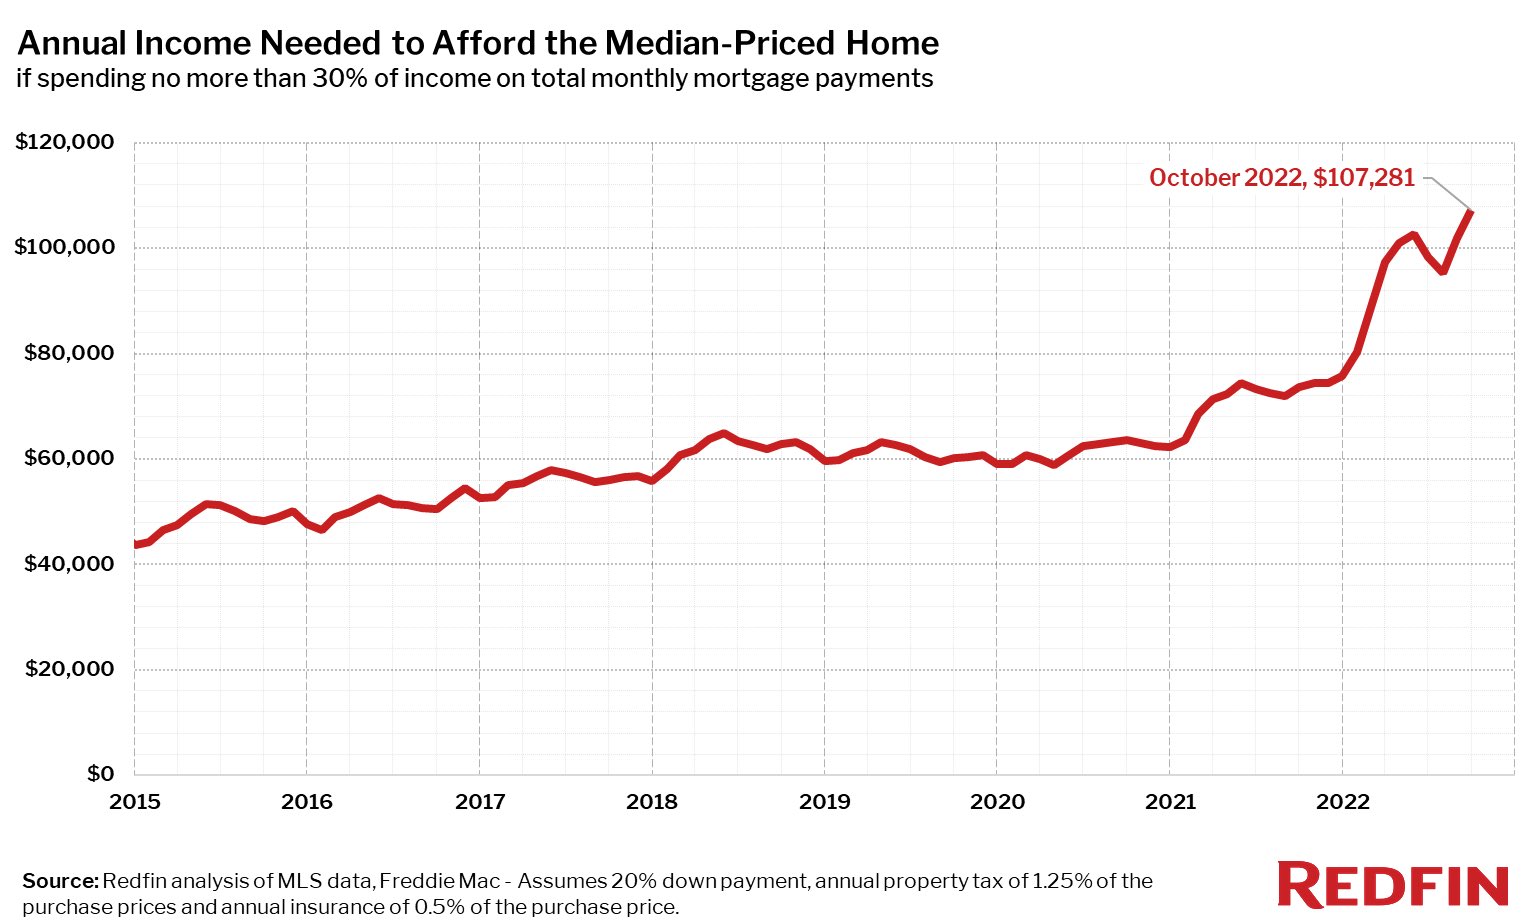
The housing market has ground to a halt as many sellers are unwilling to drop prices enough to compensate potential buyers for higher mortgage rates. With mortgage rates around 7%, mortgage payments have risen sharply. Consider the graph below to stress how mortgage rates have affected homebuyers’ payments. As it shows, a homebuyer wanting to buy a median-priced home with a mortgage payment equal to 30% of their income must have an income of $107,000. At the start of 2021, less than two years ago, the same buyer would only have needed about $62,000 to buy the same house. The combination of higher prices and mortgage rates puts the real estate market at a standstill. This will likely continue until house prices and mortgage rates decline to more economically feasible levels.
A Bearish Signal with Bullish Implications
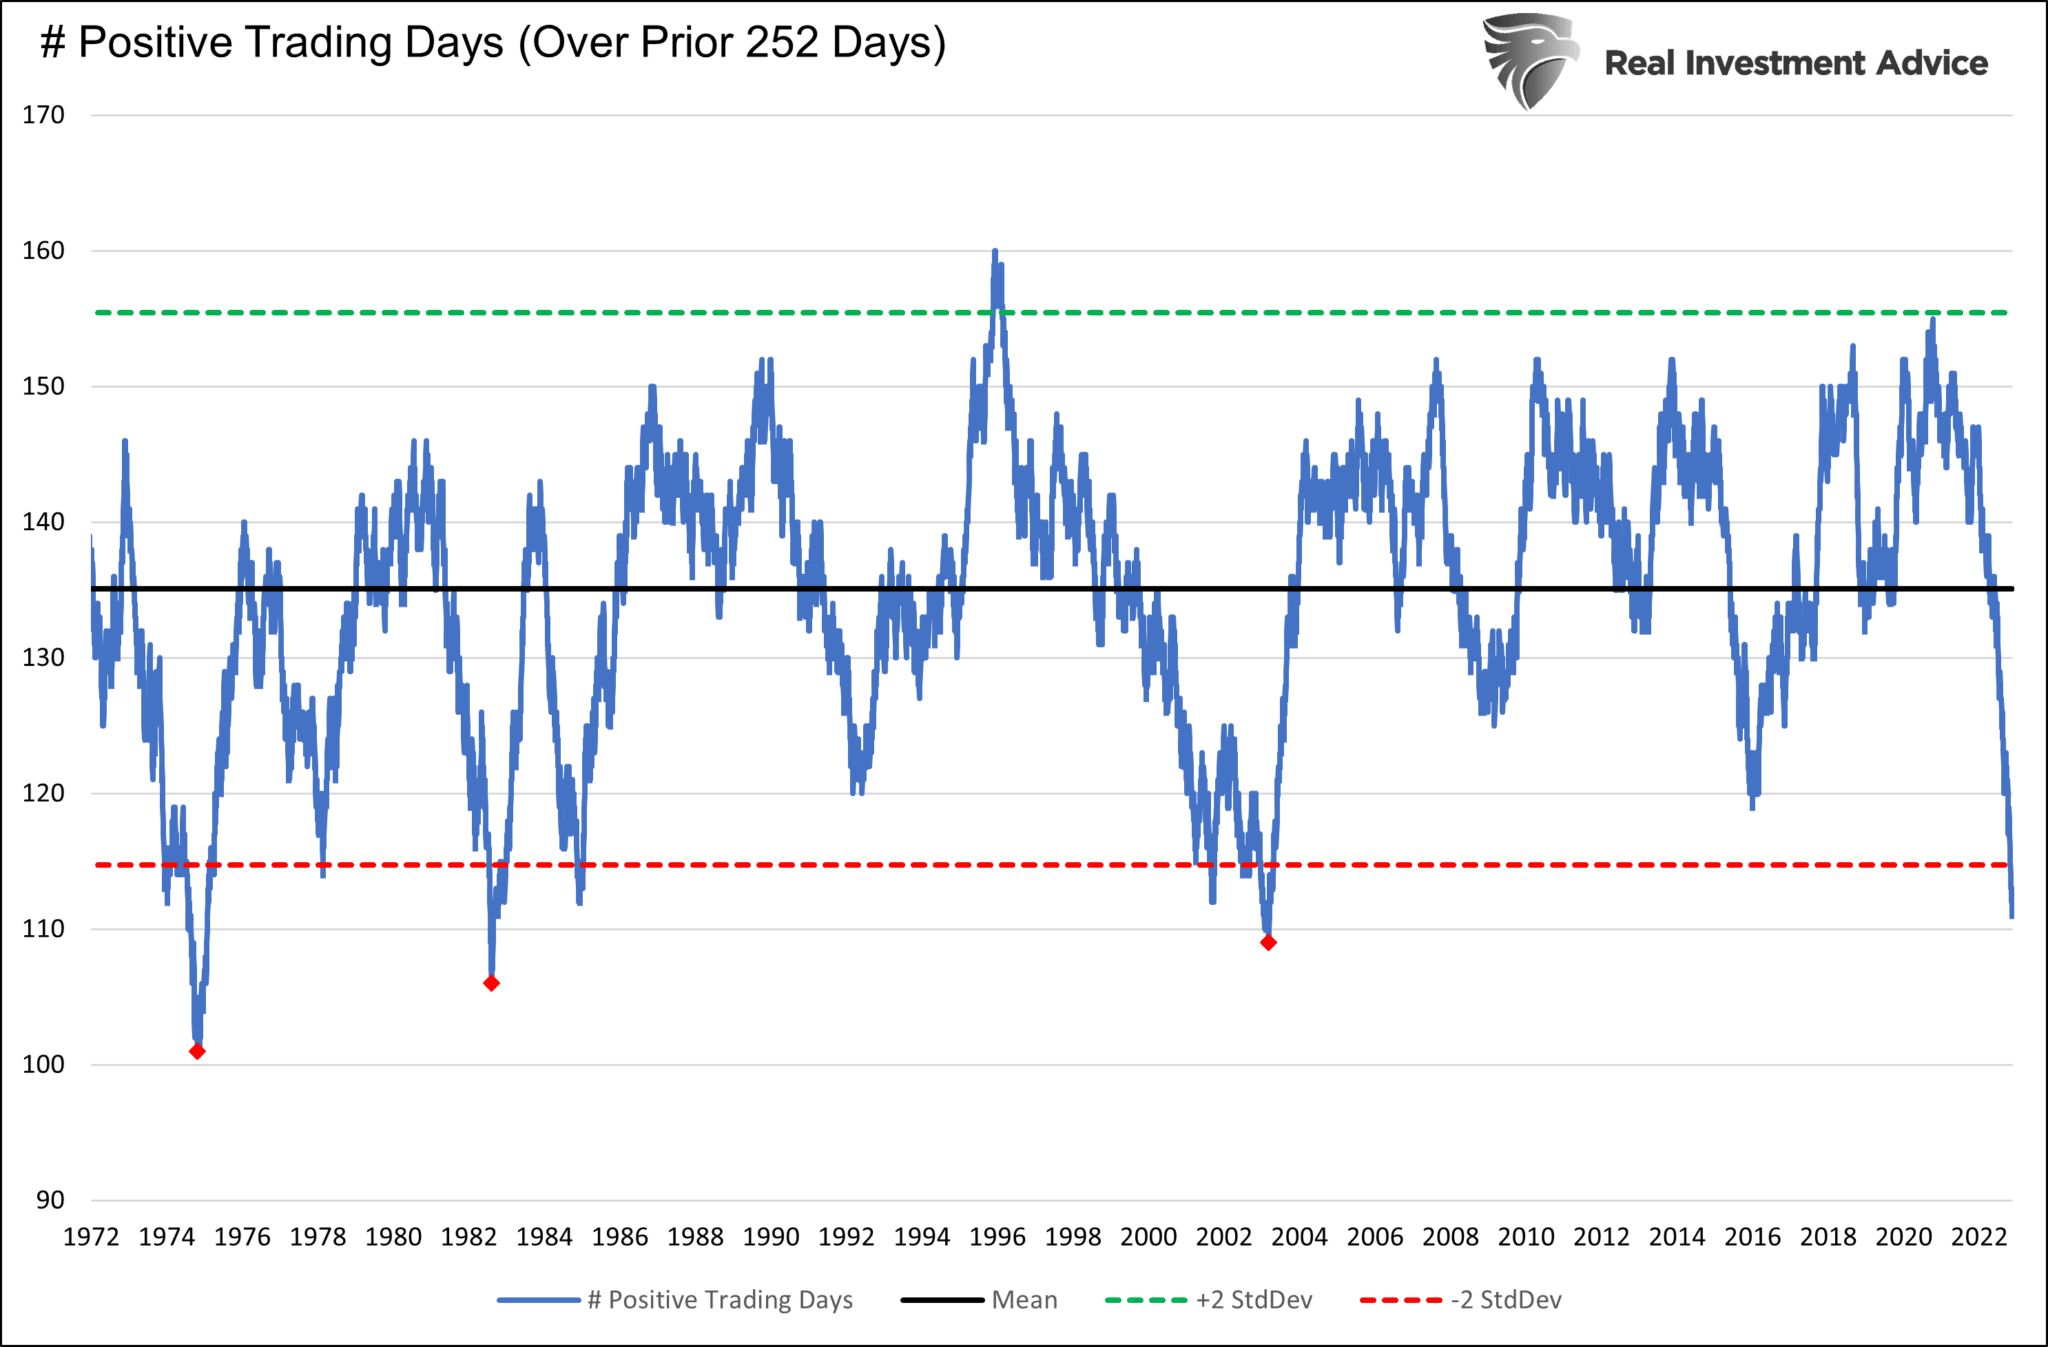
The graph below plots the number of positive trading days per the prior 252-day periods going back 50 years. Over the last 252 trading days, only 111 days, or 44%, have been positive. The red diamonds highlight that such a low occurrence has only happened three other times, two of which were over 40 years ago. From oldest to newest, the annual return for the next 252 trading days following those highlighted lows are as follows: +28.02%, +57.73%, and +40.36%. Therefore, we may have quite a rally in the coming year if this indicator proves worthy.
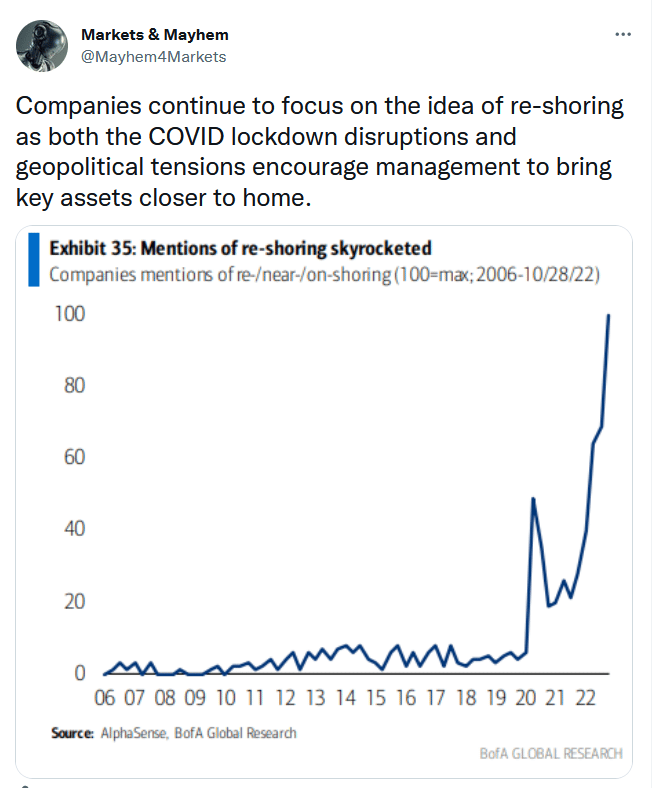
Tweet of the Day
Please subscribe to the daily commentary to receive these updates every morning before the opening bell.
If you found this blog useful, please send it to someone else, share it on social media, or contact us to set up a meeting.
Also Read


