


Our most recent article, Treasury Yield Curves- Is This Inversion Different, explains why inverted yield curves have always preceded recessions. In a nutshell, U.S. and global economic growth heavily depend on increasing debt levels and are very sensitive to the level of interest rates accompanying the debt. When the yield curve inverts, banks that often borrow at short-term rates and lend for longer terms long see the potential profitability for new loans decline. Such disincentives tighten lending standards. Paradoxly, the last four recessions did not begin until an uninversion of the yield curve occurred, and bank lending became more profitable. Currently, the yield curve is the most inverted it has been since 1982 and shows no signs of uninversion. As such, Yahoo Finance provides optimism that a recession is not close.
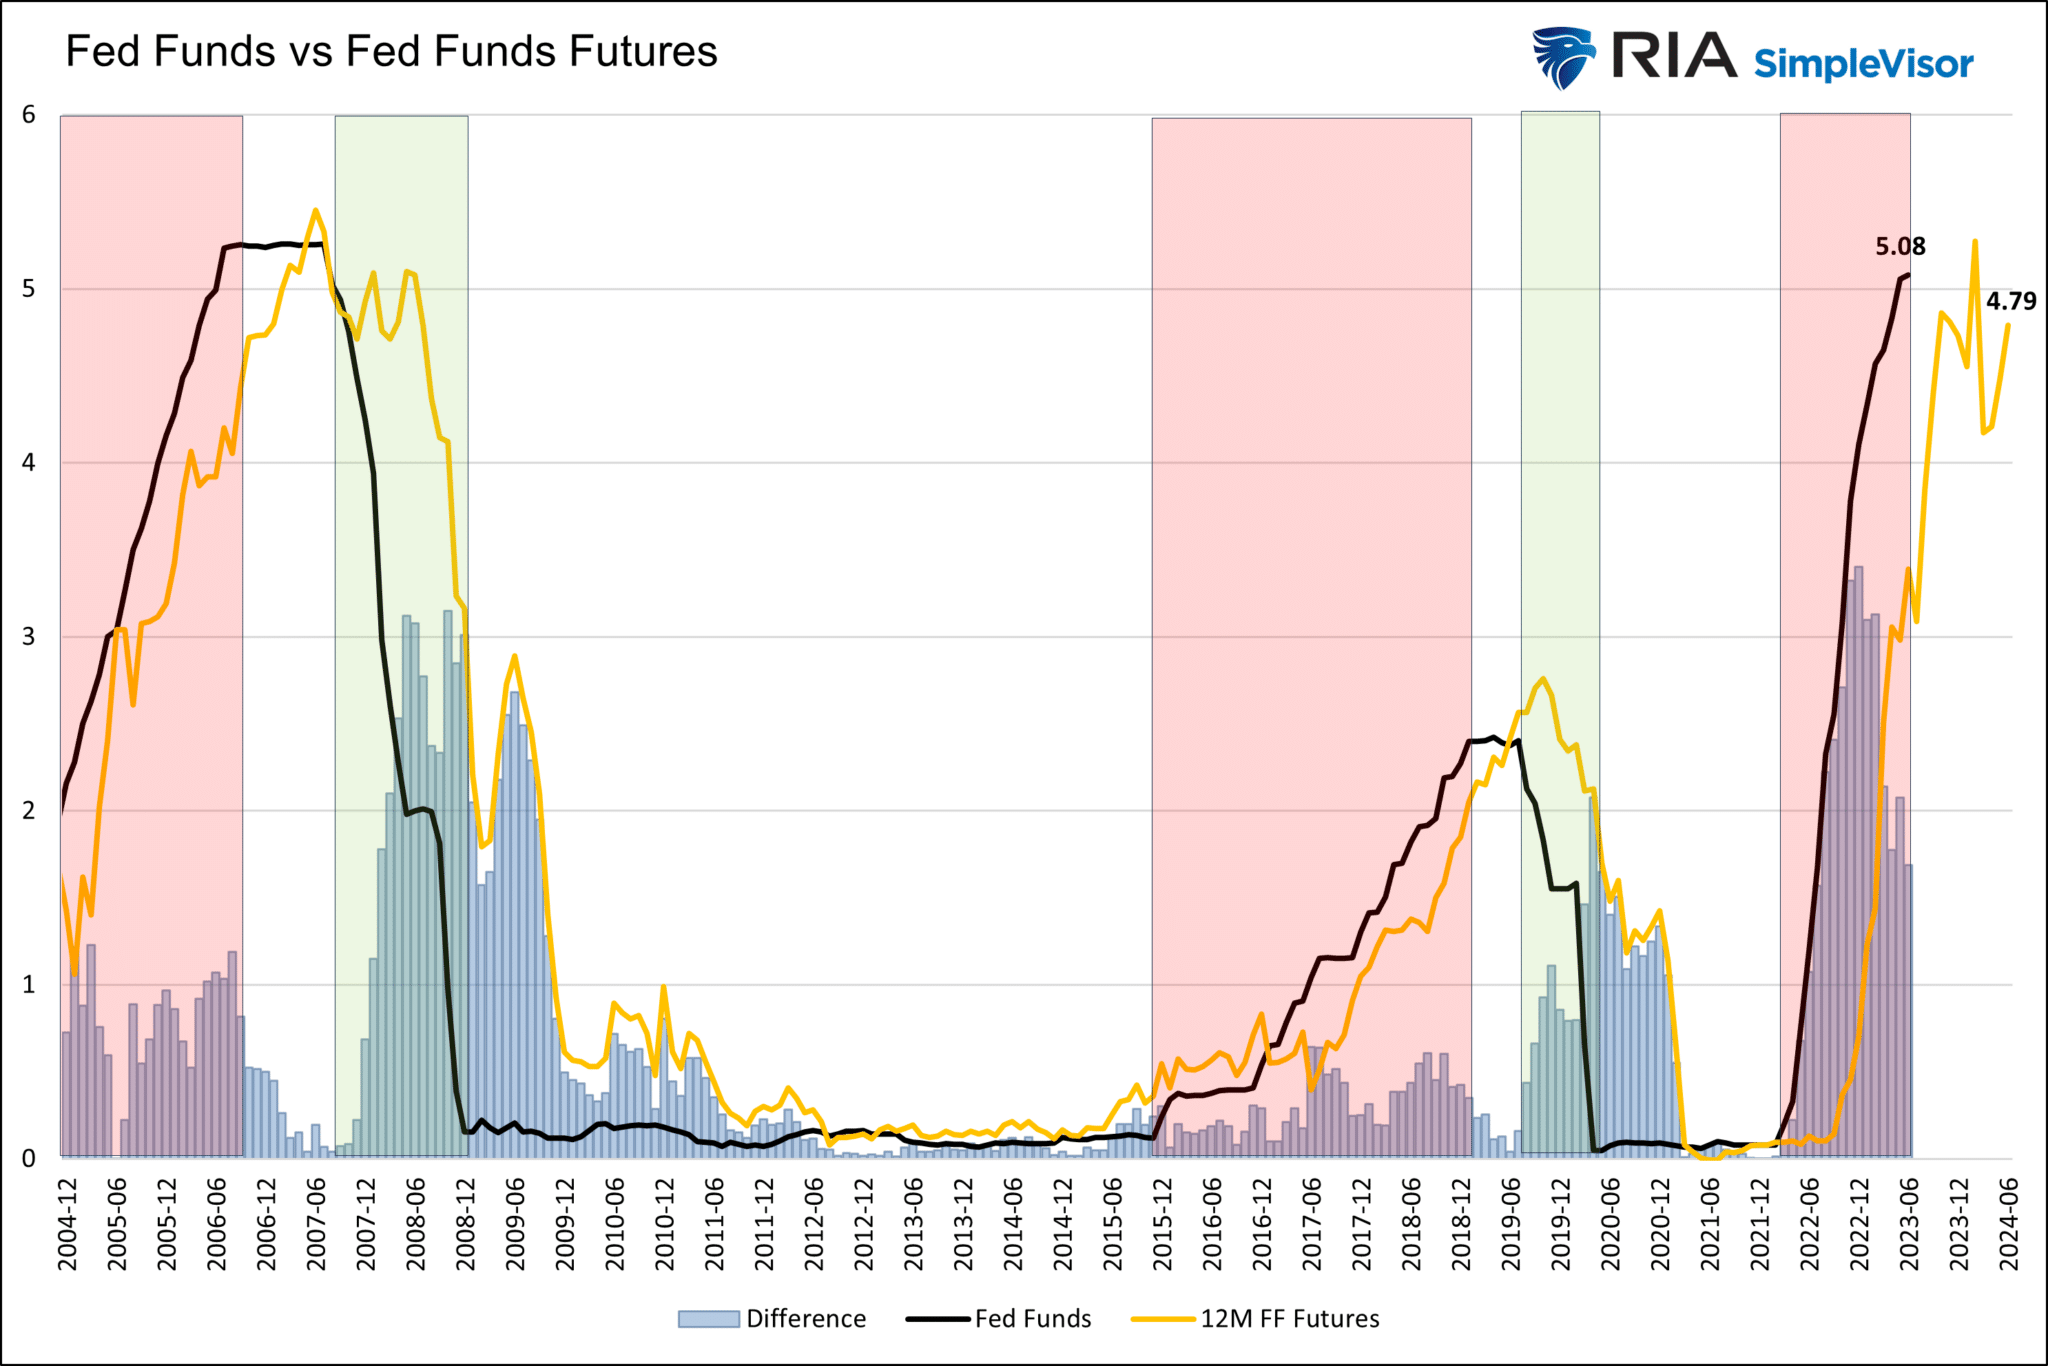
Per Yahoo’s article A Reliable Indicator Maybe Three Years Away: “Right now, according to Golub, those futures imply the yield curve will first un-invert in June 2026. Pricing of those futures could certainly shift again — as recently as the end of April, they were pricing in uninversion in April 2024″. While the argument sounds logical, its reliance on Fed Fund futures is grossly faulty. The graph below shows that the Fed Funds futures market overestimated the level of Fed Funds by over 3% in 2008 and 2% in 2020, the last two times the Fed cut rates. When economic activity slows, the Fed aggressively pushes for the uninversion of yield curves to loosen bank lending standards and increase debt levels. The goal is to boost spending and ultimately generate economic activity. We presume they will again once the lag effects of prior rate hikes are felt.
What To Watch Today
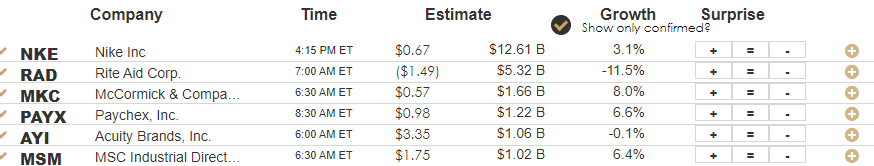
Earnings
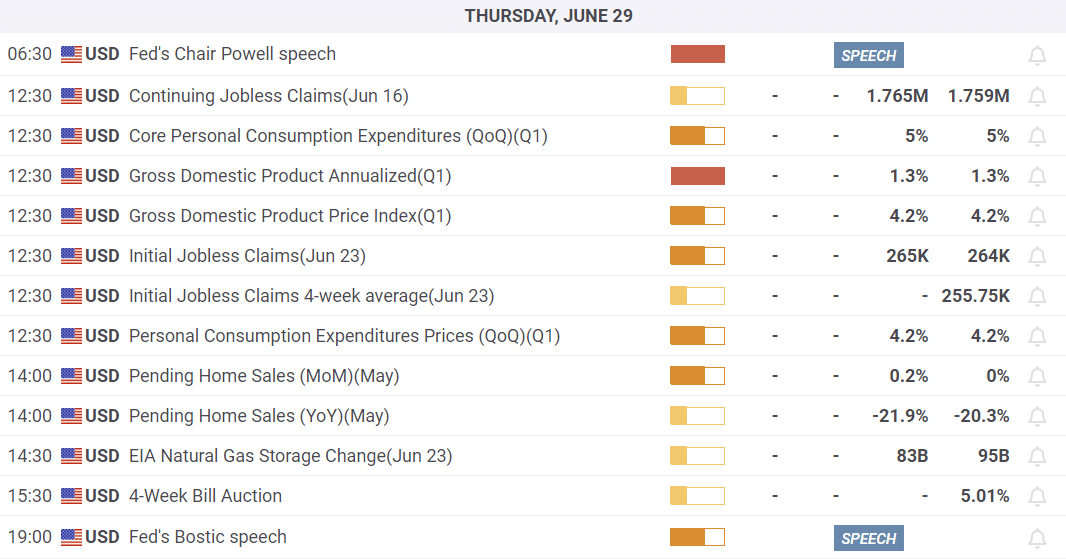
Economy
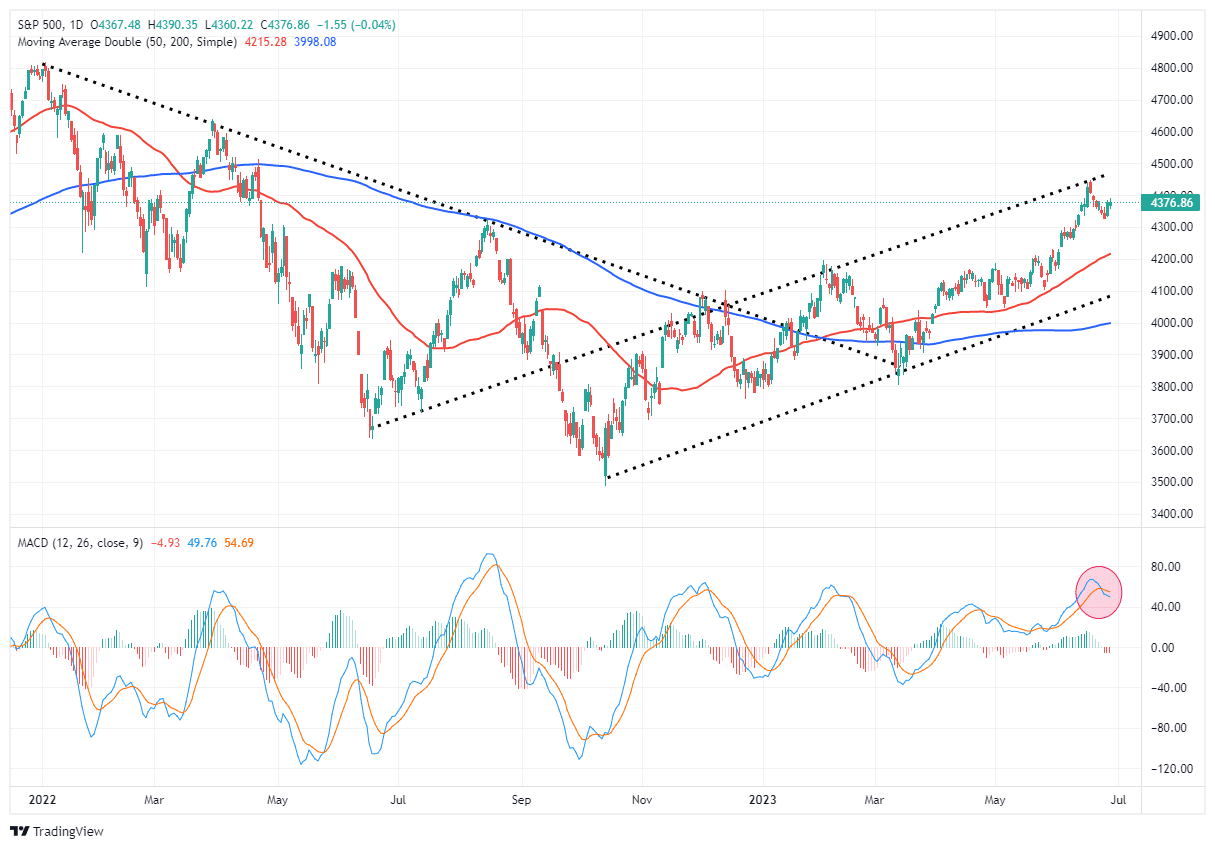
Market Trading Update
The market started off on a stronger note yesterday but ended flat as profit-taking hit semiconductors. Overall, there was a good bit of red in the overall market with small pockets of strength. However, from a technical basis, the action continues to confirm what we expected with the sell signal in place. Today and tomorrow will wrap up the end of the quarter, so we could see some additional sloppy action until Friday.
However, while July hosts the next Federal Reserve meeting, it also kicks off the Q2 earnings season. If earnings and guidance continue to improve, such could continue to provide a bid under equities near term. While there are many reasons for concern, those concerns continue to get pushed further into the future. Our best advice is to pay less attention to the overall market and focus specifically on the amount of risk you are willing to take to create returns near term. As is always the case, the more risk you take chasing markets near term, the greater the potential for loss when something goes wrong.

More on House Prices
The last two commentaries shared views of the potential for falling house prices. We follow up with some hard data.
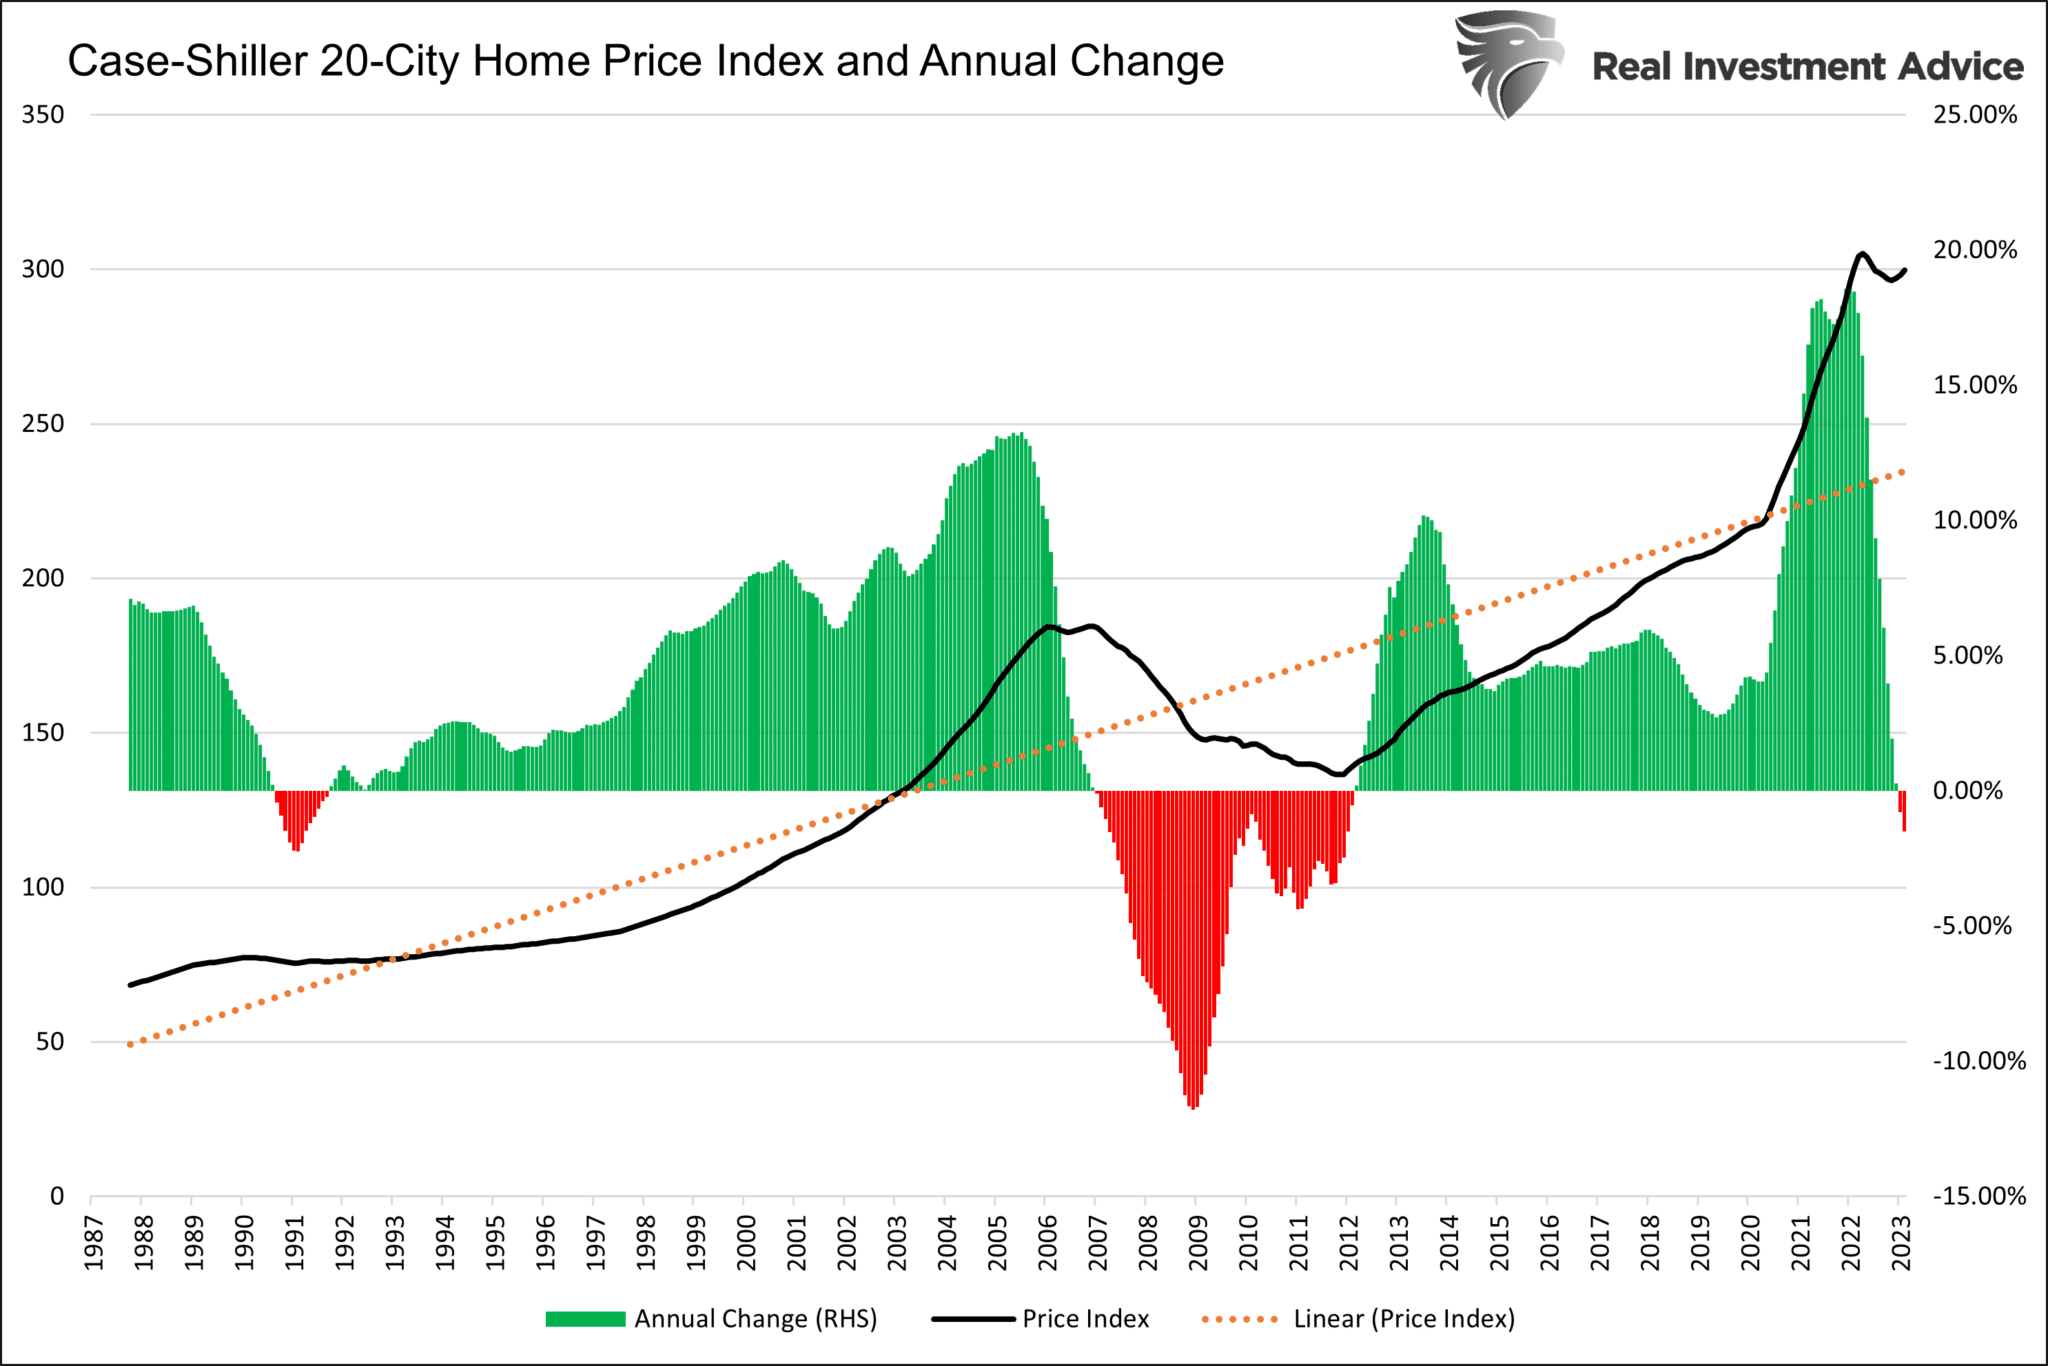
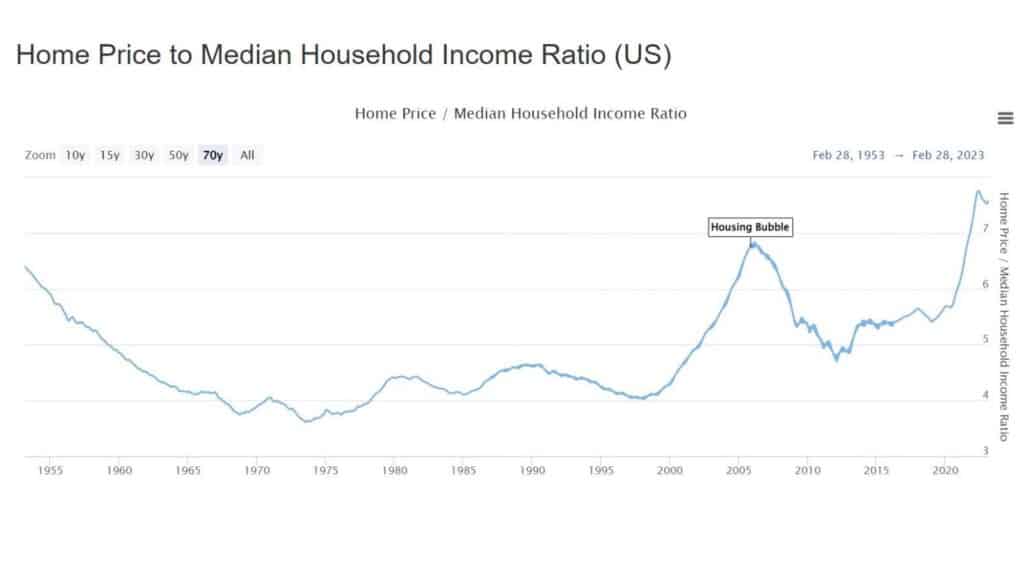
The recently released Case Shiller 20-City Home Price Index posted its second consecutive annual percentage decline. The latest data shows house prices dipped -1.50% over the last 12 months, following -0.8% last month. For context, annual house price inflation was nearly 20% about a year ago. While the cessation of home price inflation is good, prices remain well above the trend (dotted orange line). Prices would need to fall approximately 20% to return to trend. The second graph provides more context arguing that prices may likely head lower.
Don’t Sleep on the Lag Effects
Jerome Powell speaking at a conference yesterday, said the following:
“We’ve come a long way, we also think there’s a lot of tightening power coming through. We haven’t been restrictive for that long. We believe there’s more restriction coming.”
His statement is powerful. He warns that the effects of the prior 500bps of rate hikes in little more than a year are still working their way into the financial system. He is referring to the lag effects. His statement explains why the Fed would like to pause but maintain a hawkish tone. They know the rate hikes from last year and earlier this year will further slow down economic activity. However, they do not know how much. The Fed risks tightening too much.
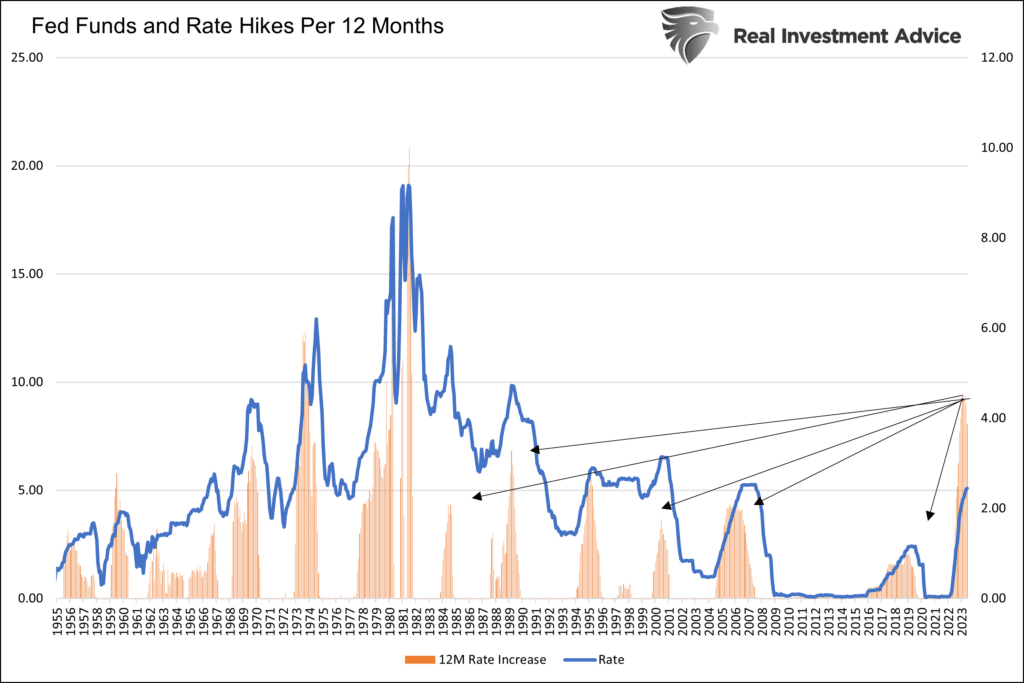
The bullish takeaway from his statement is that the recent pause may end the tightening cycle. While no more rate hikes may be seen as bullish, the problem is that the Fed raised rates at a speed and amount not seen in over forty years. The lag effects may be more potent than many economists anticipate. The graph below shows Fed Funds rose at least 2x the rate than the last five meaningful periods of rate hikes. Don’t underestimate the lag effects!
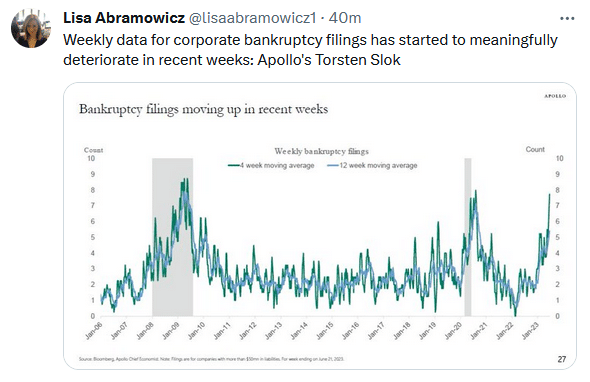
Tweet of the Day
Please subscribe to the daily commentary to receive these updates every morning before the opening bell.
If you found this blog useful, please send it to someone else, share it on social media, or contact us to set up a meeting.
Also Read


