Leading economists, Federal Reserve Presidents, and most investors pay close attention to the shape of Treasury yield curves. They follow them, not necessarily because they care about the inner workings of the bond market. Instead, they are proven predictors of recessions. All six of the last recessions were preceded by an inverted Treasury yield curve.
Most U.S. Treasury yield curves have been inverted for over a year, but investors and pundits are questioning whether this time is different. Might the current yield curve inversion lead to continued economic growth and skip a recession?
We argue it’s not different this time, but the situation is unique.
Key Takeaways
- Yield curve inversions, as we currently have, portend recessions.
- Debt drives economic growth; therefore, interest rates are a big factor in determining economic activity.
- Banks use time and credit arbitrage to make profits.
- Our proxy for lending profitability is at 25-year lows, resulting in tightening lending standards.
- This time is not different, but the pandemic-related stimulus makes it somewhat unique.
Today’s Yield Curves
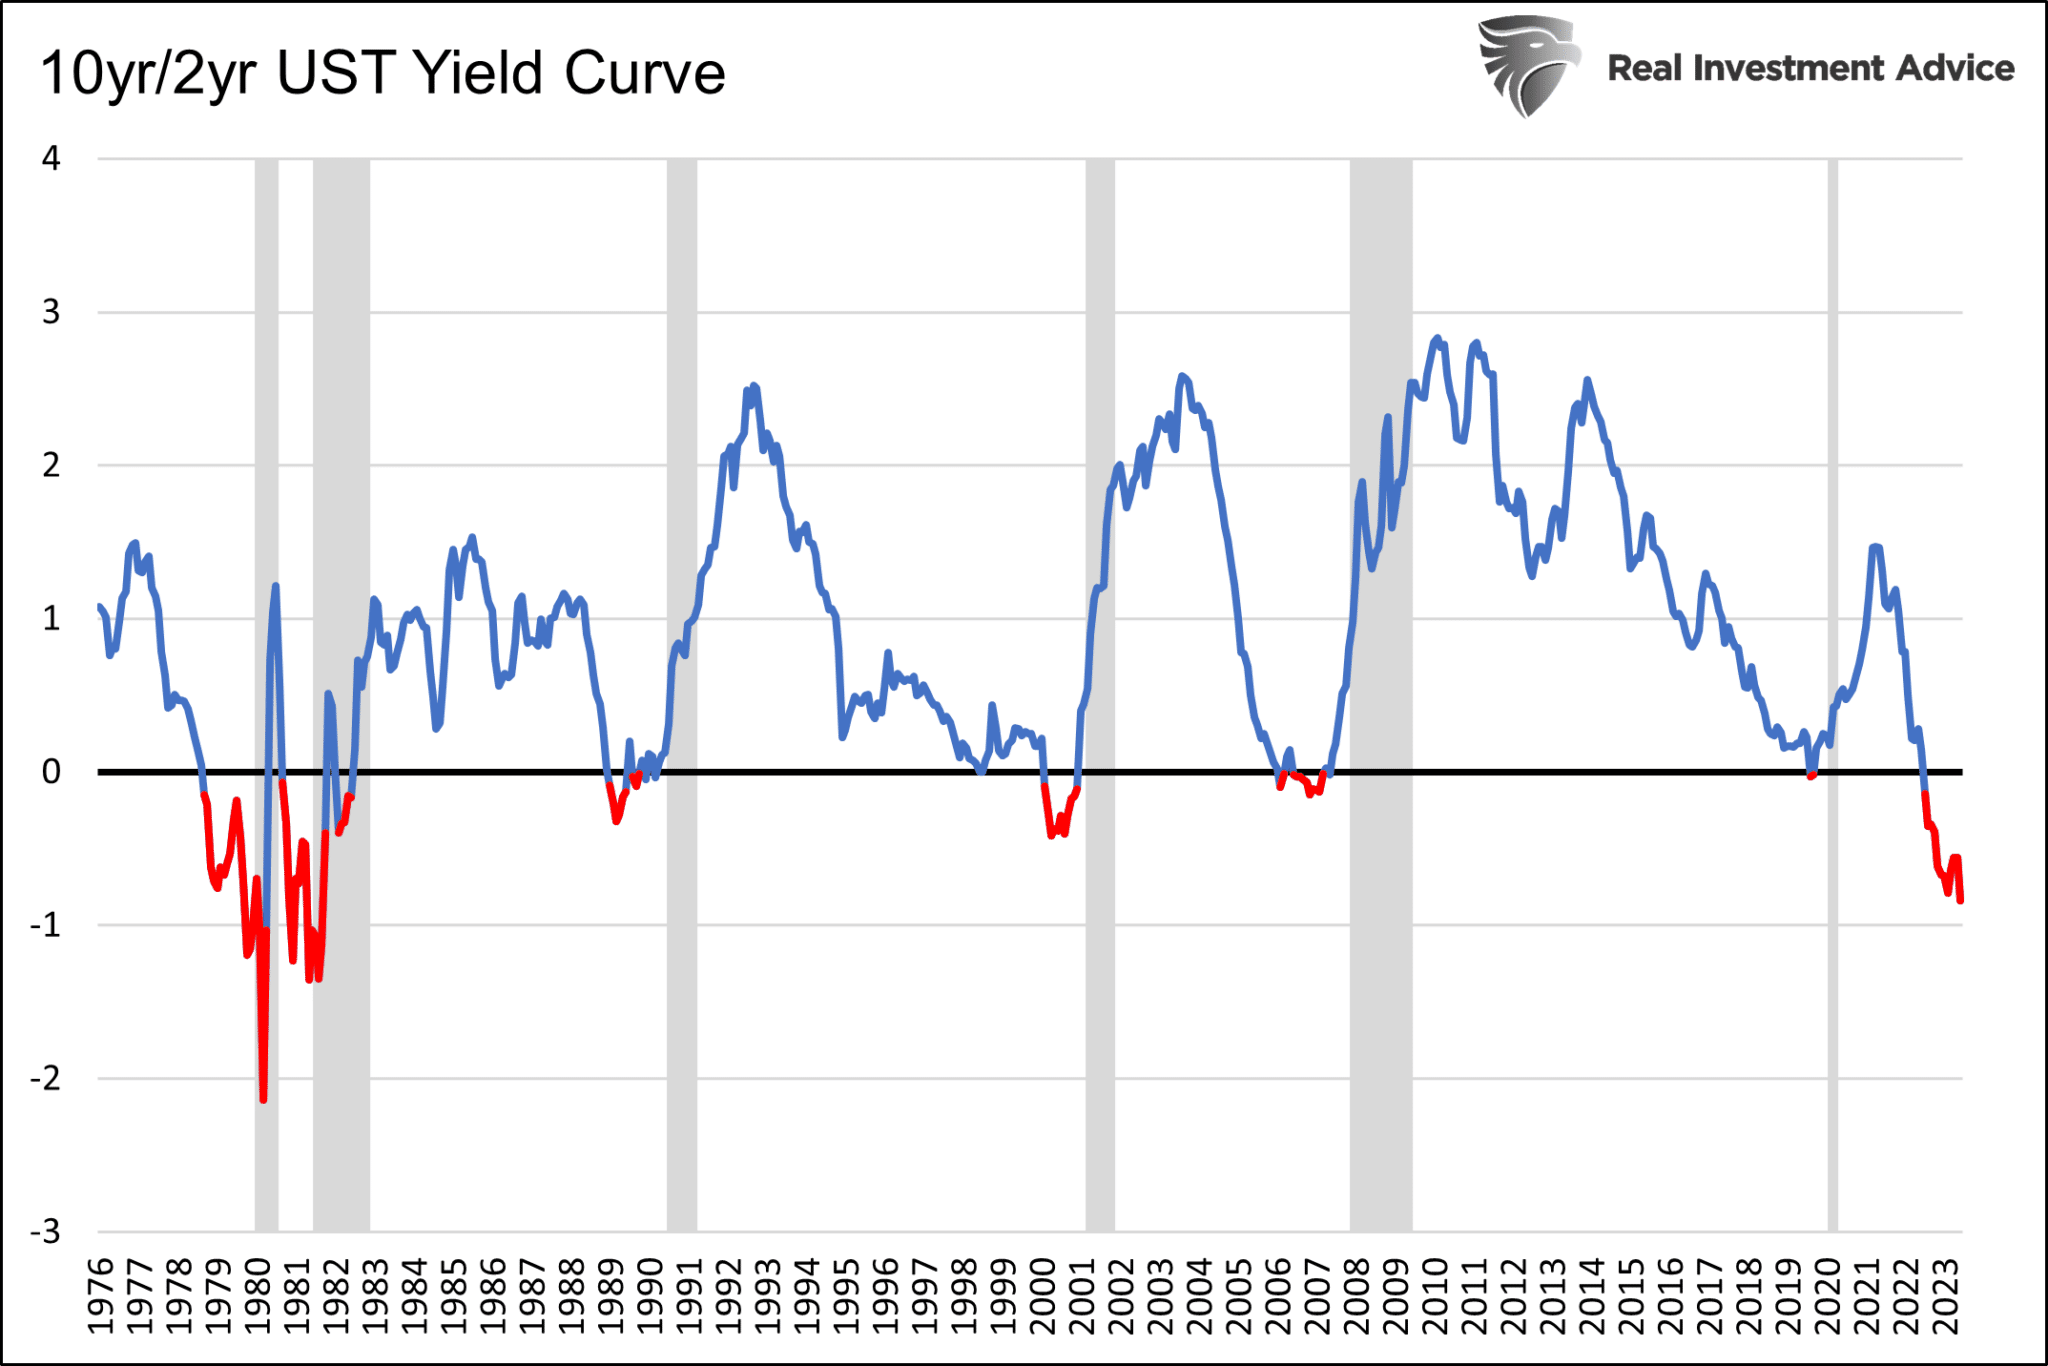
The first graph below, charting the 10yr/2yr U.S. Treasury yield curve, shows that every inversion since 1980 has heralded a recession. The last four recessions didn’t start until the inverted curve returned to a positive reading.
The yield curve has been inverted for over twelve months and is much deeper than the inversions leading to the three prior recessions. This inversion looks more like the early 1980s. If we exclude the pandemic-related recession of 2020 due to its abnormalities, the average time from when the yield curve first inverted until the NBER officially denoted recession was 16 months.
While the 2yr/10yr curve is the most well-followed yield curve, it can be limiting as it only applies to those that borrow and lend in the two and ten-year maturity sectors. For example, the 2yr/10yr curve is less critical for a bank using customer deposits to make five-year auto loans. In this case, the bank’s chief concern is likely the 3-month/5yr curve.
The following graph views the many variations of Treasury curves and provides a broader perspective of the shape of the entire Treasury yield curve.
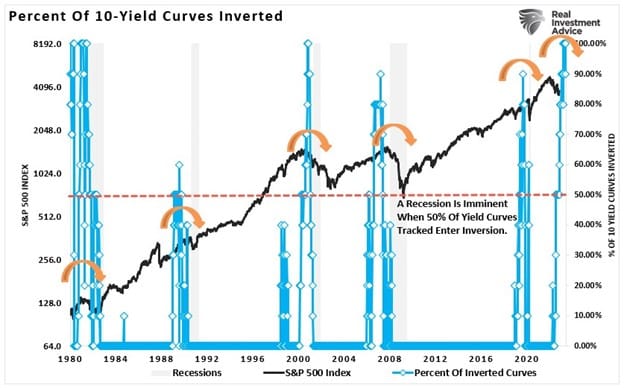
As shown, ten of the ten most followed yield curves are in an inverted state. The graph highlights that it has only taken 50% of the curves to invert to trigger recessions since 1980.
With an understanding of the current state of the yield curves, we examine why the yield curve has such a significant effect on the economy.

Our Economy Runs on Debt
In Speak Loudly Because You Carry a Small Stick, we advised the Fed. Today’s economy is more leveraged, thus, more dependent on low-interest rates than at any other time in the nation’s history. As such, we advised the Fed to tread lightly with further interest rate hikes.
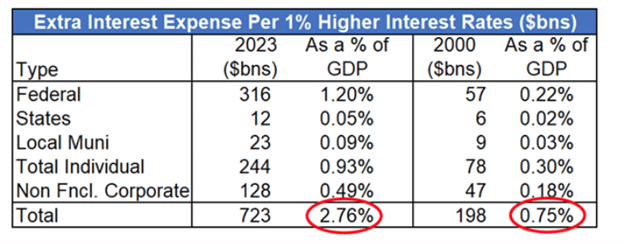
The following commentary and table from the article highlight that each 1% increase in interest rates results in interest expenses rising 2.76% of GDP. That compares to 0.75% in 2000.
We use the five-year Treasury as a proxy for interest rates to approximate how higher interest rates will dampen the economy over time. The five-year note currently yields 4.25%, about 2.50% above its 1.75% average for the last 12 years. Most maturing debt was added when interest rates were below 2%.
If only 20% of debt matures this year and is rolled over, the additional interest cost could be equivalent to 1.38% of GDP. The percentage will continue to increase as more debt matures and gets reissued at higher rates.
For an economy heavily dependent on creating new debt and refunding existing debt, anything that detracts from a willingness to lend money is an economic drag.
Lending From the Bank’s Perspective
There are essentially two ways banks make money lending. They can arbitrage time or credit. They often do both at the same time.
Time Arbitrage
Time arbitrage is the oldest money-making trick in the book. It is commonly referred to as borrowing short and lending long. Banks usually borrow from depositors at lower short-term borrowing rates while lending at higher longer-term rates.
The risk of time arbitrage is that short-term borrowing rates rise above existing loan rates and reduce or eliminate profits. Such is occurring today, as we saw with Silicon Valley Bank and others. It was also the cause of the Savings and Loan crisis of 1987-1989.
The other issue facing banks from higher short-term rates is deposits leave the bank for higher yields elsewhere. Deposits, accounting for roughly 85% of collective bank liabilities, are the fodder allowing banks to make loans.
The steeper the yield curve, the more banks profit and the more incentive to borrow short and lend long. Such promotes economic growth. Conversely, inverted yield curves disincentivize lending and dampen economic growth.
Credit Arbitrage
The riskier a borrower, the higher the interest rate charged to borrow money. Banks tend to be highly rated, thus allowing them to borrow at lower rates and lend the money to lesser-rated borrowers at higher rates. As the shape of the yield curve dramatically affects time arbitrage, credit spreads play a crucial role in credit arbitrage. When the difference in yields between risky and less risky assets, i.e., credit spreads, are tight as they are, the potential lending profits are reduced. Consequently, banks are less incentivized to lend. Credit spreads, as quantified by BBB-rated corporate bonds, are below long-term averages despite heightened recession risk.

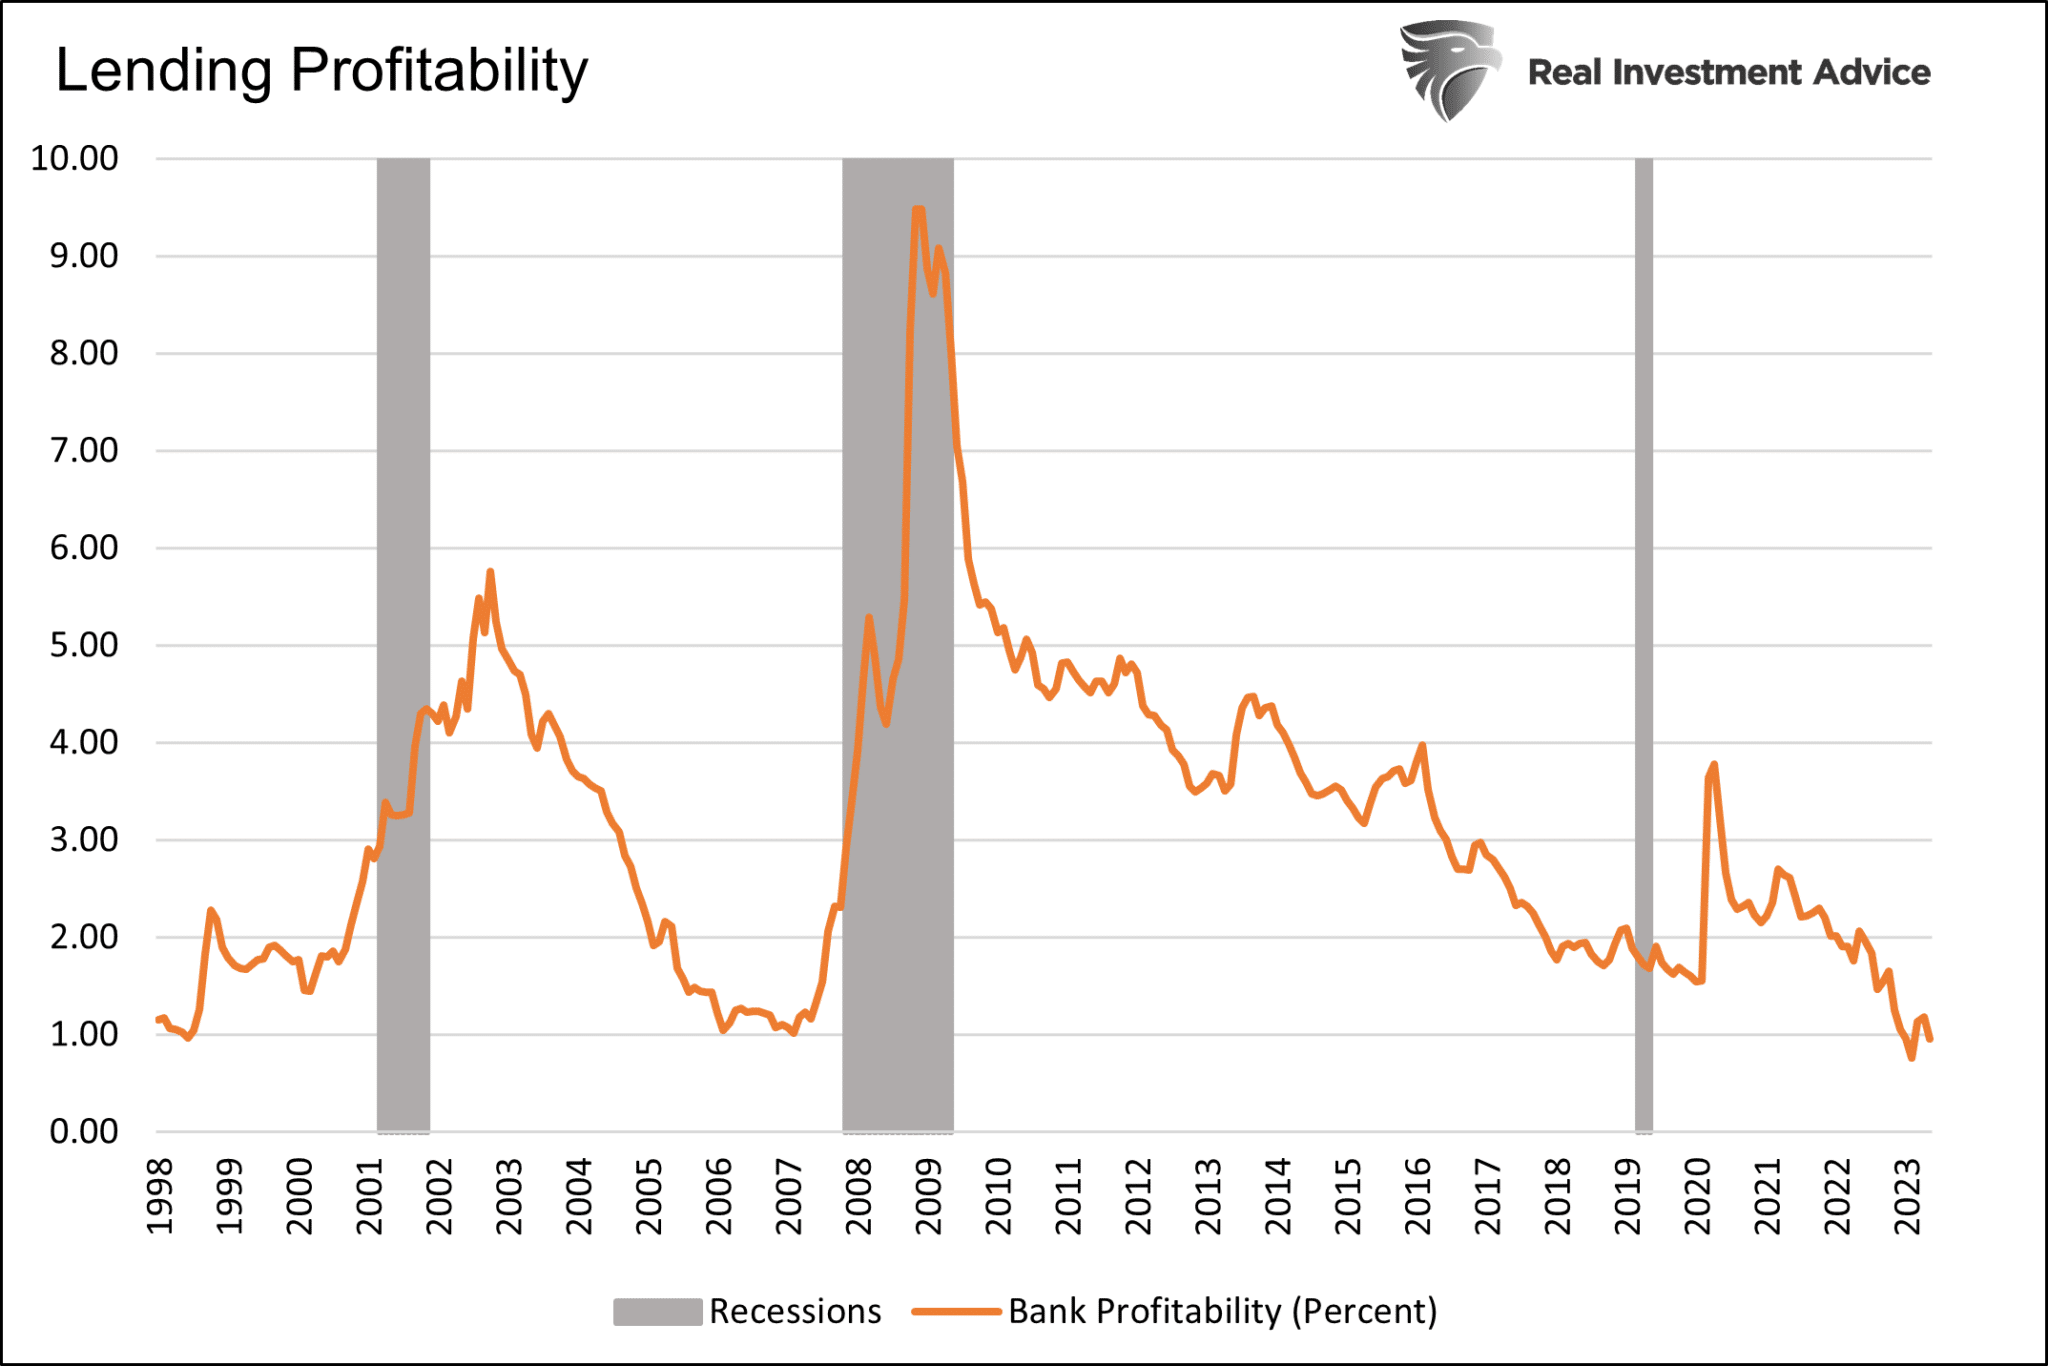
Quantifying Bank Profitability
With an understanding of the two types of lender arbitrages, we can estimate profitability based on the 2yr/10yr yield curve as a proxy for time arbitrage and BBB-rated corporate OAS spreads as a proxy for credit arbitrage. The following graph combines the two measures of probability to quantify the incentive for banks to lend.
Not surprisingly, the last three recessions occurred when this proxy measure was at or near its lowest levels. We do not have credit spread data going further back. The current reading is at or below any spread since at least 1998. Couple poor profit potential with fleeing deposits, and the banks’ ability or profit motivation to lend is minimal.
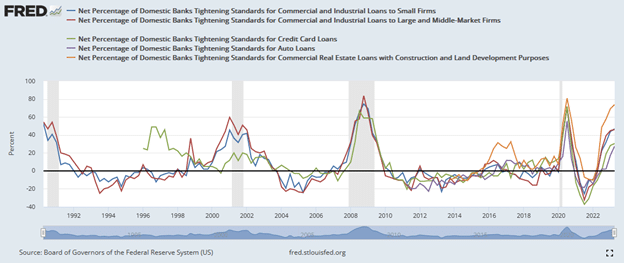
As a result, the following chart shows that the net percentage of domestic banks tightening lending standards for various loan types is approaching levels seen before or during the prior four recessions.

This Time is Unique
If debt is the bedrock of the economy, and if higher rates, inverted yield curves, and tight credit spreads are impeding lending, why is the economy seemingly strong?
Massive stimulus from the pandemic continues circulating through the economy, offsetting the adverse effects of higher interest rates.
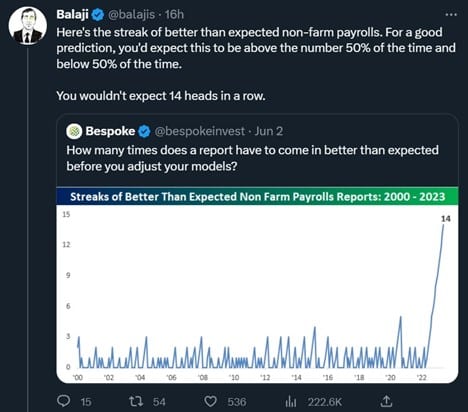
Economists underestimated how much and for how long the economy would benefit from the unprecedented fiscal and monetary stimulus. Such explains why the Fed thought inflation would be transitory and not sticky. It also explains why economists continue to underestimate the labor market. The stunning graph and tweet below show economists have underestimated the BLS payroll report for 14 consecutive months.
Summary
If the yield curves stay inverted and credit spreads remain tight, lending will likely be further curtailed. Such a poor lending environment coupled with fading stimulus benefits could mean we are staring down the barrel at another recession.
The yield curve still matters! As noted earlier, it typically takes 16 months from inversion to recession. A recession could emerge as early as Thanksgiving, based on the average.
We caution; however, the pandemic recession and recovery have been incredibly unique in their economic effects. We encourage humbleness. While a recession is likely, there are still benefits of yesterday’s stimulus coursing through the economy, which is incredibly difficult to estimate.

