
The “pain trade” is likely higher over the next few weeks. I touched on this topic in this past weekend’s “Bull Bear Report:” Not surprisingly, the “bullish” short-term outlook garnered a substantial amount of pushback. However, there is more to this outlook than just “rosie optimism.”
Let’s review what I wrote, and then we will expand on why we believe the “pain trade” is higher over the next few weeks.
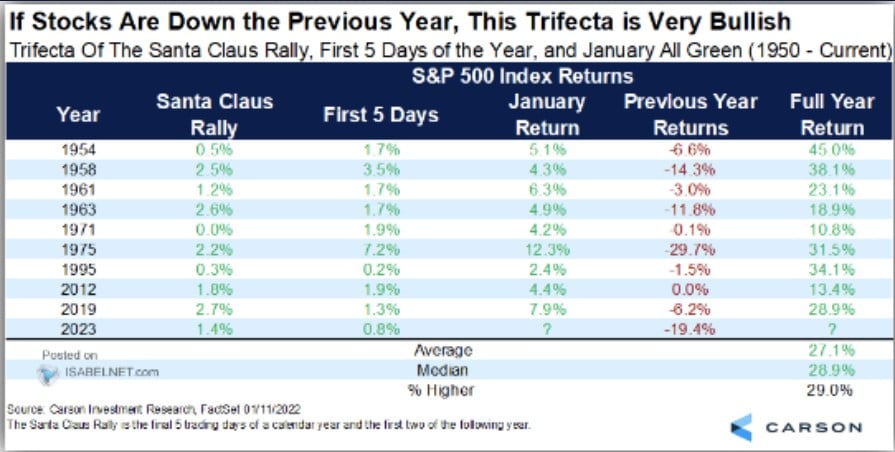
“From the bullish side of the ledger, the outlook for 2023 has statistical support for a positive outcome. After having a negative year in 2022, the markets were visited by “Santa Claus,” although very late, and the first 5-days of January turned out to be a positive return. As the table below shows, there are only a few periods in history where this has occurred, and each yielded positive returns in the following year.”
Critically, just because something has always occurred in the past does not mean it MUST happen this time. However, as investors, we must focus on statistical tendencies and invest according to the probabilities rather than the possibilities. At the moment, there are many “possibilities” bullish investors are betting on in the short-term, which have a larger potential “probability” of being wrong.
- The Fed will pivot and start cutting rates and reversing QT.
- The economy will avoid a recession.
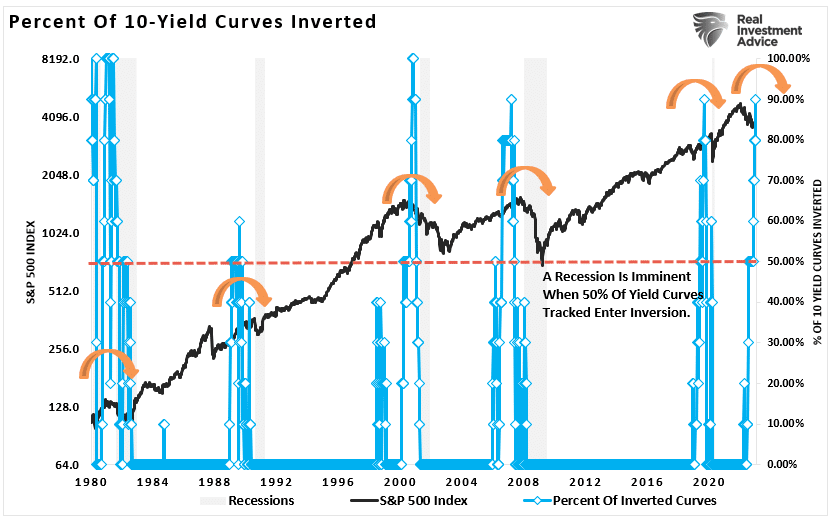
- The yield curve inversions (shown below) are wrong this time.
- The housing market will remain robust.
- Employment will continue to remain strong.
- Households will continue to spend despite inflationary pressures.
- Most importantly, corporate earnings and profits will NOT mean revert.
Notably, 90% of the 10-most economically significant yield curves are inverted. Such has never previously occurred without a recession occurring. Of course, in a recession, economic demand slows as the consumer contracts leading to a contraction in earnings. Such is problematic for the bullish view.
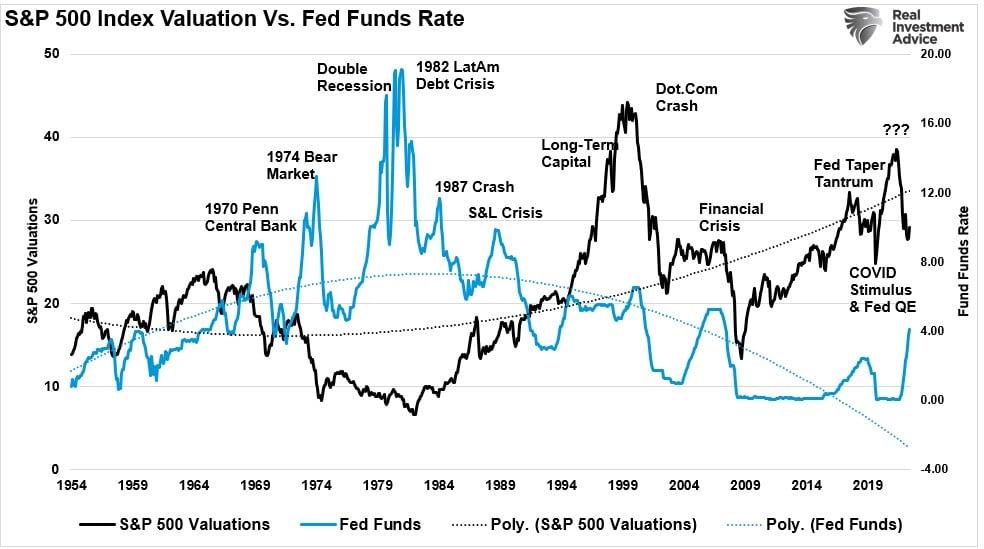
Yes, it is entirely possible this time could be different. However, the probabilities are it likely won’t be. Notably, with valuations still elevated from a historical perspective, prices still need to correct to accommodate higher rates.
However, in the short term (over the next 1-3 months), the technicals are becoming more bullish, suggesting the “pain trade” remains higher.

Bullish Technicals
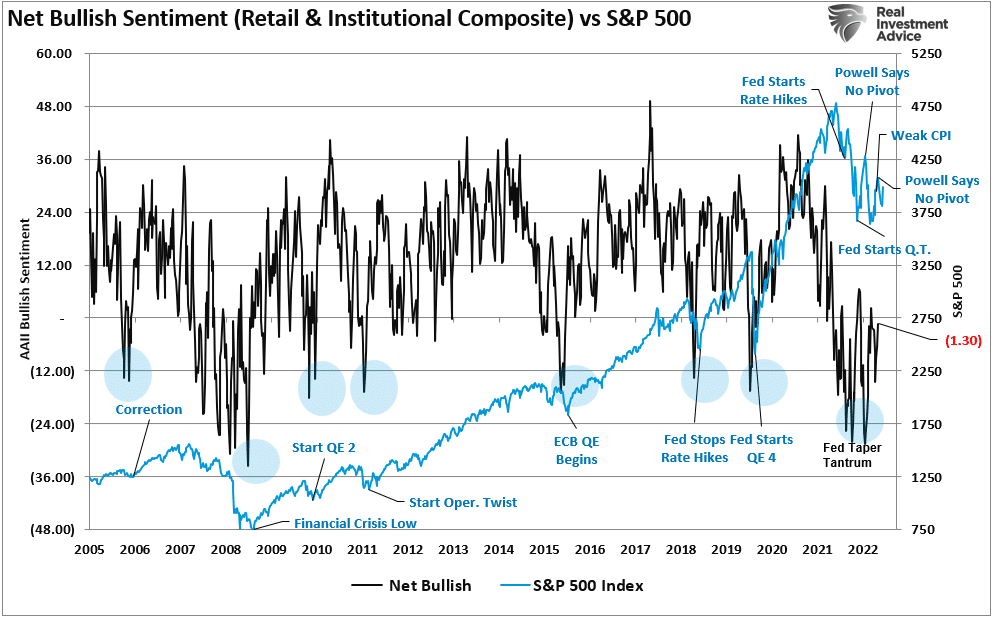
It is called the “pain trade” because it is the opposite of how investors are currently positioned. Investor sentiment, as shown in the chart of net bullish sentiment (an index of both professional and retail investors), remains historically bearish despite improvement since the October lows.
With investors bearishly positioned, including a large amount of short positioning in the market, it becomes increasingly painful to fight the tape as the market rises. As the market continues to improve, the “pain trade” forces a reversal of positioning, pushing prices higher. As prices increase, the pain rises, causing additional positioning reversals and further increasing prices. The cycle repeats until it is exhausted.
The “pain trade” is usually swift and occurs over one to three months. Once that cycle is complete, the underlying fundamental and economic trends will retake control of the markets.
Such is where we are currently.
From a purely technical perspective, a bullish pattern is developing in the S&P 500. The market has recently established a higher low and potentially formed a “right shoulder” of an “inverse head-and-shoulders” technical pattern.
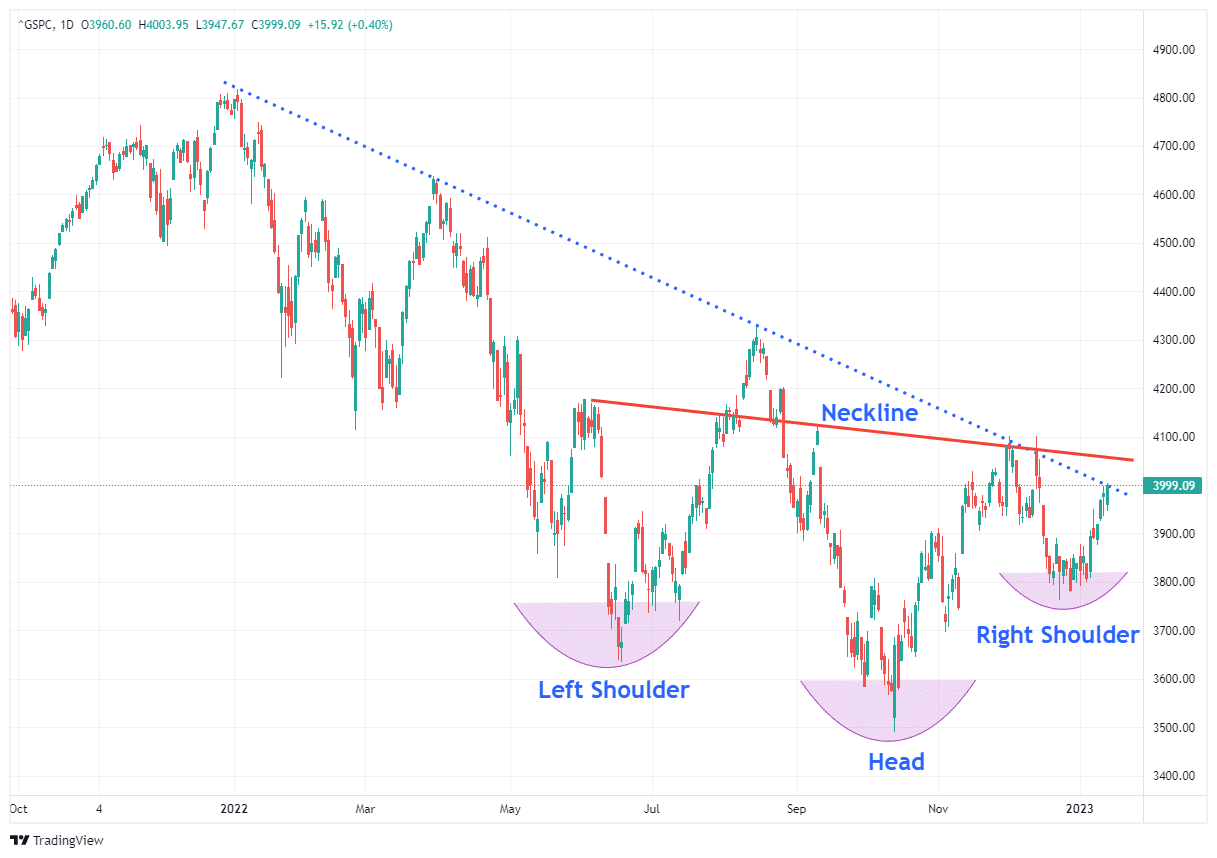
With the market approaching the downtrend line from last year’s peak, and as shown below, a higher low and tightening consolidation suggests a higher move is possible. While the market is short-term overbought, the MACD buy signal continues to suggest the “pain trade” is higher for now.

Importantly, this is just an improving technical picture for the market short-term.
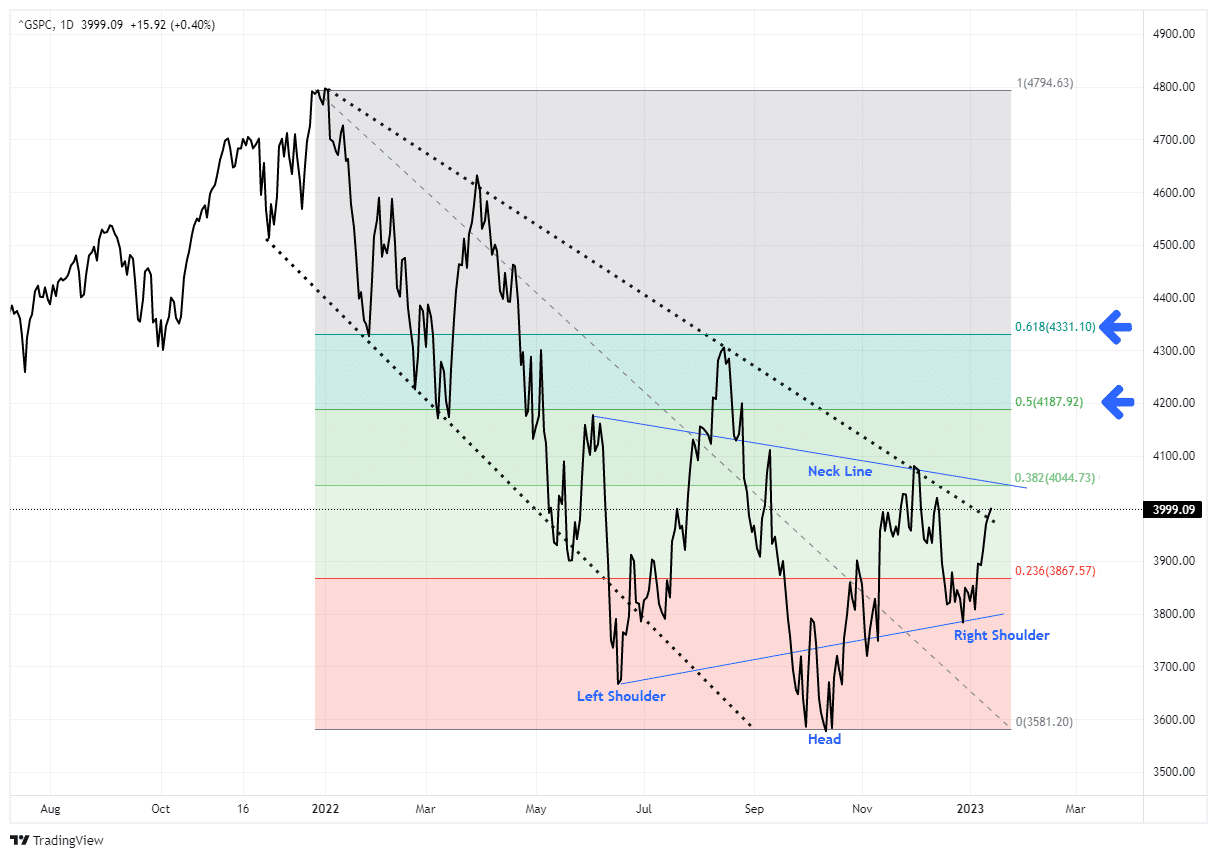
The breakouts have not happened yet, and may not.
However, given the technical improvement, a break above the downtrend and the 200-DMA will set targets between 4200 (50% retracement) and 4360 (61.8% retracement) of last year’s decline.
There are also improving internals that suggests the “pain trade” may continue for a bit longer.

Additional Support For A “Painful Trade” Higher
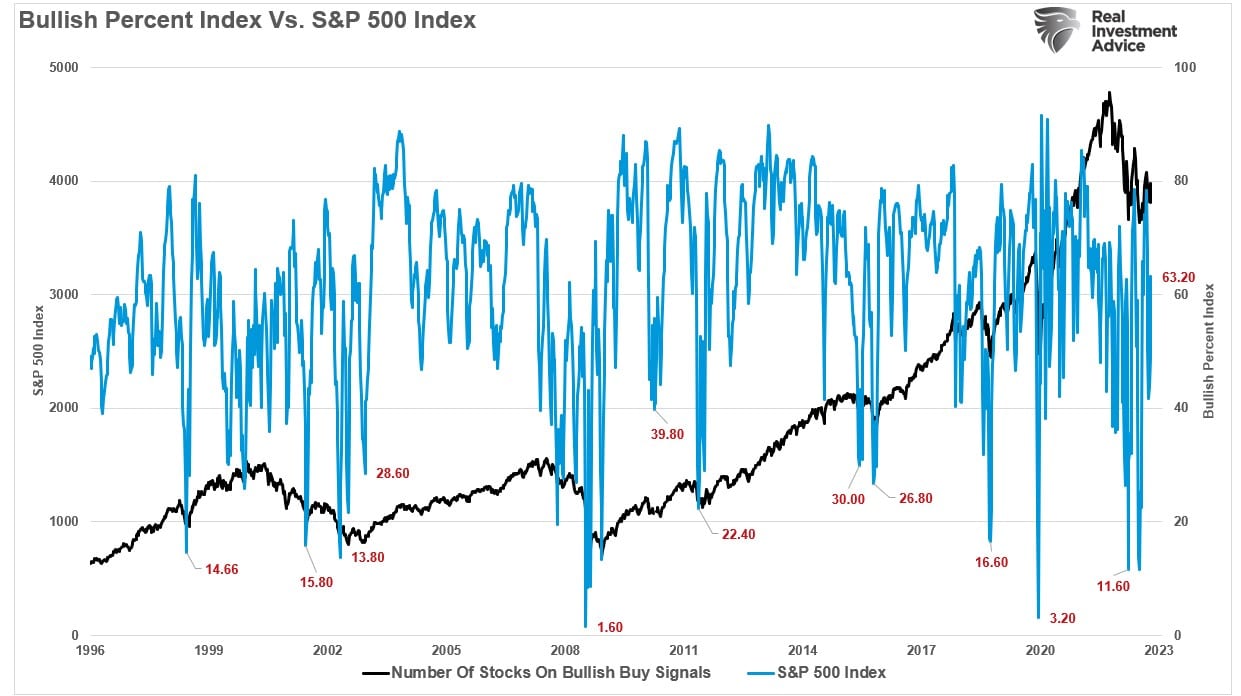
Another indicator that suggests a continued move higher is the number of stocks on “bullish” buy signals. As more stocks begin to participate in the move higher, such tends to feed upon itself. As shown, 63% of the stocks in the S&P 500 have registered bullish buy signals. This indicator has shown marked improvement since the lows of 2022.
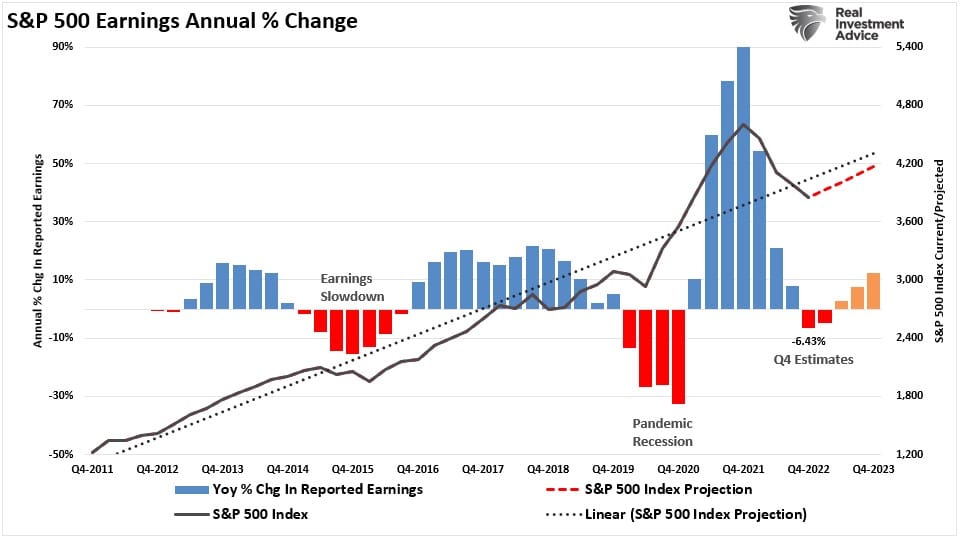
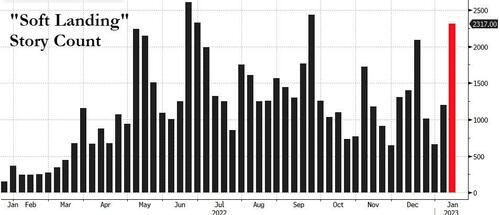
Furthermore, earnings estimates have been cut sharply over the last couple of quarters, and S&P is now expecting a -6.4% decline in earnings from Q3. As shown, as investors begin to bet on a “soft landing” scenario for the economy, expectations are this quarter will be the worst part of the earnings reversion cycle. (Those expectations will likely prove wrong.)
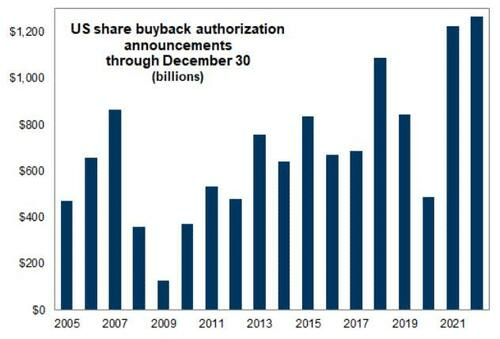
We also discussed previously one of the essential supports of the financial markets: share buybacks. To wit:
“Since 2011, 40.5% of the markets advance is attributable to corporate share buybacks. In other words, in the absence of share repurchases, the stock market would not be pushing record highs of 4600 but instead levels closer to 2700.”
In a slow-growth economic environment, there is little incentive to increase capital expenditures, make risky acquisitions, or drastically increase wages and compensation. Therefore, share repurchase announcements, which benefit corporate insiders, have surged. Such translates into roughly $4.8 billion per day of repurchases in 2023. ($1.2 Trillion divided by 250 trading days)
Adding all these things together provides the support necessary for a “pain trade” higher.
The question is, what happens next?

The Contrarian Trade
We have said before that one of our biggest concerns going into the end of 2022 was that EVERYONE was extraordinarily bearish and confident of a recession. As Bob Farrell once quipped:
“When all experts agree, something else tends to happen.”
With everyone extremely bearish and confident of a recession, such puts the markets into a position where there are few buyers and an overwhelming number of sellers. From a contrarian investment view, that is an ideal setup for a “pain trade” higher, which we have discussed as a rising possibility.
Fortunately, we are now seeing a reversal of that extremely bearish view and, as recently noted by Zerohedge:
“Everyone and their pet rabbit was waiting for a ‘dip’ to buy but there was no ‘dip’ and so everyone is now under-exposed to a FOMO-led rally as talk of a ‘soft landing’ becomes the new narrative.”
Such is precisely the point we discussed previously:
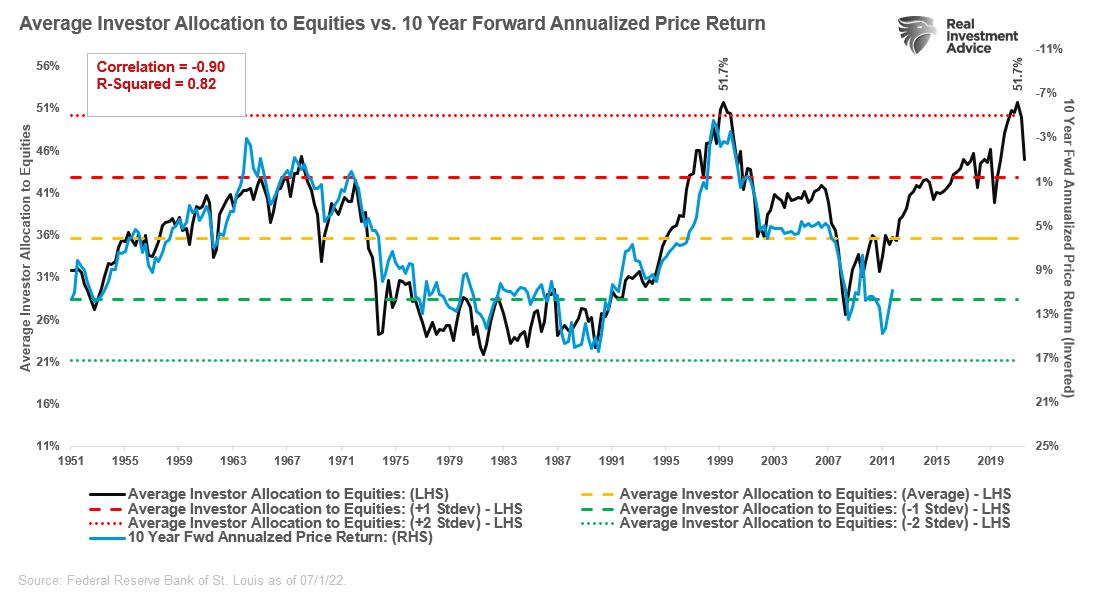
“Interestingly, seemingly terrified investors are still unwilling to sell for the ‘fear of missing out.’ It is worth noting that during previous bear markets, equity allocations fell as investors fled to cash. Such has not been the case in 2022.
Investors seem more afraid of missing the bottom should the Federal Reserve suddenly reverse course on monetary policy. Much like Pavlov’s dogs, after years of being trained to ‘buy the dip,’ investors are awaiting the Fed to ‘ring the bell.’“
While there is support for the current “pain trade,” the rally still has many risks.
- The Fed is still tightening its policy and reducing its balance sheet.
- The rate hikes of last year have yet to impact the economy fully.
- Economic growth is slowing.
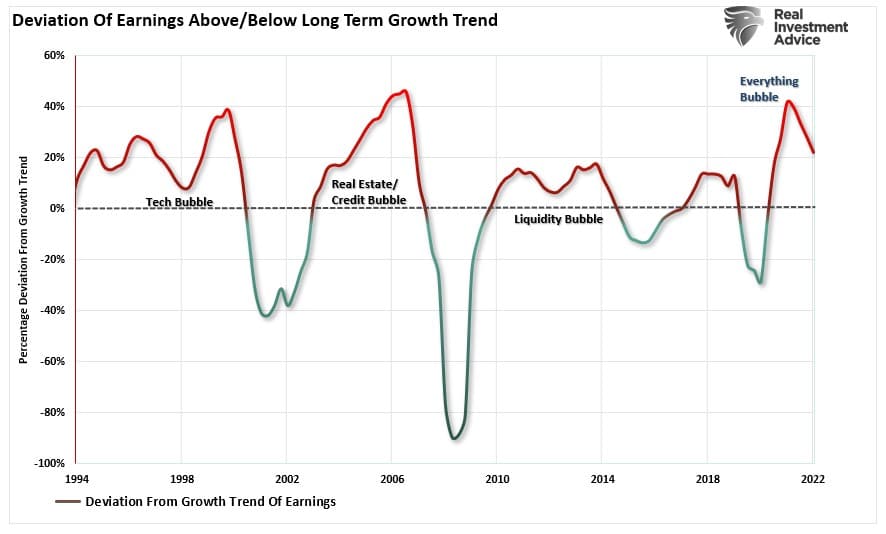
- Earnings and profit margins are still historically deviated from long-term growth trends.
- The massive supports of fiscal stimulus are no longer available.
Such is especially the case as we head into earnings season and the next Fed meeting. Therefore, it is important to remain cautious until the markets declare themselves.
We remain overweight in cash, and our bond duration remains short of our benchmark index. However, we will adjust our holdings accordingly if these technical patterns mature.
While the “pain trade” is higher for now, the challenge we have with the market “Fighting the Fed” is that historically such has not worked out well.

