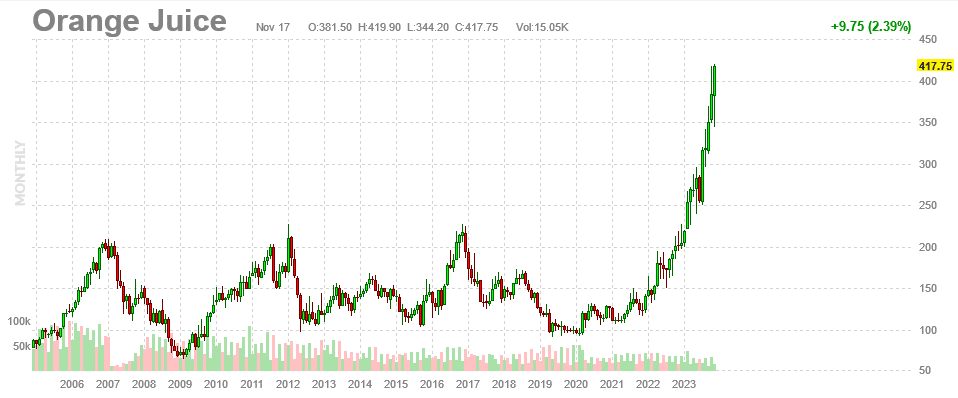
The squeeze is on in the orange juice futures market. The price of orange juice tends to be stable, typically hovering between $100-$150 per 15,000 pounds of frozen orange juice concentrate, as shown below. On occasion, the price spikes to $200 or higher during the winter months as irregular cold snaps harm the crops. Over the past two years, orange juice prices have seen an irregularly consistent increase that is not letting up as prior short-term price spurts have. With orange juice futures trading at three times their average of the last 15+ years, let’s dive in and see why orange juice prices are surging.
First, Florida, the largest orange grower in the U.S., Brazil, and Mexico have all been hit with a disease called citrus greening that is reducing crops. It is not expected to ease the supply problem anytime soon. Per Reuters: “Ibiapaba Netto, executive director at CitrusBR, the association representing Brazilian juice producers, said that a reversal of the current tight supply situation would take time, and is not certain to happen.” The second reason is the weather. Hurricanes hitting Florida over the last few years have reduced orange juice crops. Lastly, the population shift from the northeast and west coast to Florida creates a need for more housing. To help meet rising demand, construction firms are buying land from orange juice farmers.
What To Watch Today
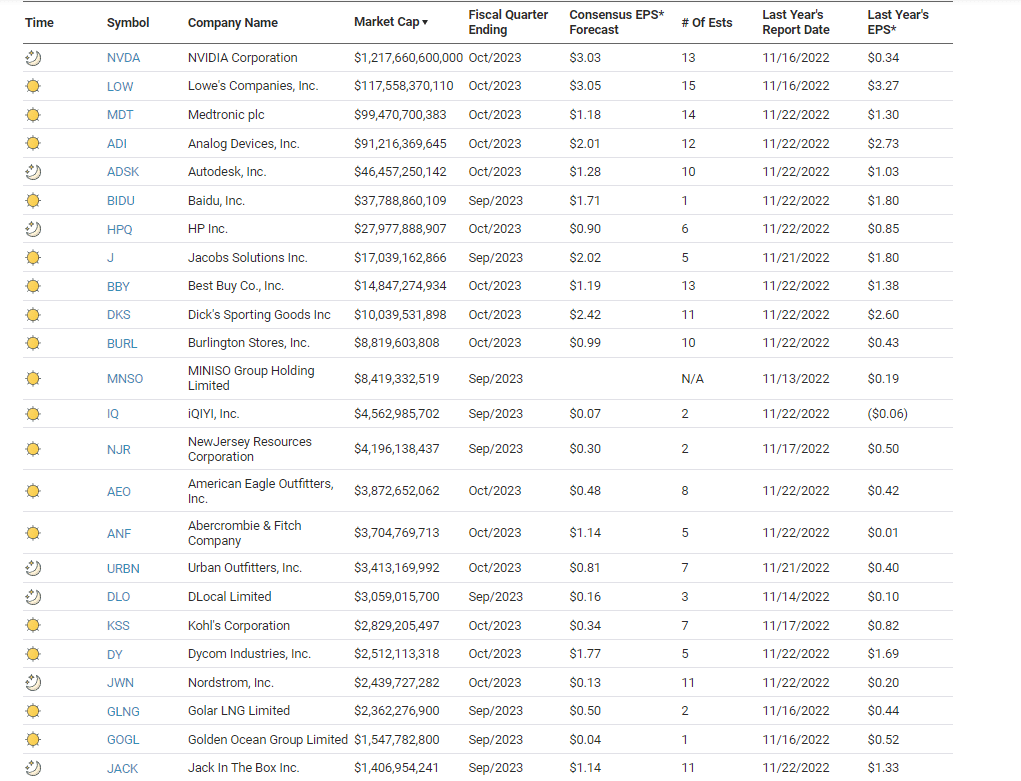
Earnings
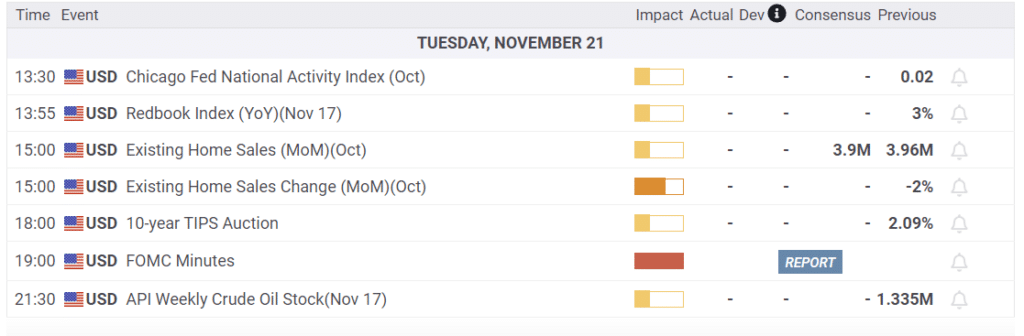
Economy
Market Trading Update
“We must remember that market advances can only go so far before an eventual correction occurs. My best guess is that if the markets are to reach all-time highs this year, we will likely have a correction to reset some of the more extreme overbought conditions, as shown below. Any pullback to the 50-DMA is likely a good entry point to increase exposure on a better risk/reward basis.” – Trading An Unstoppable Bull Market
That was written on July 29th as the market continued to march higher, seemingly with nothing to stop it. Then, the market declined by 10% over the next three months. Once again, we seem to be witnessing an “unstoppable bull market,” which is pushing more overbought extremes, yet nothing seems able to stop it.
Currently, we are in a “bull market” advance. As such, we want to maintain our exposure to equity risk. However, this does not mean we should ignore what the market tells us and let the ebbs and flows wash over us. Eventually, another “ebb” will come, and we will want to reduce risk accordingly. However, that is not today.
“In a bull market, you can be either long or neutral. In a bear market, you can only be neutral or short.” – Dennis Gartman
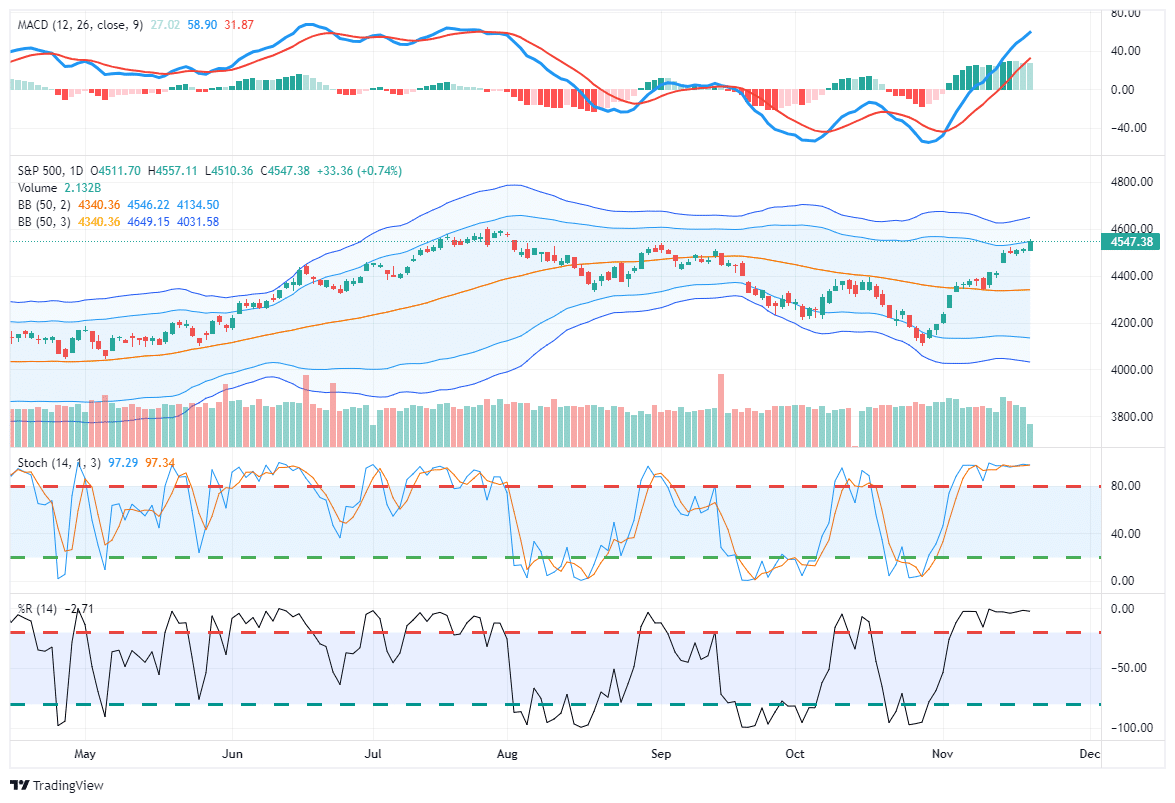
While the market could certainly pull back to the lower of the “Bollinger bands,” corrections will likely remain confined to the 50-dma. As such, we will want to use those opportunities to trade portfolios into higher levels of equity exposure. With the market more overbought and extended currently, we want to remain cautious about committing our cash reverses to the broad market more aggressively.
“Willingness and ability to hold funds uninvested while awaiting real opportunities is a key to success in the battle for investment survival.” – Gerald Loeb
With both technical and sentiment readings suggesting the short-term market risks are elevated, it is likely wise that investors use the current speculative frenzy to rebalance portfolio risks accordingly.
- Tighten up stop-loss levels to current support levels for each position.
- Hedge portfolios against more significant market declines.
- Take profits in positions that have been big winners.
- Sell laggards and losers (Tax Loss Harvesting)
- Raise cash and rebalance portfolios to target weightings.
For now, the bullish trend continues but is getting very overbought. While we have increased our equity exposure over the last month, we remain underweight overall. We will rebalance our weightings to target levels when the market gives us the opportunity.

Stocks And Bond Correlation
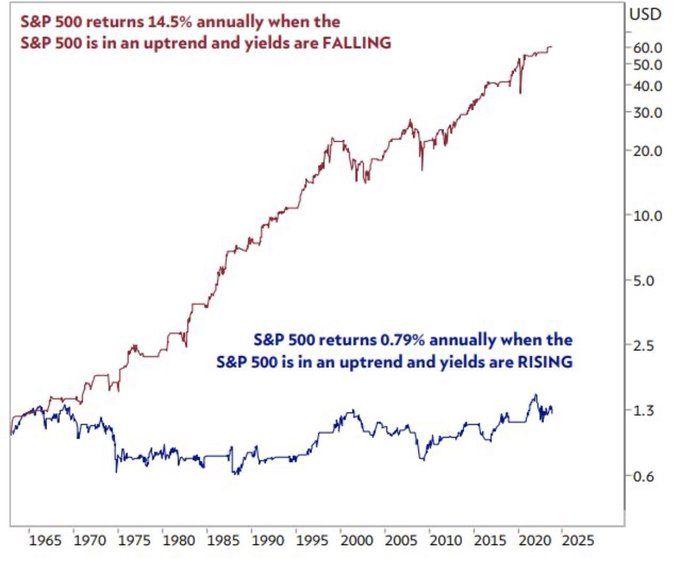
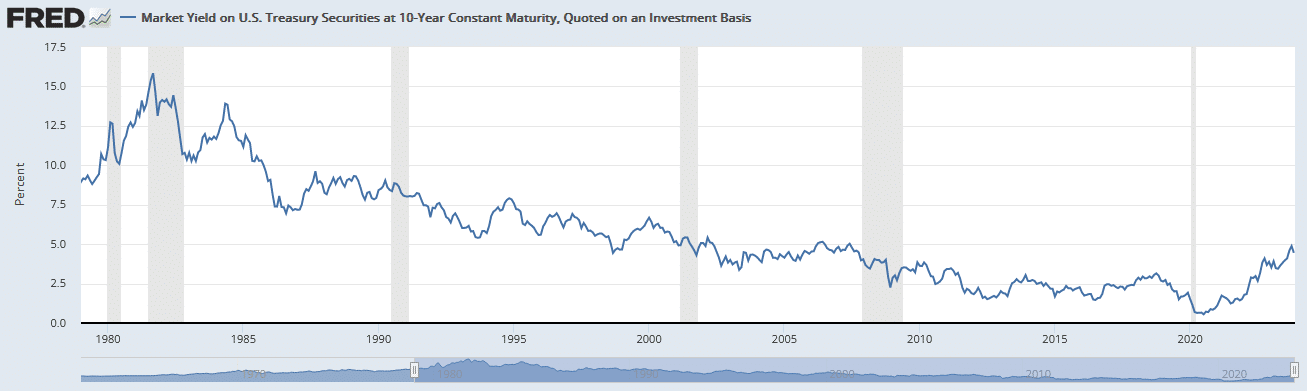
The graph below, courtesy of Jim Bianco, helps explain why stock prices and bond yields have been moving in opposite directions recently. Our economy is heavily driven by debt. Therefore, the cost of debt, i.e., interest rates, plays a prominent role in the usage of debt, which again is an important driver of economic activity. With interest rates at 10+ year highs, interest expenses are weighing on corporate bottom lines, and high-cost debt makes investing for future profits more costly. Ergo, stock prices, predicated on future cash flows, are taking notice of the bond market. As Bianco’s graph shows, stocks barely eke out gains when yields are rising. Conversely, the S&P 500 returns on average 14.5% when yields are low or falling. As shown in the second graph, yields have been declining a large majority of the time since 1980.
The Conference Board’s LEI Warns of Recession
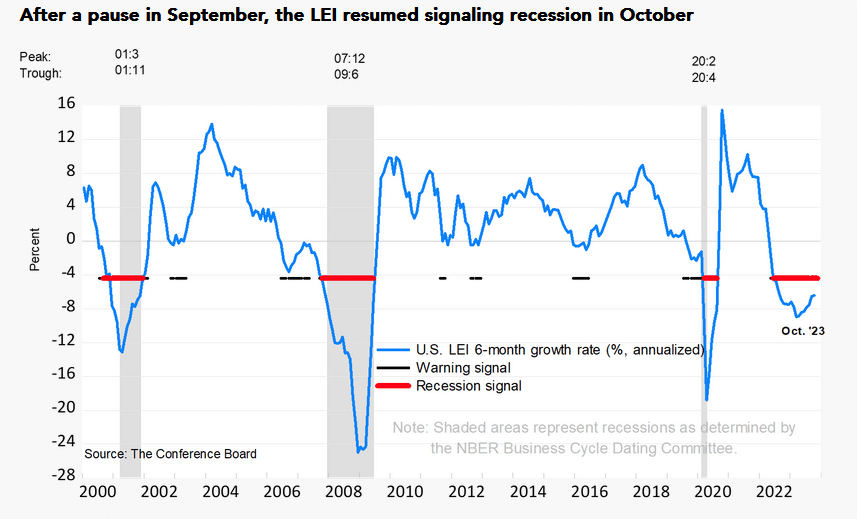
The latest leading economic indicators (LEI) report from the Conference Board warns of a coming recession. The LEI fell by 0.8% in October to 103.9. That follows a 0.7% decline in September. The Board uses a 3-D rule to determine whether to warn of a recession. Per their rule:
The 3D’s rule provides signals of impending recessions 1) when the diffusion index falls below the threshold of 50 (denoted by the black dotted line in the chart), and simultaneously 2) when the decline in the index over the most recent six months falls below the threshold of -4.4 percent. The red dotted line is drawn at the threshold value (measured by the median, -4.4 percent) on the months when both criteria are met simultaneously. Thus, the red dots signal a recession.
The table below also from the report shows that most components of their index contributed negatively toward the latest reading.
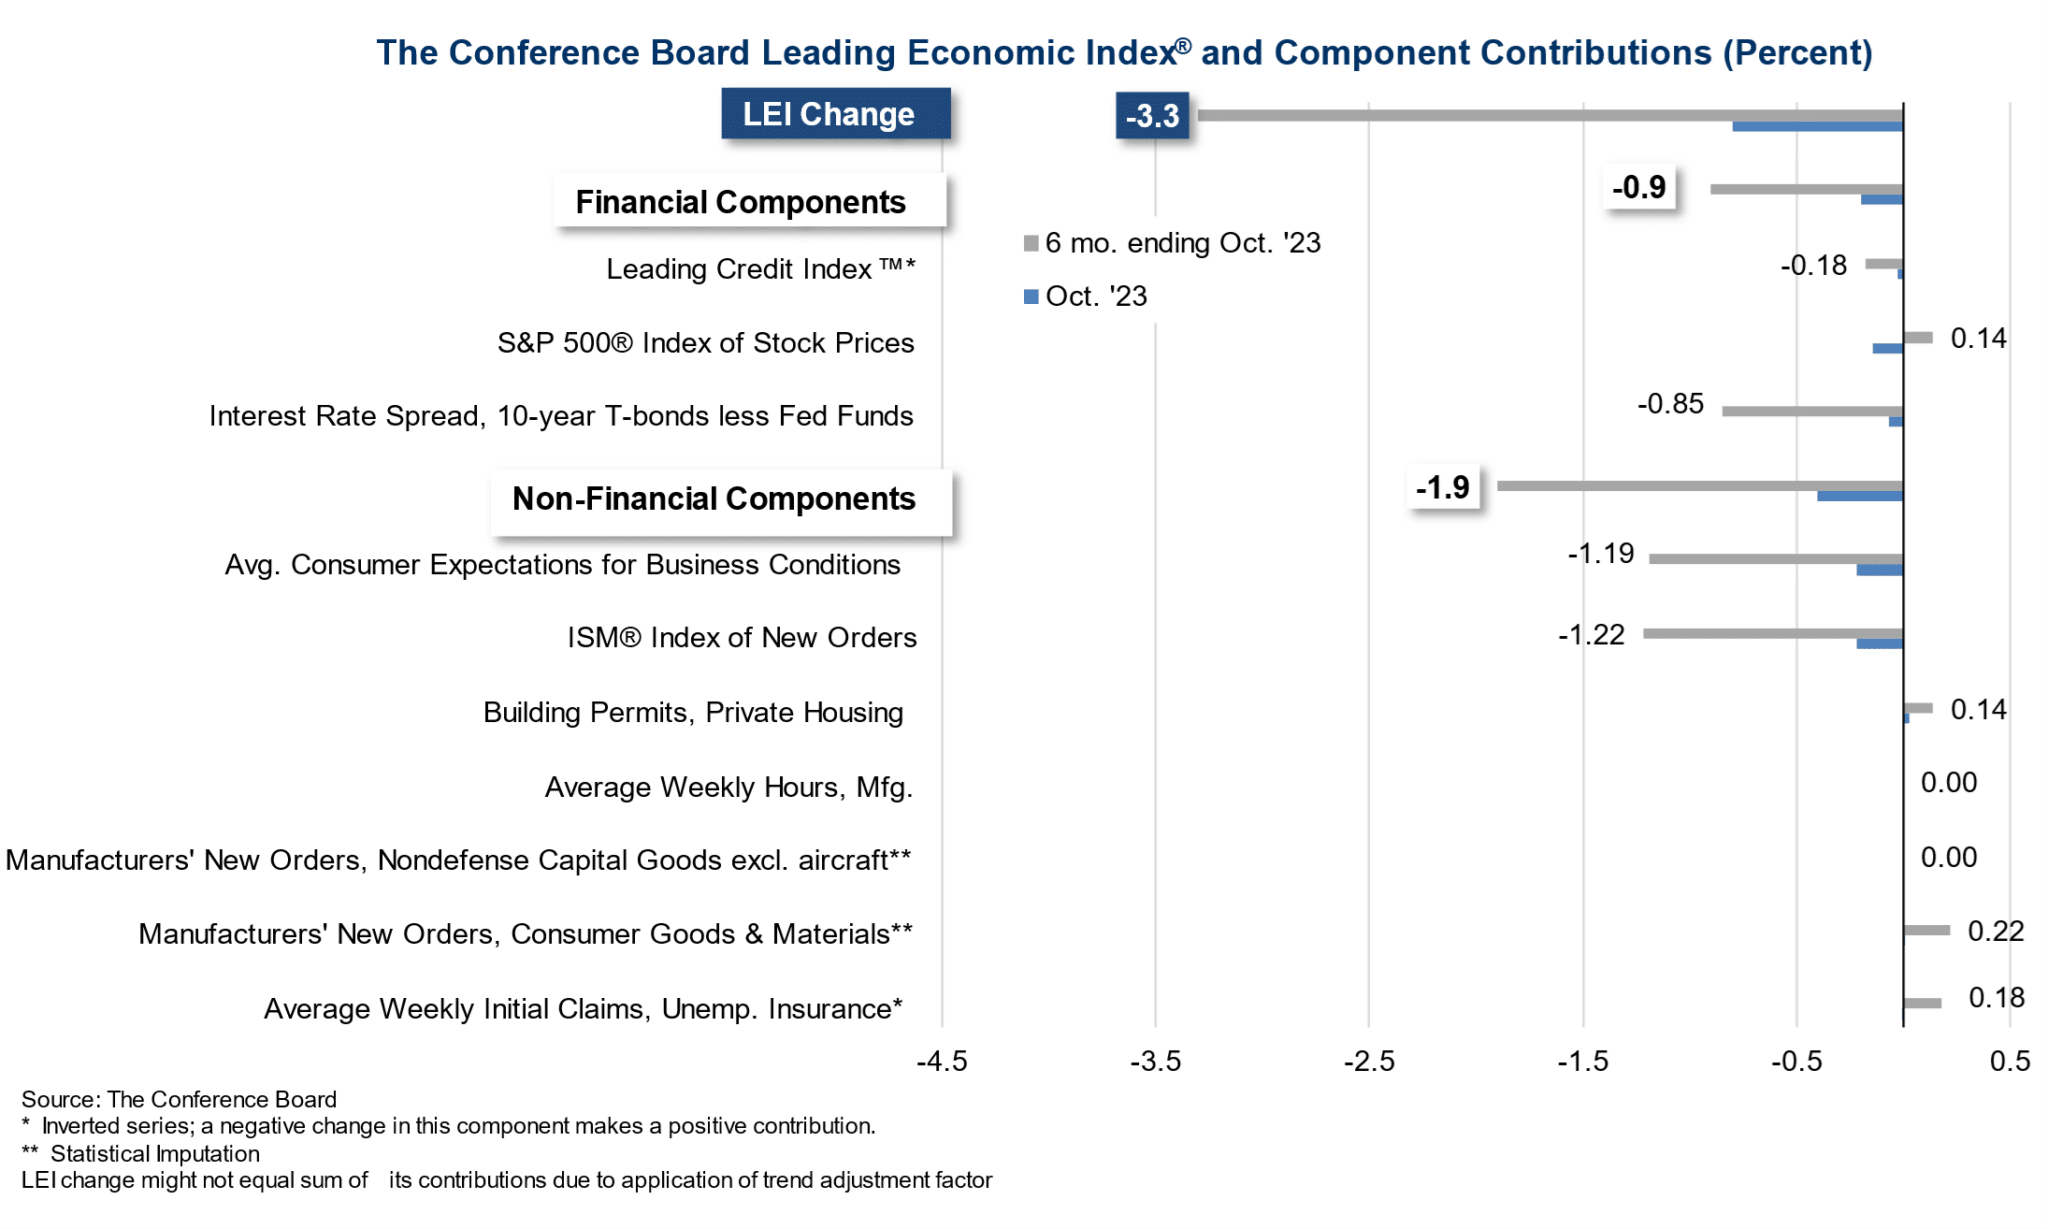
“Among the leading indicators, deteriorating consumers’ expectations for business conditions, lower ISM® Index of New Orders, falling equities, and tighter credit conditions drove the index’s most recent decline. After a pause in September, the LEI resumed signaling recession in the near term. The Conference Board expects elevated inflation, high interest rates, and contracting consumer spending—due to depleting pandemic saving and mandatory student loan repayments—to tip the US economy into a very short recession. We forecast that real GDP will expand by just 0.8 percent in 2024.”
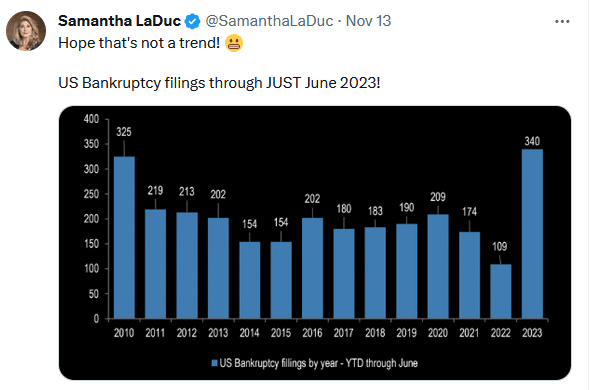
Tweet of the Day
Please subscribe to the daily commentary to receive these updates every morning before the opening bell.
If you found this blog useful, please send it to someone else, share it on social media, or contact us to set up a meeting.
Also Read