In this issue of “The Markets, May Be Starting To Worry About Rates.”
- Market Review And Update
- Are Rates About To Cause A Problem
- Risk Appetite Is Extreme
- Portfolio Positioning
- #MacroView: Why Stimulus Doesn’t Lead To Organic Growth
- Sector & Market Analysis
- 401k Plan Manager
Follow Us On: Twitter, Facebook, Linked-In, Sound Cloud, Seeking Alpha
RIA Advisors Can Now Manage Your 401k Plan
Too many choices? Unsure of what funds to select? Need a strategy to protect your retirement plan from a market downturn?
RIA Advisors can now manage your 401k plan for you. It’s quick, simple, and transparent. In just a few minutes, we can get you in the “right lane” for retirement.

Catch Up On What You Missed Last Week

Quick Note
This past week was interesting.
I live in a suburb of Houston, Texas, and was one of the 2.6 million that lost power and water for several days. It was an exciting adventure in survival as our house’s temperature dropped below freezing and ice formed on our emergency water supply in the bathtub.
However, between sitting in cars to charge the laptop and phone batteries and warm up a bit to figuring out how to make coffee on a gas stove, everyone made it through. The lesson we all relearned during this event is not to take for granted even the smallest luxuries in life or each other.
This week’s newsletter will be abbreviated as I still don’t have access to everything just yet. However, by next week, we should be back to normal.
Market Review & Update
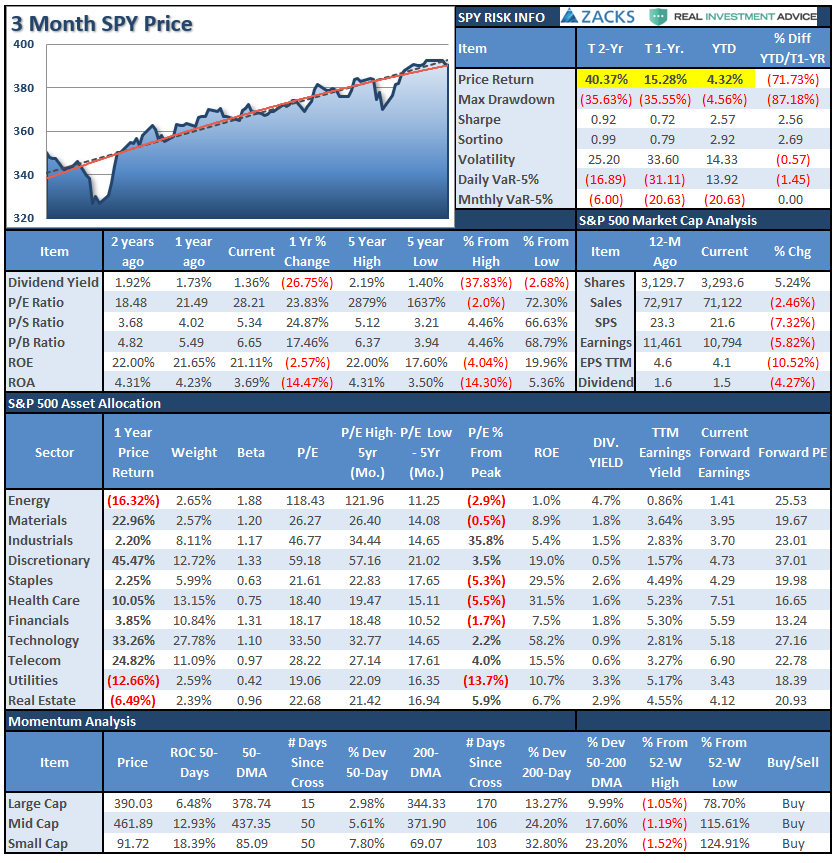
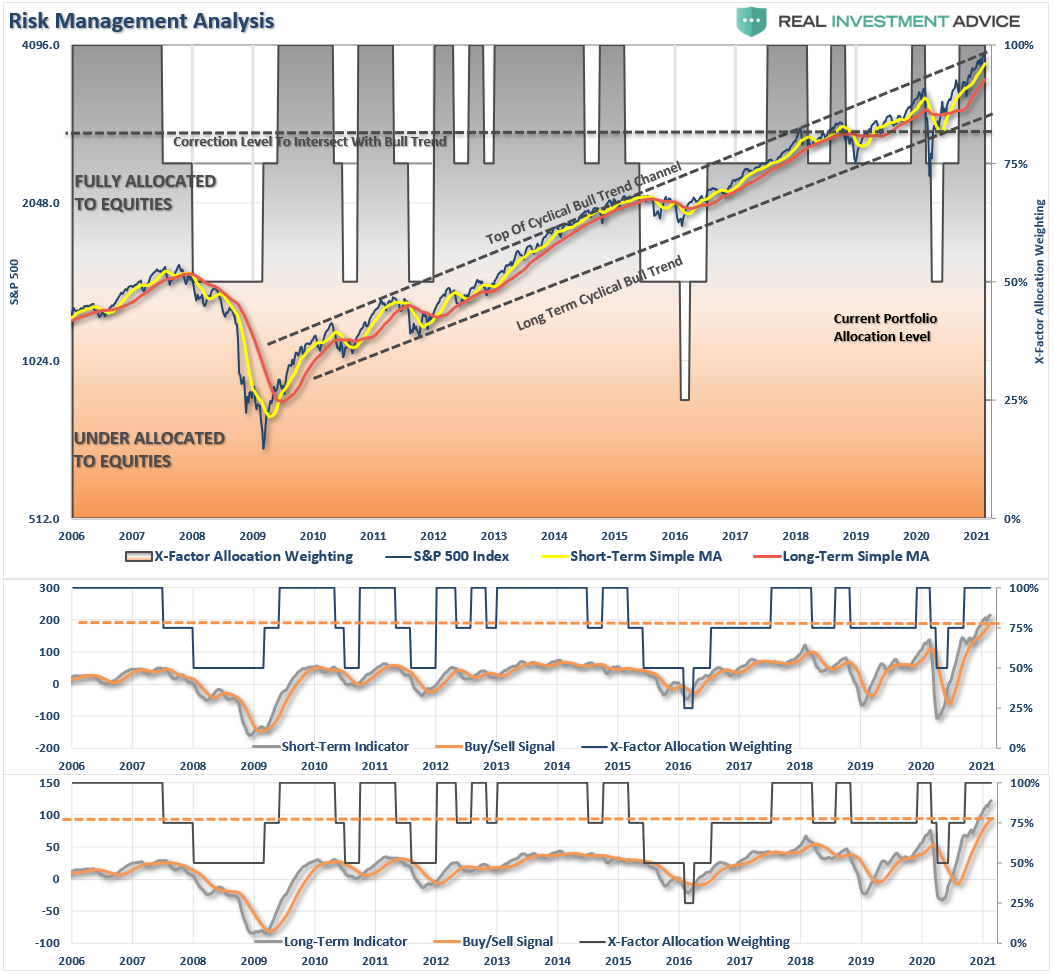
I previously stated that with the market already trading 2-standard deviations above the 50-dma, further upside could be limited. Such was the case as markets struggled all week to hold gains in a very narrow range. (Horizontal dashed lines.)
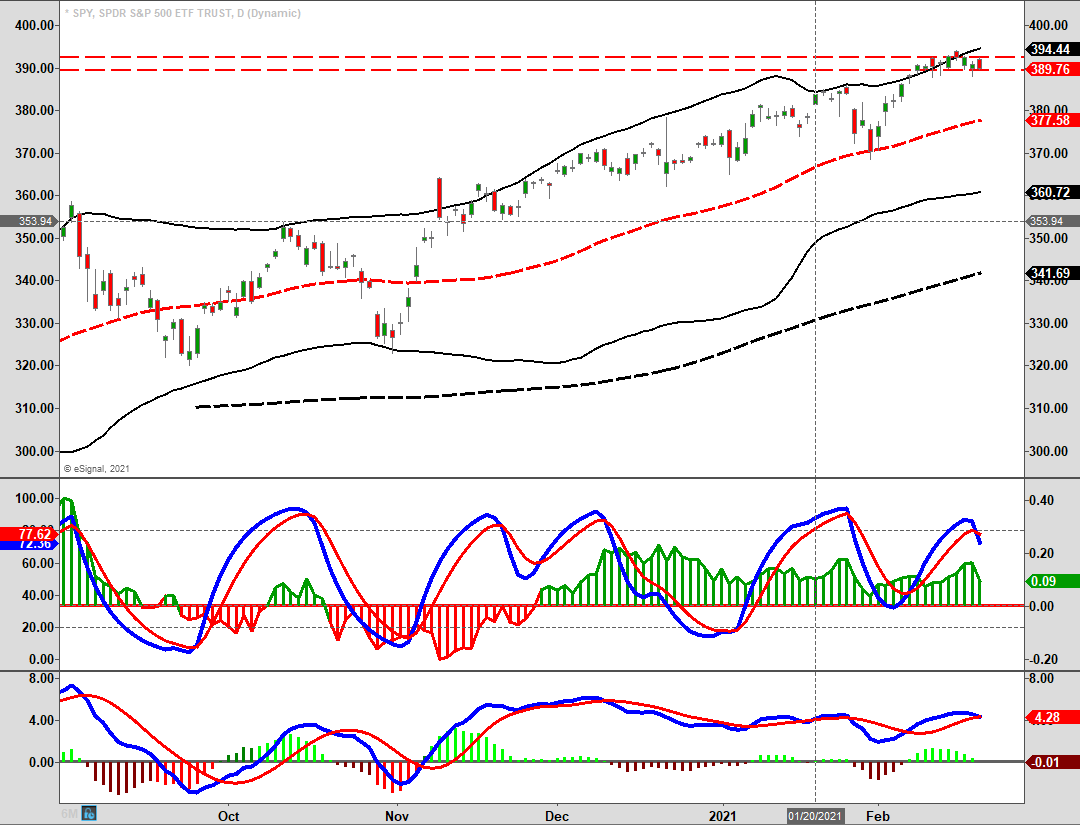
Currently, the money flow signals remain positive, but “sell signals” did trigger as of the close on Friday. While the money flow itself remains strongly positive, the “sell signals” continue to suggest downward pressure on prices currently. However, given the more extreme overbought and bullish conditions, there is a risk of a deeper correction over the next few weeks.
Importantly, as discussed last week, while we will certainly warn you of when our indicators turn lower, the problem remains two-fold:
- The indicators don’t distinguish between a 5% correction and a 20% drawdown; and,
- Secondly, the corrections often occur so quickly you don’t have much time to decide just how defensive you need to be.
In other words, it is often advantageous to pare risk by “leaving the party a little early.”

Are Rates About To Cause A Problem
The question we need to answer is why the market has been struggling as of late. As we touched on last week, investors may be starting to factor in the twin threats of higher inflation and interest rates. To wit:
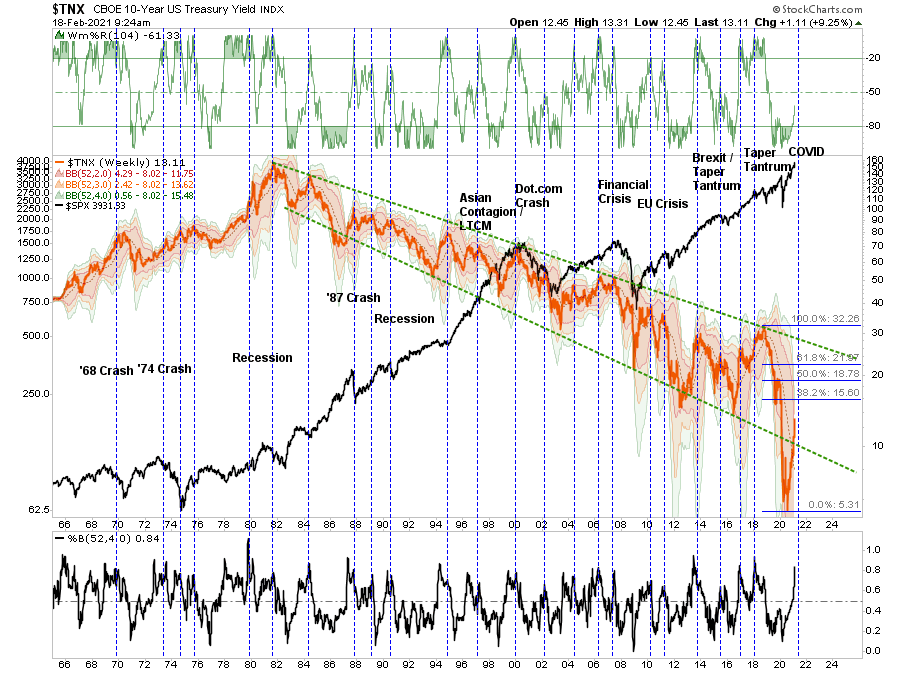
“With an economy pushing $85 trillion in debt, the entire premise of the ‘consumption function,’ as well as ‘valuation justification’ for the stock market, is based on low-interest rates. However, that is rapidly ending as the rise in rates is now approaching a “danger zone” for the markets.”
As discussed in our #Macroview report yesterday, interest rates are rapidly approaching the 1.5% to 2.0% barrier, where higher payments will collide with disposable income. Historically, such has not ended well for markets.
The rise in interest rates is much more problematic than most suspect. Higher interest payments reduce capital expenditures, threatens refinancing, and spreads through the economy like a virus.
As noted by Laura Cooper yesterday:
“The writing may soon be on the wall for the buy-everything-but-bonds rally, with focus on inflation fears and subsequent Fed tightening. Yet it’s rising real yields that might prove to be the ultimate stumbling block for the risk rally.”
Little Margin For Error
Higher rates also quickly undermine one of the critical “bullish supports” of the last decade:
“In a heavily indebted economy, increases in rates are problematic for markets whose valuation premise relies on low rates.”
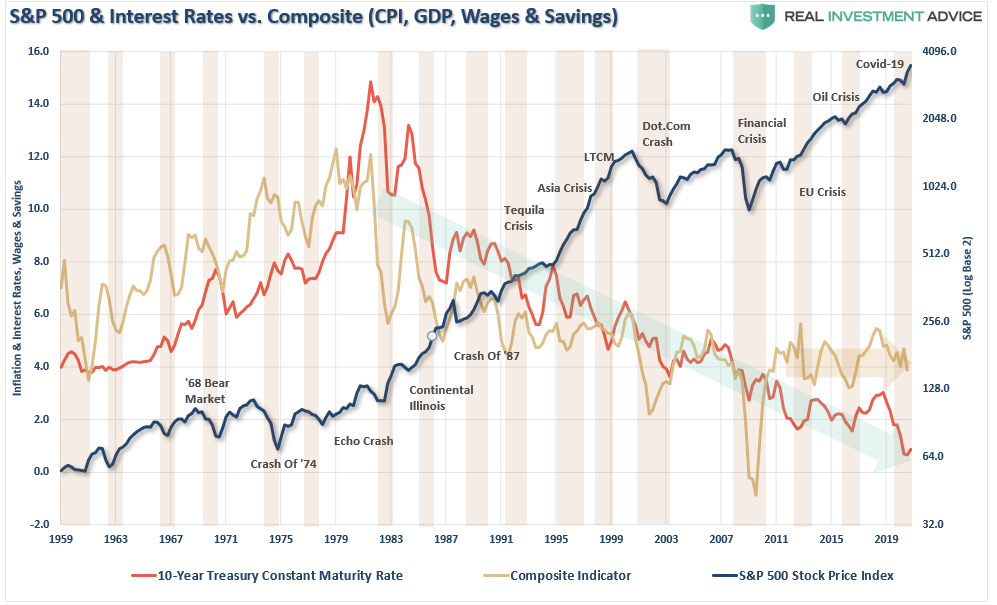
“Each time rates have ‘spiked’ in the past; it has generally preceded a mild to a severe market correction.
As is often stated, ‘a crisis happens slowly, then all at once.’
So, how did the Federal Reserve get themselves into this trap?
‘Slowly, and then all at once.’”
When combined with higher inflationary pressures due to stimulus injections, such becomes problematic. Higher borrowing costs and inflation compresses corporate profit margins and reduces real consumption as wages fail to increase commensurately.
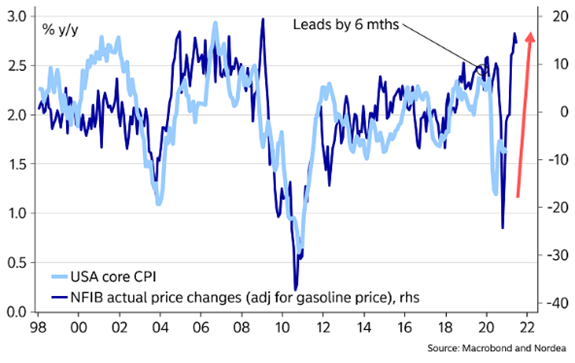
While the Fed continues to suggest they will let “inflation run hot” for a while, the problem is that the real economy won’t. The impacts of higher payments and costs will derail consumptive spending very quickly, given the real economy is still massively dependent on “life support.”
Equally problematic is when the stock market suddenly realizes that higher rates have derailed a primary thesis of overpaying for value.

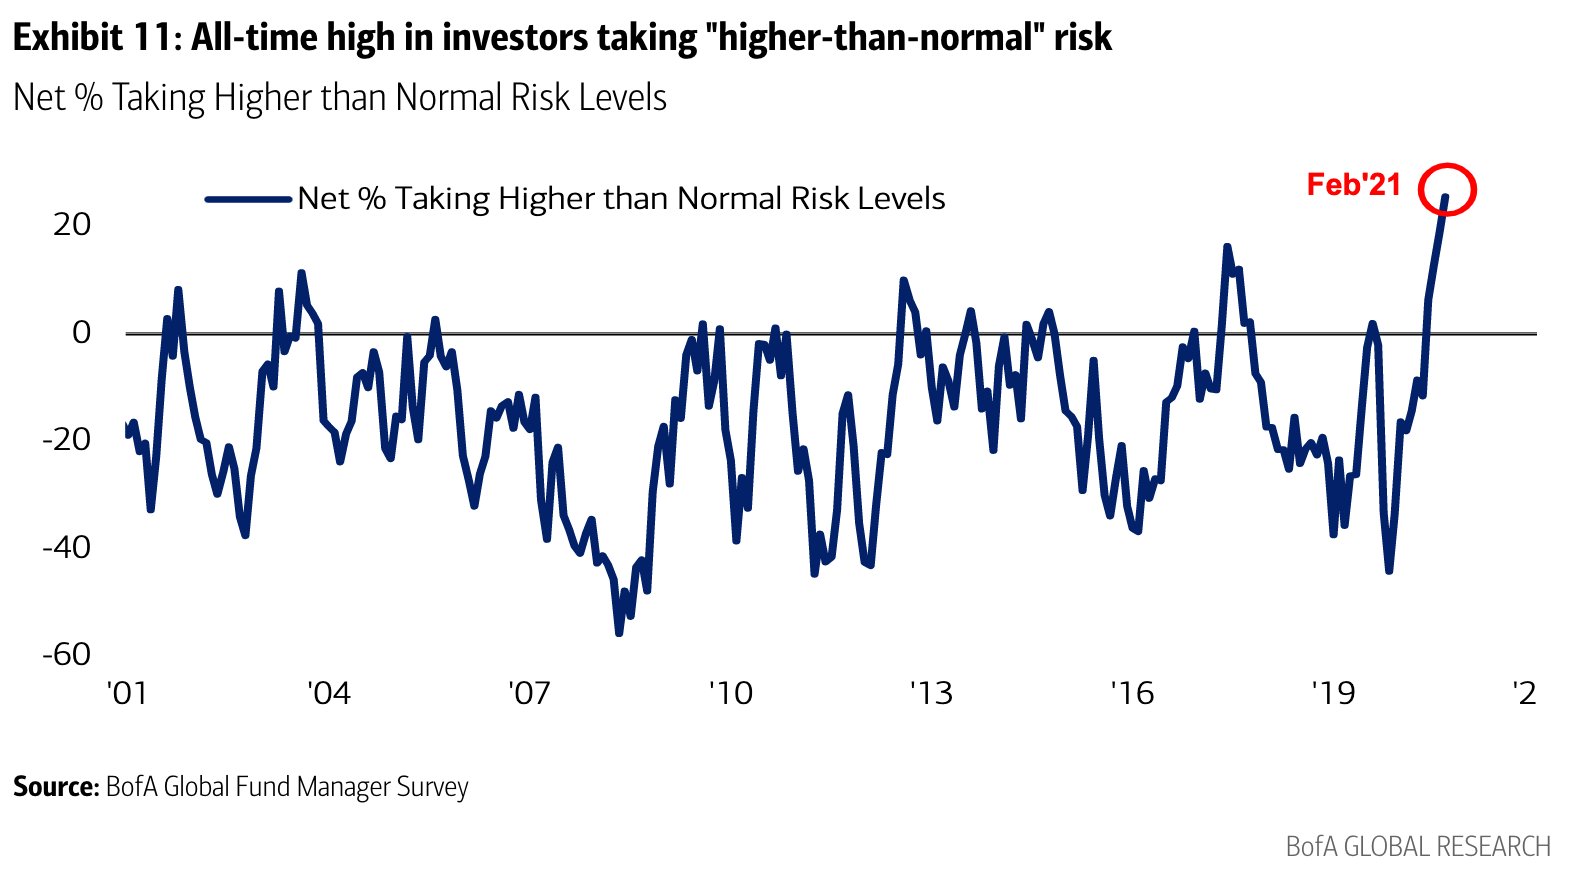
Risk Appetite Is Extreme
It seems as if with each passing week, we have continued to point out levels of exuberance either rarely or never, seen historically. This past week continues to see increasing levels of exuberance on many fronts.
One that I will discuss more in Monday’s blog is the fact that “no one is bearish.” Of course, that may be reason enough to be concerned.
As Bob Farrell once noted:
“When all experts agree, something else tends to happen.”
We must consider two issues.
The first is that current levels of speculation have increased the risk of a more extreme reversion. As physics’s fundamental laws suggest, a rubber-band stretched to its limit will experience a move of equal intensity in the opposite direction.
The second problem is the demise of the T.I.N.A. (There Is No Alternative) trade.
“The problem today is that the relationship between the 10 year US note yield and the S&P dividend yield has reversed. With risk-free rates of return rising, the 10 year US note now does provide an alternative – especially with the S&P dividend yield plummeting.” – Doug Kass
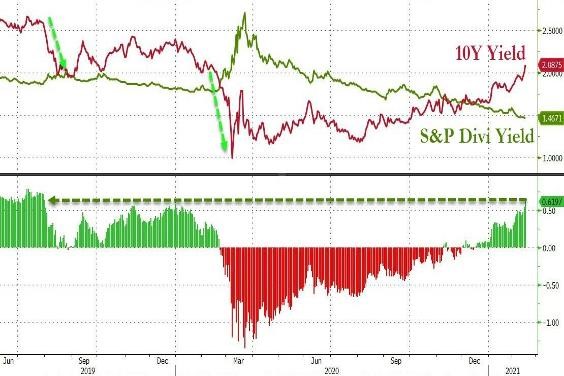
When “risk” becomes realized, there is now a “safe” alternative.
The shift will likely not be subtle.

Portfolio Update
From a portfolio management perspective, we have started to raise cash and reduce our equity risk somewhat. Our bond portfolio now has a very short duration, and high cash levels are acting as an early hedge against volatility.
We are not getting overly aggressive on hedging risk just yet as the money flow indicators, as shown above, remain supportive. However, that signal is beginning to get more extended, and the market is starting to show early signs of deterioration.
As I stated in the open, sometimes we need to act in advance of the correction. Such is particularly the case when there is excess speculation that can lead to very sharp single-day declines that make it extremely difficult to take appropriate actions amid a “panic-driven” sell-off.
Conclusion
If you missed this week’s post on Howard Marks on “speculative manias,” it is a good analysis of what we are dealing with currently.
Importantly, it is essential to remember that portfolio management is not about ALWAYS being right. It is about consistently getting “on base” that wins the game. There isn’t a strategy, discipline, or style that will work 100% of the time.
“The biggest investing errors come not from factors that are informational or analytical, but from those that are psychological.” – Howard Marks
The biggest driver of long-term investment returns is the minimization of psychological investment mistakes. As an investor, it is merely your job to step away from your “emotions” for a moment. Look objectively at the market around you. Is it currently dominated by “greed” or “fear?” Your long-term returns will depend not only on how you answer that question but how you manage the inherent risk.
Whether it is Paul Tudor Jones or any other great investor throughout history, they all had one core philosophy in common; the management of investing’s inherent risk.
As many of those found out during the Gamestop saga:
“If you run out of chips, you are out of the game.”

The MacroView

If you need help or have questions, we are always glad to help. Just email me.
See You Next Week
By Lance Roberts, CIO
Market & Sector Analysis
Analysis & Stock Screens Exclusively For RIAPro Members
S&P 500 Tear Sheet
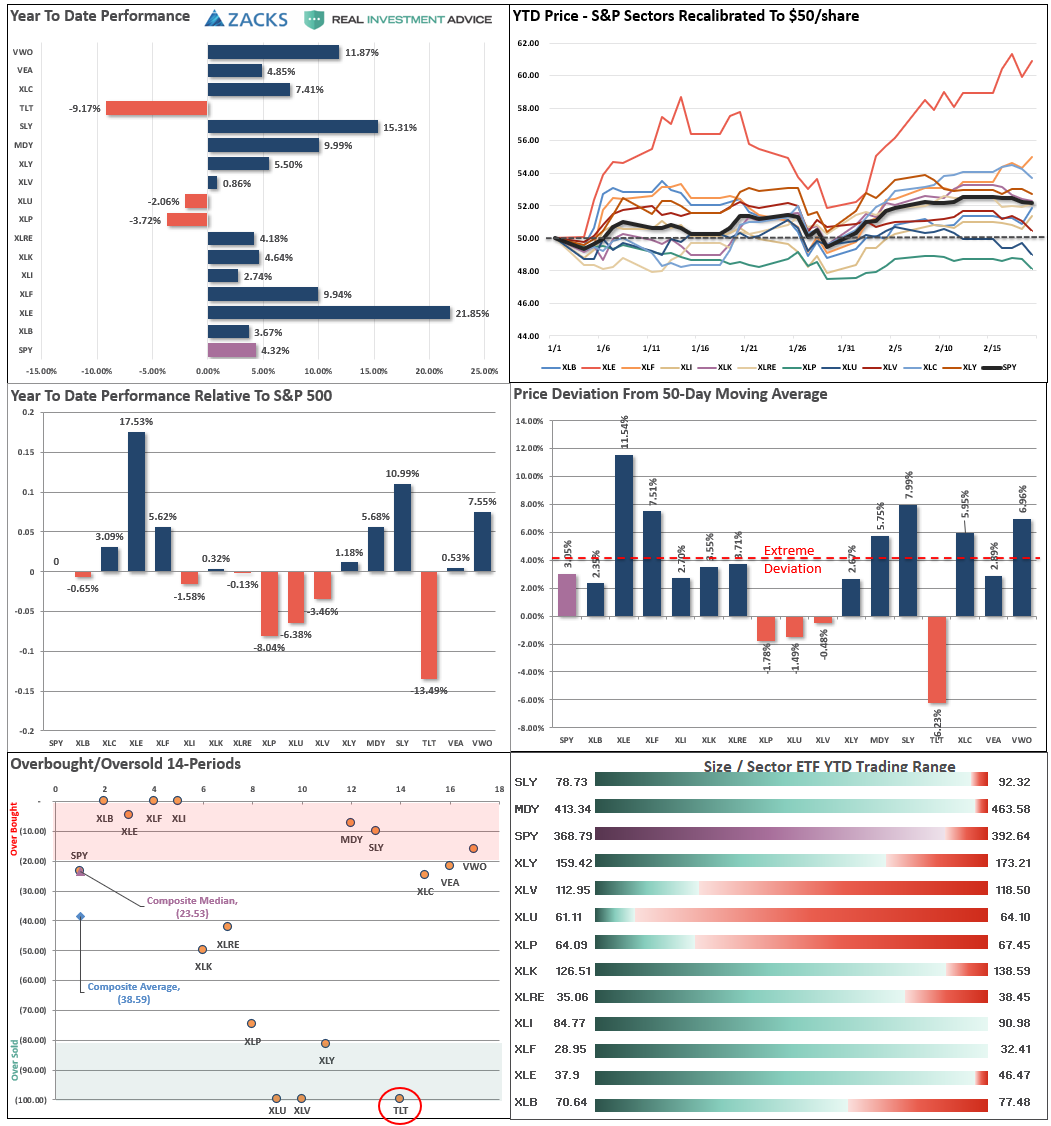
Performance Analysis
Technical Composite
The technical overbought/sold gauge comprises several price indicators (RSI, Williams %R, etc.), measured using “weekly” closing price data. Readings above “80” are considered overbought, and below “20” is oversold. The current reading is 86.87 out of a possible 100.

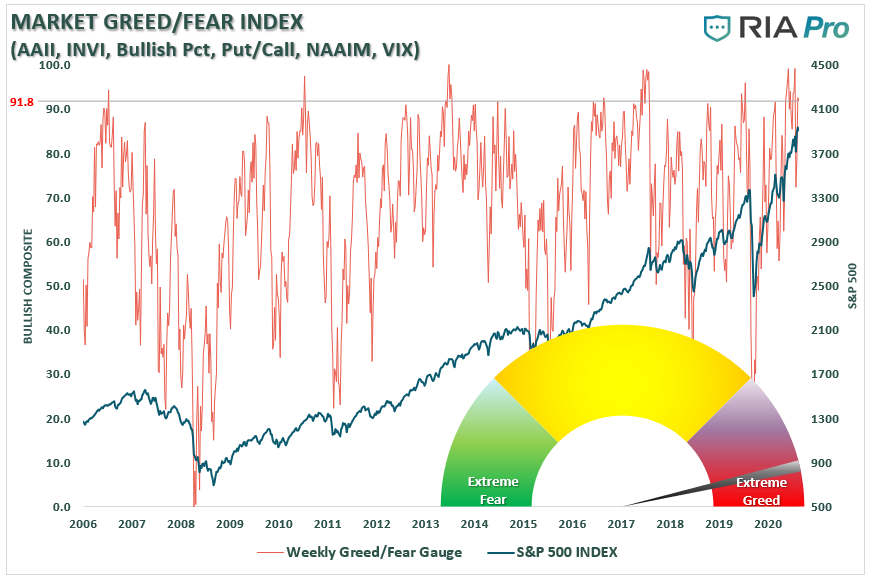
Portfolio Positioning “Fear / Greed” Gauge
The “Fear/Greed” gauge is how individual and professional investors are “positioning” themselves in the market based on their equity exposure. From a contrarian position, the higher the allocation to equities, to more likely the market is closer to a correction than not. The gauge uses weekly closing data.
NOTE: The Fear/Greed Index measures risk from 0-100. It is a rarity that it reaches levels above 90. The current reading is 91.8 out of a possible 100.
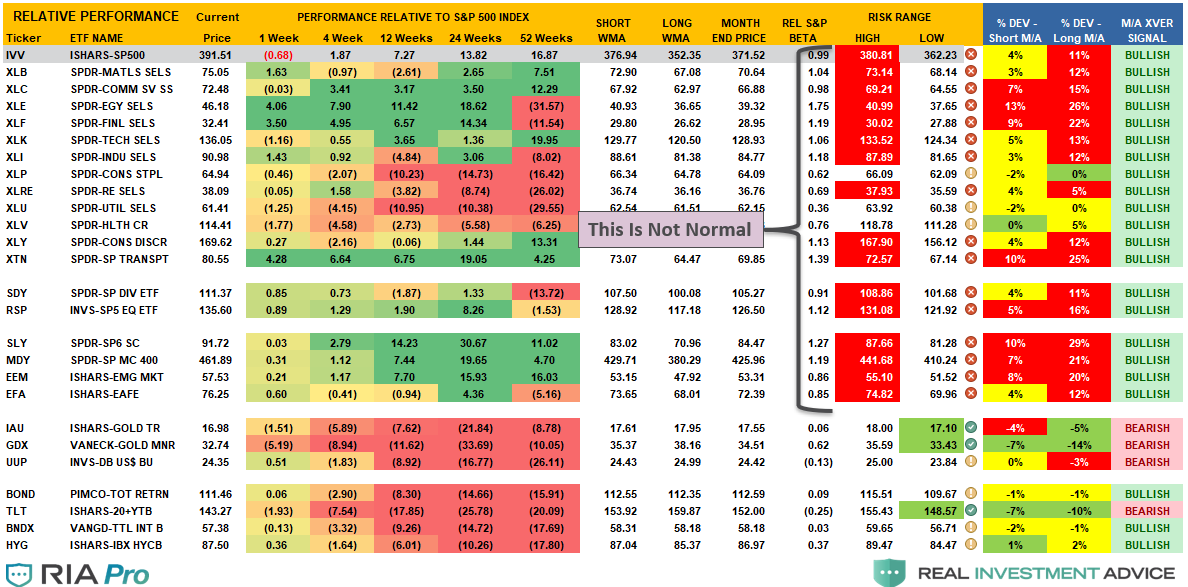
Sector Model Analysis & Risk Ranges
How To Read.
- The table compares each sector and market to the S&P 500 index on relative performance.
- The “MA XVER” is determined by whether the short-term weekly moving average crosses positively or negatively with the long-term weekly moving average.
- The risk range is a function of the month-end closing price and the “beta” of the sector or market.
- The table shows the price deviation above and below the weekly moving averages.
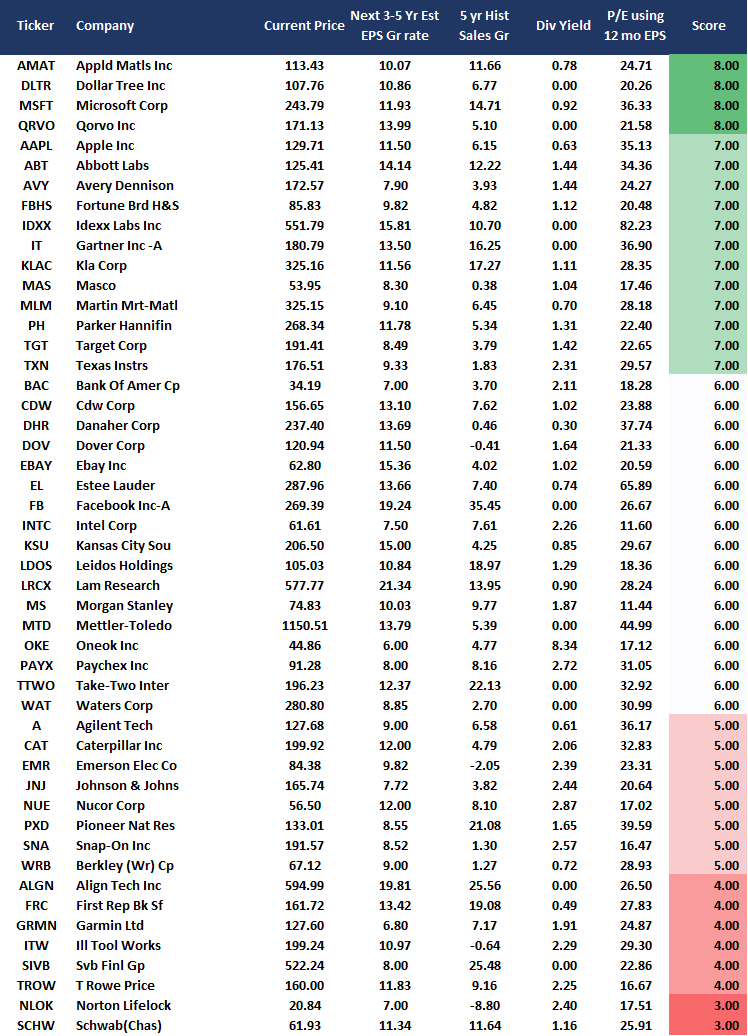
Weekly Stock Screens
Currently, there are four different stock screens for you to review. The first is S&P 500 based companies with a “Growth” focus, the second is a “Value” screen on the entire universe of stocks, and the last are stocks that are “Technically” strong and breaking above their respective 50-dma.
We have provided the yield of each security and a Piotroski Score ranking to help you find fundamentally strong companies on each screen. (For more on the Piotroski Score – read this report.)
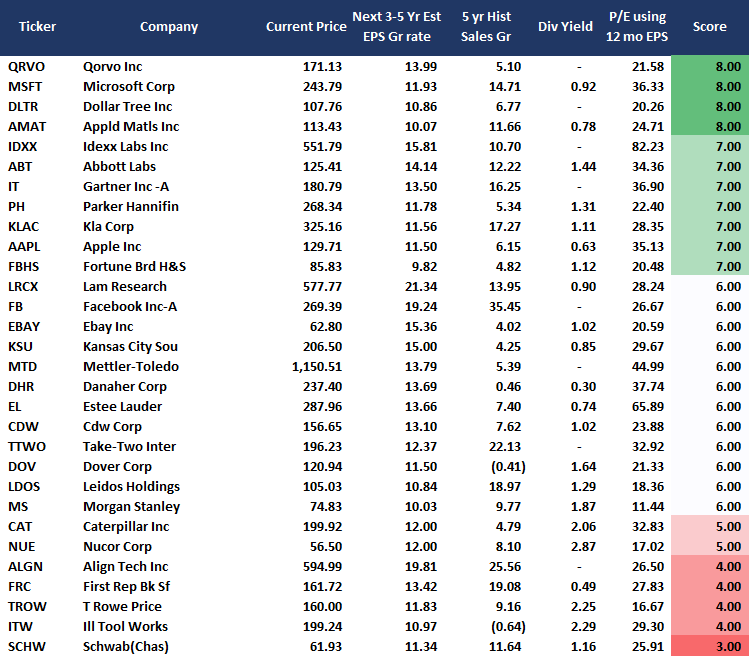
S&P 500 Growth Screen
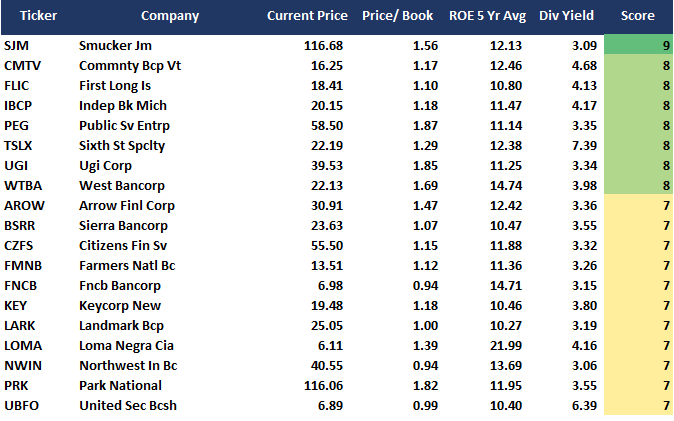
Low P/B, High-Value Score, High Dividend Screen
NEW! Fundamental Growth Screen
Aggressive Growth Strategy

Portfolio / Client Update
Last week, I noted that price action was beginning to get a bit more “sloppy.” That continued into this week.
With our money flow indicators now starting to return to more extreme levels, we have begun the process of raising cash and reducing risk accordingly. We will continue this process over the next couple of weeks as we head into March, where the risk of a short-term correction grows.
This past week we shortened our bond-duration more by eliminating our mortgage holdings. When interest rates rise, the duration of mortgages can get very long, very quickly. Such would increase volatility in our bond portfolio more than we want currently.
As always, we continue watching our indicators closely. We still think this rally may have one or two weeks left, but that window is growing shorter.
We will make changes accordingly.
Portfolio Changes
During the past week, we made minor changes to portfolios. We post all trades in real-time at RIAPRO.NET.
** Equity Portfolio – Trade Update ***
Portfolio Managers – Michael Lebowitz/Lance Roberts
“We sold all of our position in WMT today following not only a disappointing earnings announcement but also very lackluster guidance for the rest of the year. We will re-evaluate the position in the future if warranted.” – 02-18-21
Equity/Sector Portfolio
- Sell 100% Of Walmart (WMT)
We sold our position in AMD. This is a first step in reducing our equity exposure as we are seeing signs a correction is on the horizon. AMD appears technically vulnerable as well. We are adding back to our stake in PLTR after taking profits previously. The recent correction has gotten the position back to support and extremely oversold. – 02-17-21
Equity/Sector Portfolio
- Sell 100% of AMD
“We reduced our fixed income exposure by selling our entire position in MBB (mortgage ETF) and buying, in its place, 10% of SHY (1-3yr Tsy). We are concerned that further selling in the fixed income markets would raise the duration of mortgages and create forced selling by leveraged institutional holders of mortgages. Given the low yield of mortgages, the risk-reward is not worth the risk.” – 02-16-21
Equity/Sector Portfolio
- Sell all MBB 13%
- Buy 10% SHY
As always, our short-term concern remains the protection of your portfolio. We have now shifted our focus from the election back to the economic recovery and where we go from here.
Lance Roberts
CIO
THE REAL 401k PLAN MANAGER
A Conservative Strategy For Long-Term Investors
If you need help after reading the alert, do not hesitate to contact me.

Model performance is a two-asset model of stocks and bonds relative to the weighting changes made each week in the newsletter. Such is strictly for informational and educational purposes only, and one should not rely on it for any reason. Past performance is not a guarantee of future results. Use at your own risk and peril.

401k Plan Manager Live Model
As an RIA PRO subscriber (You get your first 30-days free), you can access our live 401k plan manager.
Compare your current 401k allocation to our recommendation for your company-specific plan and our 401k model allocation.
You can also track performance, estimate future values based on your savings and expected returns, and dig down into your sector and market allocations.
If you would like to offer our service to your employees at a deeply discounted corporate rate, please contact me.


Lance Roberts is a Chief Portfolio Strategist/Economist for RIA Advisors. He is also the host of “The Lance Roberts Podcast” and Chief Editor of the “Real Investment Advice” website and author of “Real Investment Daily” blog and “Real Investment Report“. Follow Lance on Facebook, Twitter, Linked-In and YouTube
Customer Relationship Summary (Form CRS)
Also Read