The vast “cash hoard of 2023” has the bullish media salivating about what it means for the future of equities. That cash hoard in money market funds now exceeds $5.2 trillion.
Such has brought forth the age-old narrative that the “money on the sidelines” is set to come into the markets. However, they don’t tell you those funds have accumulated since 1974. Correctly, in the aftermath of crisis events, some of these assets rotate from “safety” to “risk,” but not the degree commentators suggest. Interestingly, such did not occur following the pandemic-related crisis.

This is the “myth of money on the sidelines.”
“There are no sidelines. Those saying this seem to envision a seller of stocks moving her money to cash and awaiting a chance to return. But they always ignore that this seller sold to somebody, who presumably moved a precisely equal amount of cash off the sidelines.” – Clifford Asness:
Every transaction in the market requires both a buyer and a seller, with the only differentiating factor being at what PRICE the transaction occurs. Since this is required for market equilibrium, there can be no “sidelines.”
Think of this dynamic as you would a football game. Each team must field 11 players despite having over 50 players. If a player comes off the sidelines to replace a player on the field, the substituted player will join the other sidelined players’ ranks. Notably, at all times, there will only be 11 players per team on the field. Such holds equally true if teams expand to 100 or even 1,000 players.
So, while the “cash hoard” has swollen in recent years, there are two important points to consider in the current environment.
- The disincentive of taking risk versus “risk-free” returns; and,
- Who holds the majority of that “cash hoard?”

Why Take the Risk?
Following the financial crisis, Ben Bernanke dropped the Fed funds rate to zero and flooded the system with liquidity through “quantitative easing.” As he noted in 2010, those actions would boost asset prices, lifting consumer confidence and creating economic growth. By dropping rates to zero, “risk-free” rates also dropped toward zero, leaving investors little choice to obtain a return on their cash.
Today, that narrative has changed with current “risk-free” yields above 4%. Historically, there were periods when one could stick money in a “savings” account and earn enough return without taking risks. In other words, it was possible to “save” your way to retirement.
The chart below shows the savings rate on short-term deposits versus the equity-risk premium of the market.
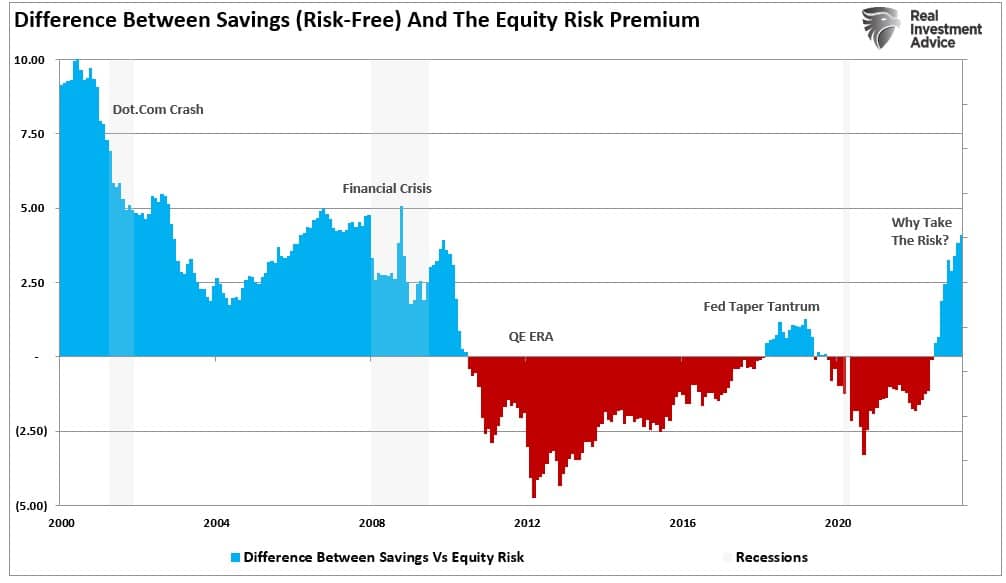
One of the problems with the “cash hoard” in 2023 is there is currently no incentive to reverse those savings into “risk assets” unless the Fed is dropping rates and reintroducing “quantitative easing.” However, as discussed in “Banking Crisis Is How It Starts,” if the Fed reverses to a more accommodative policy, it is because they have “broken something.” Such will not be the time to take on more risk, but less.
Furthermore, despite the high money market account balances, investors have very low cash balances relative to the current equity exposure. As asset prices escalated since the Financial Crisis, supported by successive rounds of monetary policy, investors were trained to chase risk. While equity-to-cash ratios peaked in 2022, they remain at historically high levels.

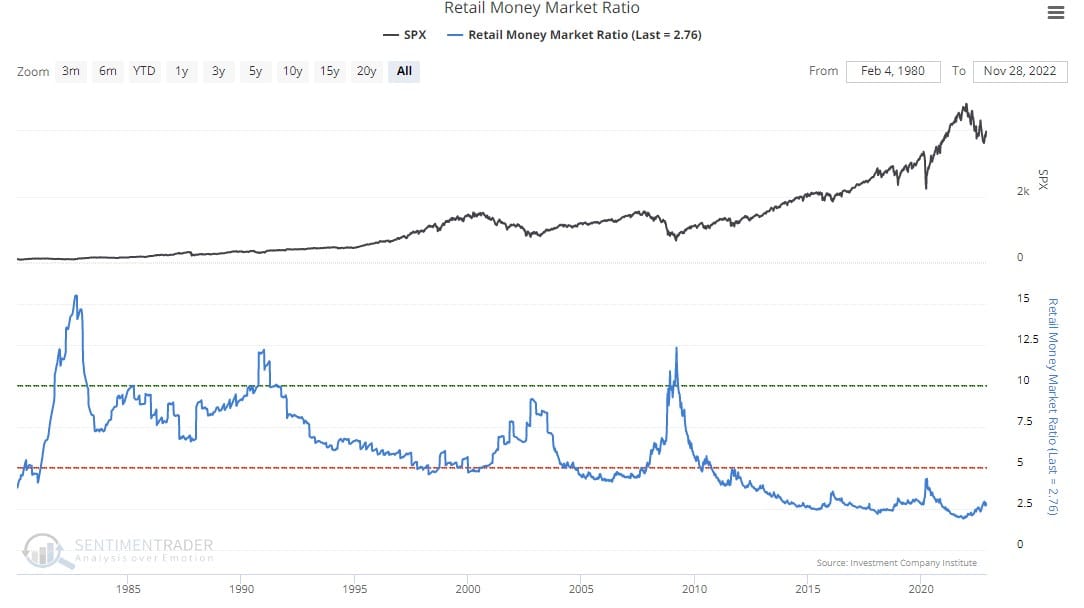
Furthermore, retail investors have very little cash in money markets to invest.
Professional mutual fund managers are also holding near record-low levels of cash.

In fact, what is interesting is that historically, although higher rates attracted savings, the subsequent rate decline did not create massive outflows.
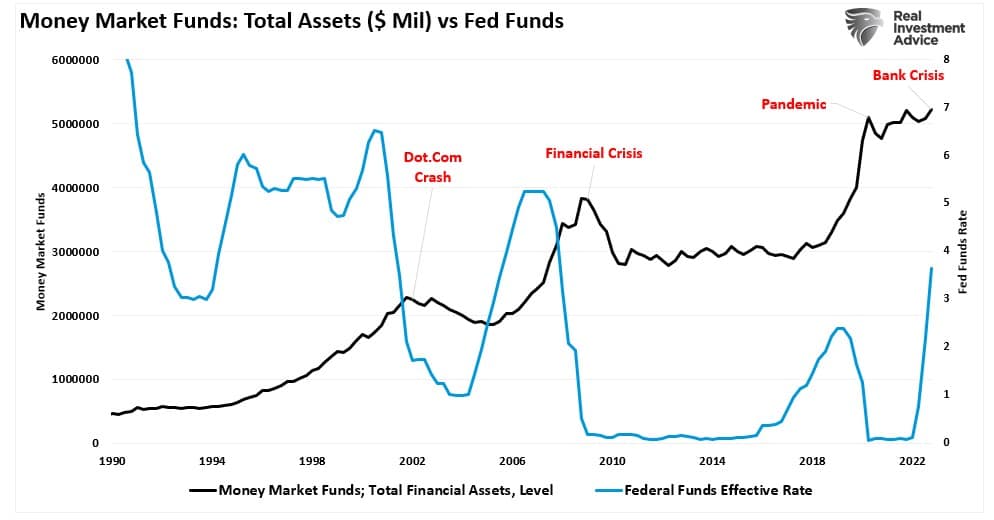
There is a reason for that.

Corporate Coffers
So, if it isn’t retail or professional investors, who is holding this $5 trillion cash hoard? The following Office of Financial Research chart breaks down money market funds by type.
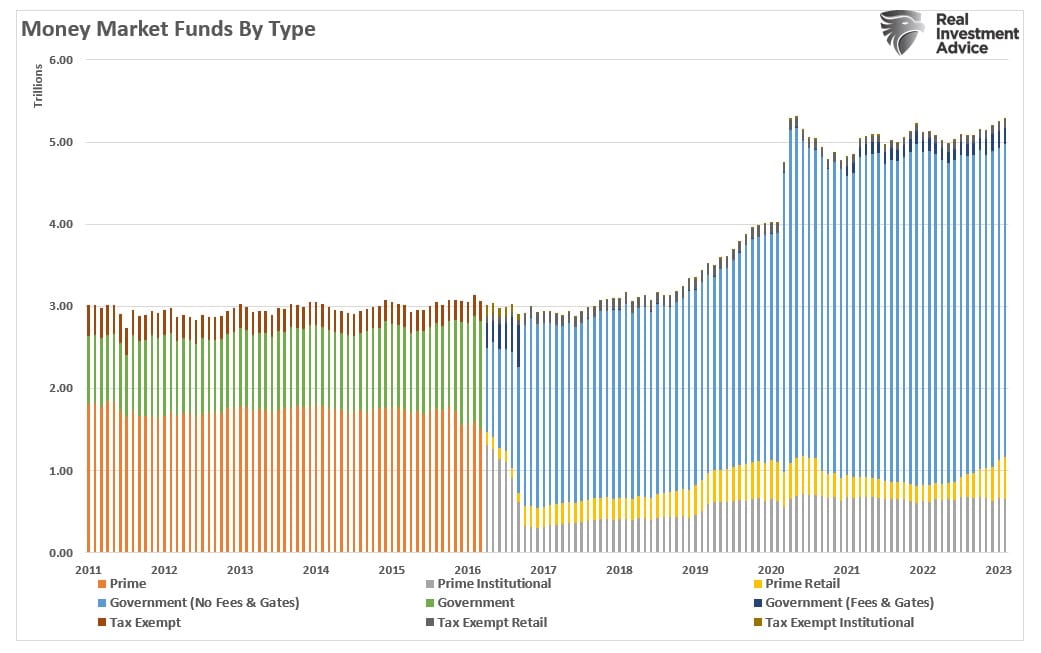
Looking at the chart above, you will notice that the bulk of the money is in government money market funds. Those particular money market funds generally have much higher account minimums (from $100,000 to $1 million), suggesting the funds are not retail investors. (Those would be the smaller balances of prime institutional and retail funds.)
As noted, much of the “cash on the sidelines” is held by corporations. As we said in “A major support for assets has reversed,” that isn’t a surprise:
“CEOs make decisions on how they use their cash. If concerns of a recession persist, companies will become more conservative on the use of their cash, rather than continuing to repurchase shares.” — September 2019
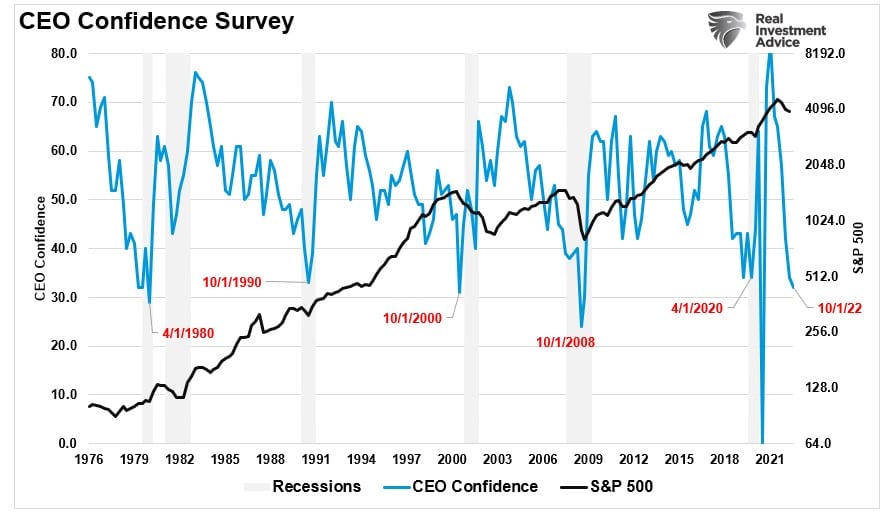
Not surprisingly, as of the end of 2022, with CEO confidence near record lows, the money spent on buybacks slowed, and the cash hoard swelled as mergers and acquisitions declined.
Until the economic environment improves, those cash hoards will unlikely revert anytime soon.

Future Returns May Be Lower
As discussed in “Long-Term Returns Are Unsustainable.”
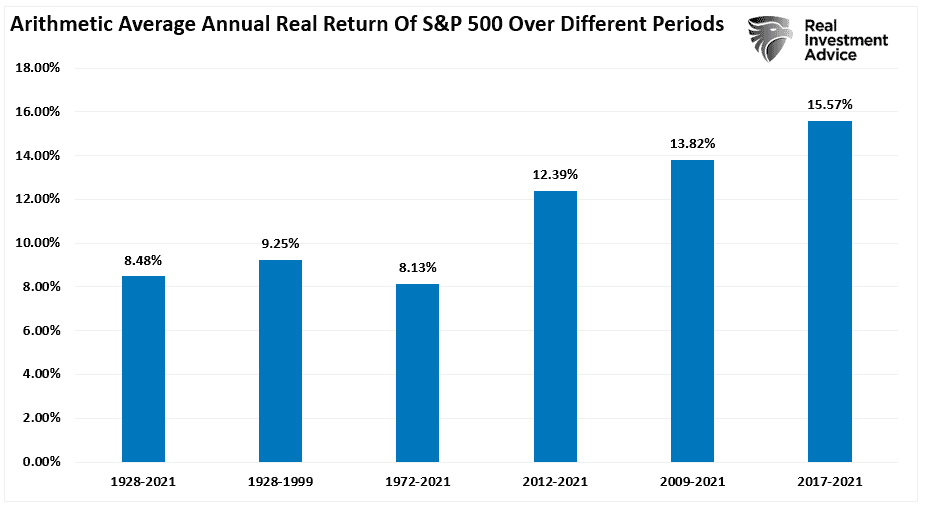
“The chart below shows the average annual inflation-adjusted total returns (dividends included) since 1928. I used the total return data from Aswath Damodaran, a Stern School of Business professor at New York University. The chart shows that from 1928 to 2021, the market returned 8.48% after inflation. However, notice that after the financial crisis in 2008, returns jumped by an average of four percentage points for the various periods.
After more than a decade, many investors have become complacent in expecting elevated rates of return from the financial markets. However, can those expectations continue to get met in the future?”
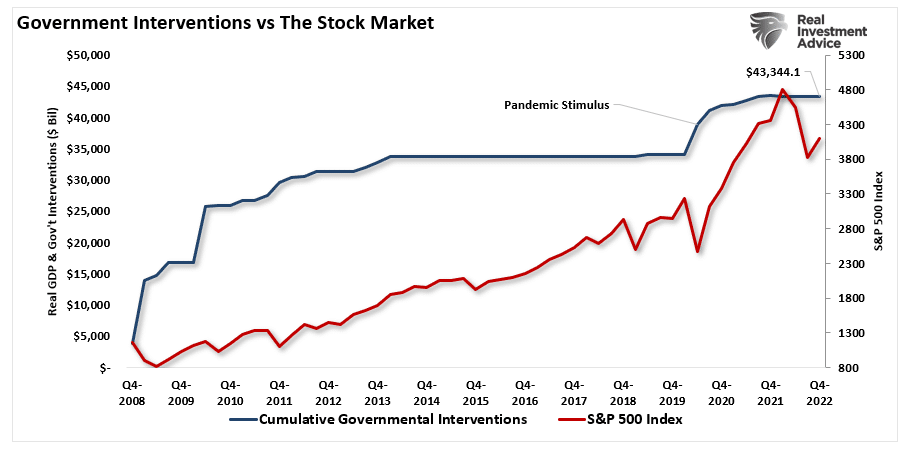
Of course, those excess returns were driven by the massive floods of liquidity from the Government and the Federal Reserve, including trillions in corporate share buybacks and zero interest rates. Since 2009, there was more than $43 Trillion in various liquidity supports. To put that into perspective, the inputs exceed underlying economic growth by more than 10-fold.
However, given an equal choice between “risk” and “risk-free” returns, such extracts buyers from the market and lowers potential price appreciation. In other words, as long as savings rates remain elevated, future stock market returns will likely be lower than over the past decade.
With net exposure to equities by professional and retail investors still near historically high levels, it suggests there is not an exceeding amount of buying power to push markets substantially higher.
It is a foregone conclusion that the Fed will eventually cut rates drastically due to a financial crisis or a recession. However, as noted above, that does not mean the $5 trillion “cash hoard” will come flooding back into the equity markets. back into the markets. That will ultimately be an issue of confidence.
So, the next time you hear someone talk about “money on the sidelines,” just remember that it really isn’t on the sidelines.
More importantly, if you expect a return to the “bull market of yesteryear,” you may be disappointed.

