Will the market retest lows this summer? In this past weekend’s commentary, I discussed the end of the seasonally strong period for the market.
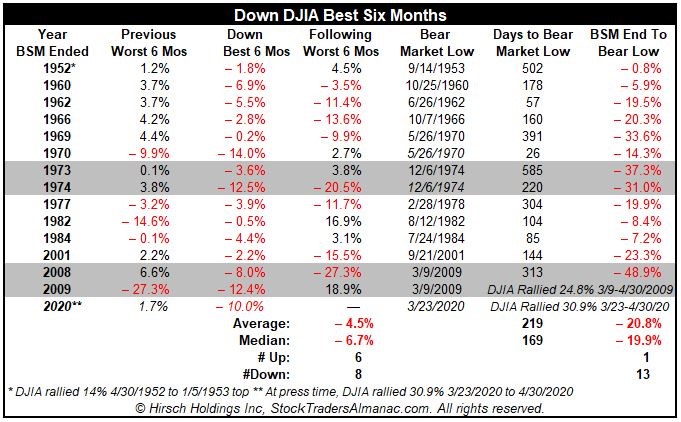
“Despite the sell-off on the last day of April, the Best Six Months has ended on a positive note, registering the best month in decades and the best April since the Great Depression.” – Jeffrey Hirsch, Stocktraders Almanac
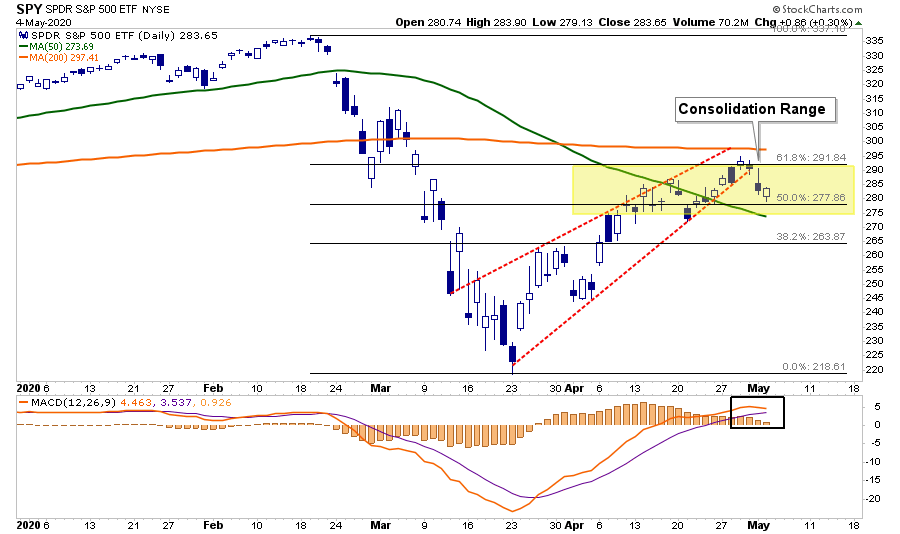
As noted, the primary seasonal signal has not crossed into negative territory yet but seems to be heading in that direction. If we keep grinding sideways for a few more sessions, it will come to pass. (Note: Sell-off Monday morning did test and hold support at the 50% Fibonacci retracement level.)
“The massive rally has undoubtedly been impressive and a welcome change from the carnage we experienced in February and March. April 2020 has been the best month since January 1987 for DJIA and S&P 500, and the best April since 1938.
But April’s huge move was not enough to put the Best Six Months (November-April) in the black, and that concerns us. The DJIA was down 10.0% for this Best Six Months period, which ended today, and the S&P 500 lost 4.1%.
When the market is down during the “Best Six Months,” it’s an indication that there are more powerful forces than seasonality at work, and when the bullish season is over, those forces may really have their say.” – Jeff Hirsch

Confirming Analysis
John Murphy, of Stockcharts.com, also suggests the spring rally may have concluded.
“Several short-term technical indicators suggest that the spring rebound in stocks may have peaked this past week. The daily bars show the S&P 500 selling off on Thursday and Friday after touching its 62% Fibonacci retracement line (purple arrow).”
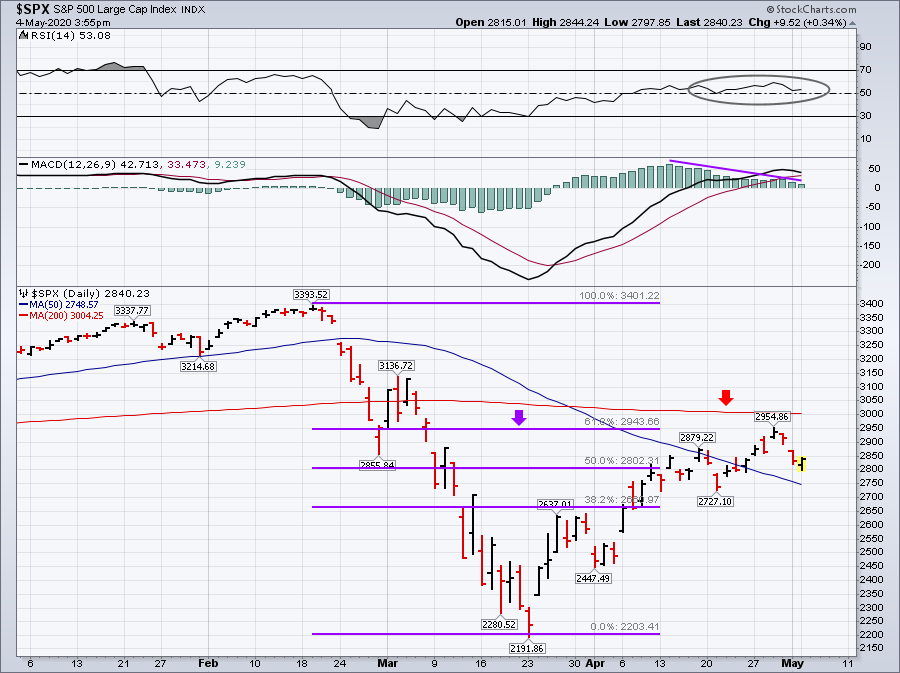
“It’s also not far from its falling 200-day average, which is also likely to act as an overhead resistance barrier (red arrow). The short-term momentum indicators may also be weakening. The 14-day RSI line in the upper box ended the week at 52, which puts it in danger of falling back below its mid-line at 50.
That would signal that the market uptrend is losing momentum. The daily MACD lines in the middle box are still positive. But the declining purple trendline overlaid on the MACD histogram bars (which measure the spread between the two MACD lines) suggests that upward momentum may be slowing there as well.”
Both analyses confirms our work and leaves the question of just how deep the retracement may be unanswered?
Risk Abounds
There is much to be concerned with.
While we are already well aware of what has happened since the onset of the “COVID-19” virus, we are beginning to get the first sets of actual data. Plunging levels of production, manufacturing, sales, and surging rates of unemployment will potentially weigh on investor outlooks.
Currently, the investing mantra has been that investors are “looking past” the 2020 period, and into 2021, betting on earnings growth to come surging back. While such could be the case, investors are aggressively overpaying for future growth, considering a complete lack of visibility on how deep the earnings recession will be.
However, as noted previously, we can certainly make an educated guess based on past recessionary experience.
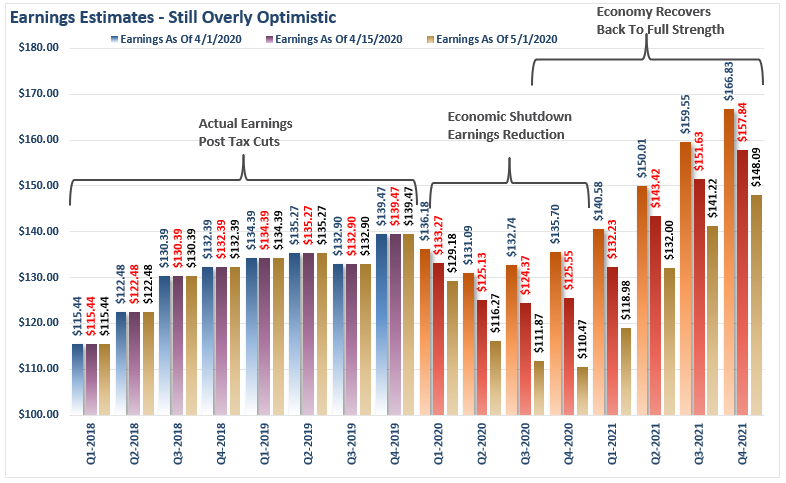
“So, with the entire U.S. economy shut down, 15-20% unemployment, and -20% GDP, earnings are only expected to decline by
1020%?”
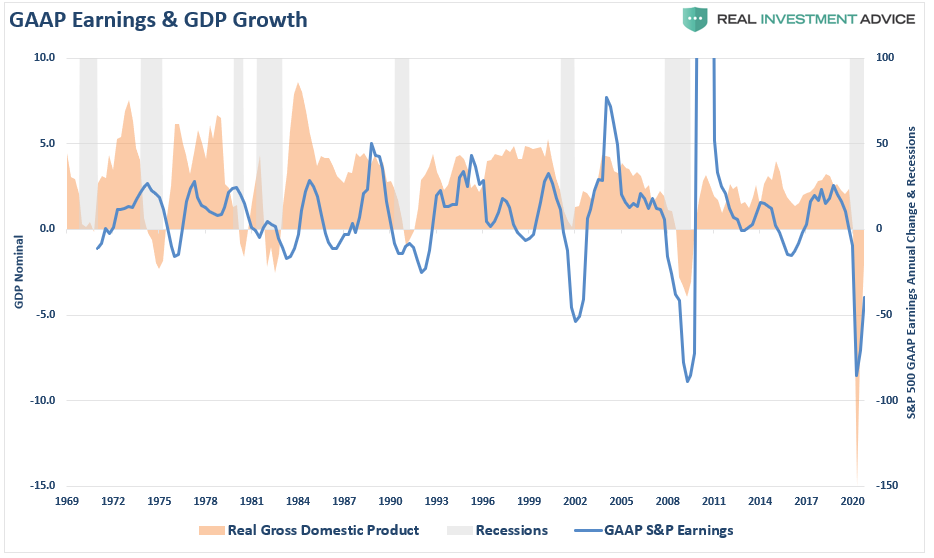
A review of GAAP Earnings as compared to GDP suggests such is likely not the case. There is a high correlation between economic growth and corporate earnings. Such is because without economic growth, consumers don’t have paychecks with which to consume. Ultimately, it is consumption that drives corporate profits.
Optimistic Assumptions
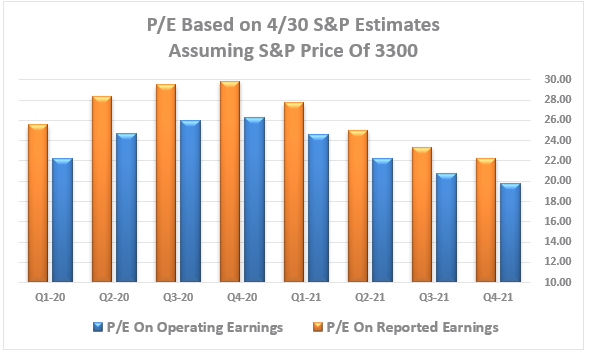
Assuming a 15% decline in GDP (some estimates run as high as 30%), the suggestion of only a 20% decline in earnings seems naive. However, the latest update from Standard & Poors for S&P 500 earnings contains a mild revision in earnings estimates. We suspect these are still too high, as is the expected recovery.
To garner a better understanding, the two charts below compare operating (earnings before real stuff) to reported (actual) earnings, on both an annual basis and as compared to Q4-2019.
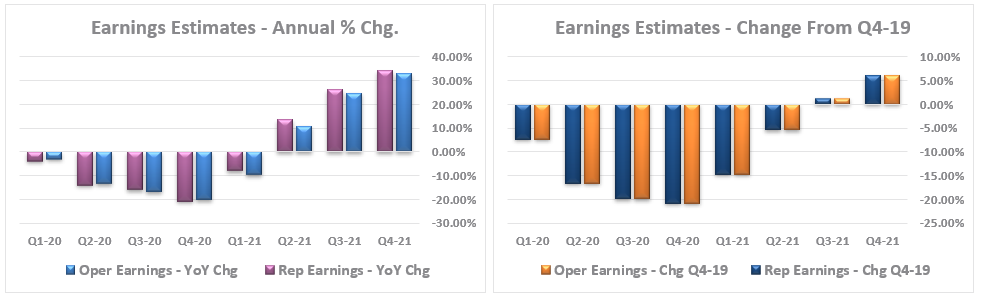
Given the magnitude of potential economic destruction, a 20% decline in earnings seems optimistic. Such also suggests that valuations at current levels remain rich as well.
Maybe this is why Warren Buffett is sitting on $138 billion in cash and telling his investors he can’t find anything attractive to buy.
“Price is what you pay; value is you get.” – Warren Buffett
As earnings align with economic realities, the risk to markets currently remains to the downside.

Will The Market Retest Lows?
We posted the following note from Turning Point Analytics for our RIA PRO subscribers (30-day Risk-FREE Trial) yesterday.
“Bespoke looked at bear markets since 1928 (the past 92 years) to determine how many times a bear market made new lows after initially rallying out of the bear market territory. They found that markets made new lows after rallying more often than not, but found that more recent results were less ominous.
Our analysis of the Bespoke results yielded a different conclusion.
Original Bespoke data and results
- Number of bear markets counted = 25
- Number of bear markets making new lows = 14
- Percent of bear markets making new lows = 56%
- Number of bear markets since 5/14/40 to make a new low = 6
- Percent of bear markets making new lows since 5/14/40 = 42%
However, Bespoke counted as separate bear markets, several periods that should count as part of a longer bear market.
If we make sure that a new period must be at least 12 months past the previous period, then there are only 15, not 25 separate periods. Out of the 15 bear markets, 9 made new lows or 60%.
Using this new definition of the market periods means that in the past 20 years (since 2000), ALL of the bear markets have made new lows (see annotated table 2) We think this analysis makes more sense, as we don’t include the period from 1/6/09 to 3/9/09 in the 2008-2009 bear market? It does not make much sense to talk about these last 2-months as a separate bear market. This perspective on the historic pattern points to a much more likely retest of the 3/23 lows.”

Conclusion
Will markets retrace to the March 23rd lows? Maybe.
It is a “risk” worth evaluating when investing your capital. As investors, there are many possibilities and probabilities of future outcomes. Our job is to weigh those outcomes and make informed decisions.
“Hoping” is not an investment strategy or a logical decision-making process.

Even if the markets have indeed put in the “bear market” low, there is more than a small chance, it is not the final low.
When even Warren Buffett calls out Energy, Retail, Airlines, and Non-Residential Real Estate (read REIT’s) as industries that have been destabilized and will not likely resemble the past in terms of growth and profitability, you have to question your investment “risk.”
Those sectors are core reflections of the broader economy, and while Technology are insulated from complete revenue destruction, they are not immune from a slow down in personal and business spending.
There is risk to the downside currently, more so than there is to the upside. As we head into the “seasonally weak” period of the year, coupled with a deluge of weak economic and earnings data, this is likely a good time to rebalance portfolio risk.
There is not an insignificant chance of the market to retest lows when you are least expecting it.

