In early March, before the impact of the COVID-19 was fully understood, I penned an article suggesting that both corporate profits and S&P 500 earnings were suggesting the “bear market wasn’t over.” To wit:
“Profit margins are probably the most mean-reverting series in finance, and if profit margins do not mean-revert, then something has gone badly wrong with capitalism. If high profits do not attract competition, there is something wrong with the system, and it is not functioning properly.” – Jeremy Grantham
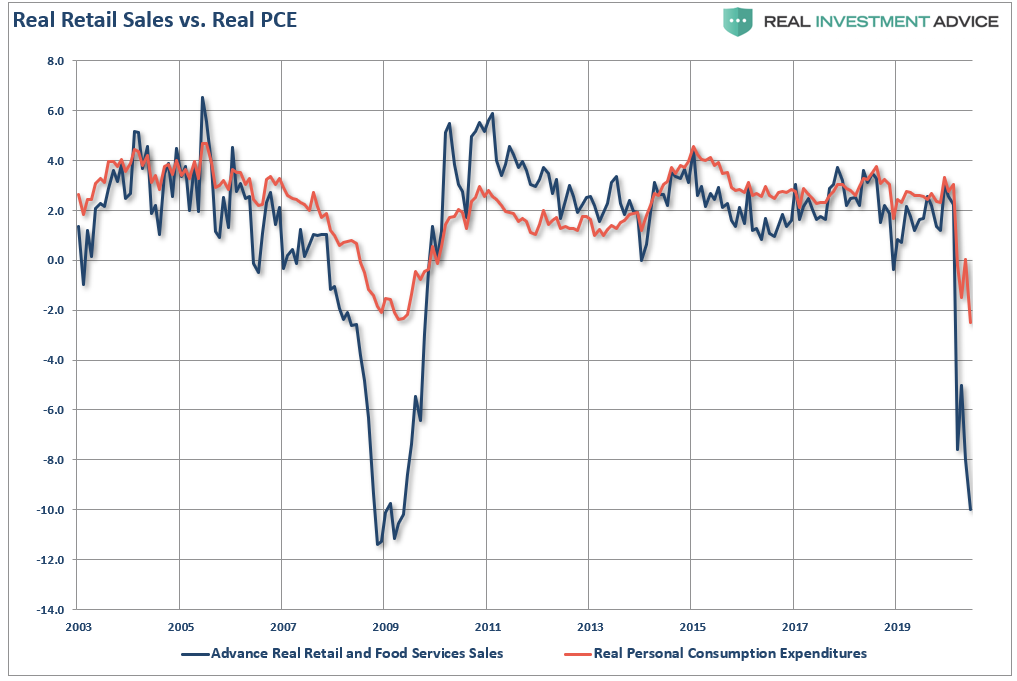
At that time, the impending recession, and consumption freeze, was only starting and we had no data to suggest just how bad it was going to get. Since then, we have had epic declines in manufacturing, surging unemployment, and plunging retail sales. To wit:
“From the decline of 8.7% in retail sales, 40% of PCE, we can extrapolate the decline into expectations for PCE growth. Again, since PCE comprises almost 70% of the economy, this is why expectations are for a drop of 10%, or more, in GDP in the second quarter.”
But it isn’t just retail sales. It is also exports which account for about 40% of corporate profits overall, which are seen sliding dramatically in March.
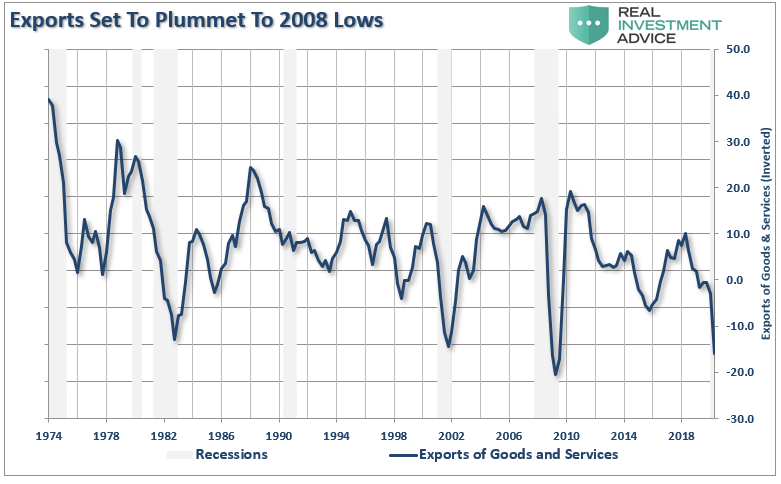
This all suggests dramatically lower corporate profits and earnings per share for the S&P 500 index.
Earnings Estimates Still Too High
In “Reward Doesn’t Justify The Risk,” I noted that while estimates have indeed been lowered by Standard & Poors (latest update was April 19th), the earnings revisions are a long way from reflecting what earnings will look like over the next couple of quarters.
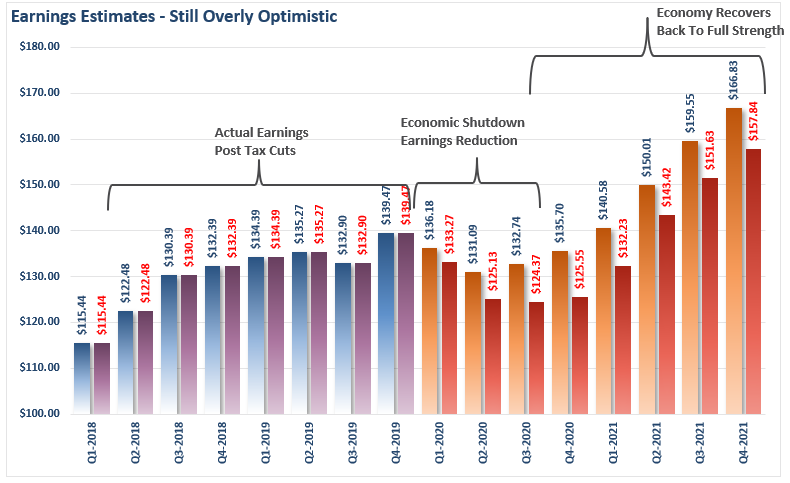
“To analyze the reality of current expectations, we need to review the history of the estimates for the S&P 500 from when 2021 estimates were first published by Standard & Poors in April 2019. The chart shows the progression in estimates April to September 2019, and March and April of 2020. (The dotted blue line is my original, unrevised estimate of the impact to earnings in February of this year.)”
(NOTE: Chart has been updated to include the last update to estimates.)
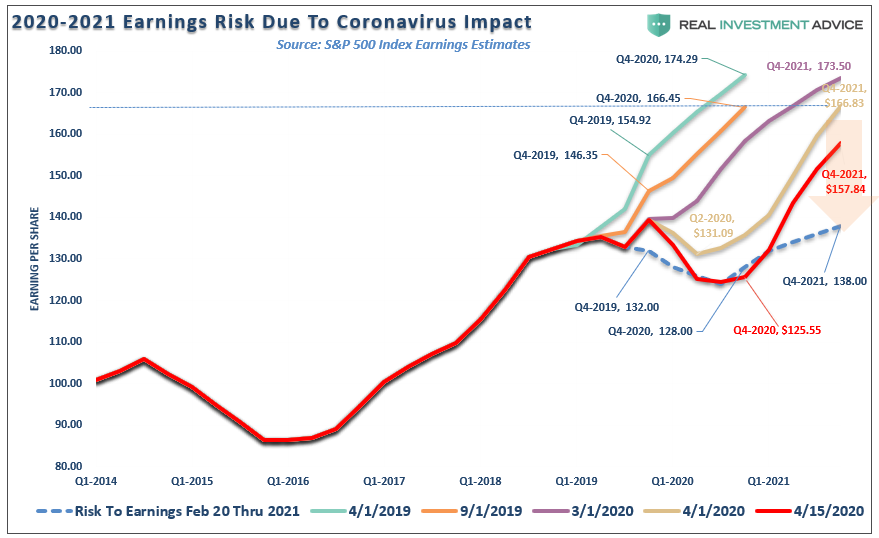
Importantly, note that Standard & Poors finally caught up with our original estimate from February for the second and third quarters. However, as I stated at that time, “my estimates are likely overly optimistic” as the virus was still a relatively unknown and unaccounted for threat.
More importantly, the chart below shows the comparison of the original, and latest estimates for April. In our first analysis, earnings were expected to decline from Q4-2019 levels of $139.47 to $136.18 and $131.09, respectively in Q1 and Q2 of 2020. That is a decline of -2.3% in Q1 and a total decline of -6% in Q2.
Those numbers have now been revised for a decline of -4.4% in Q1, and a total decline of 10.2% in Q2.
So, with the entire U.S. economy shut down, 15-20% unemployment, and -20% GDP, earnings are only expected to decline by 10%?
History suggests this is not likely to be the case.
First, let’s review GAAP Earnings (actual real earnings) as compared to GDP. Not surprisingly, since “stocks are not the economy,” there is a higher correlation between economic growth and corporate earnings. This is because, without economic growth, consumers don’t have paychecks with which to consume, which is where corporate earnings are derived from.
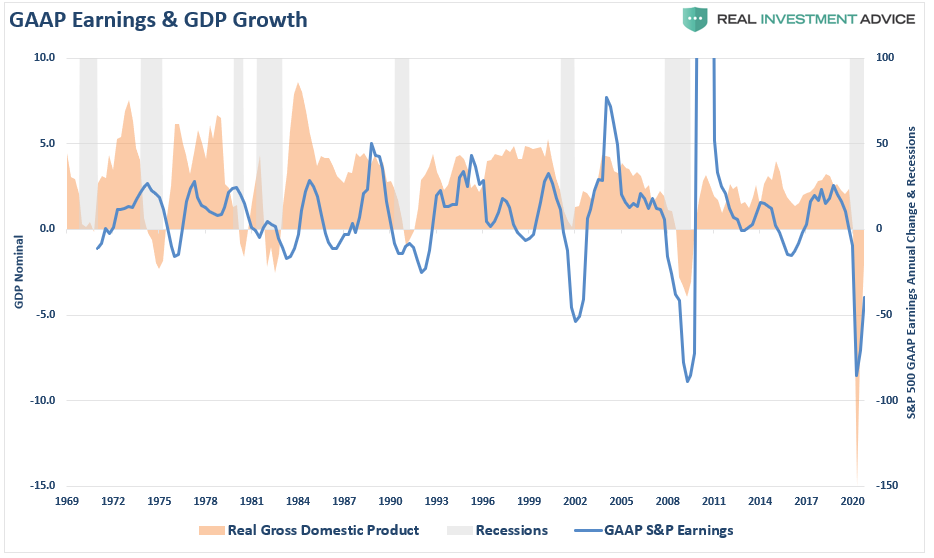
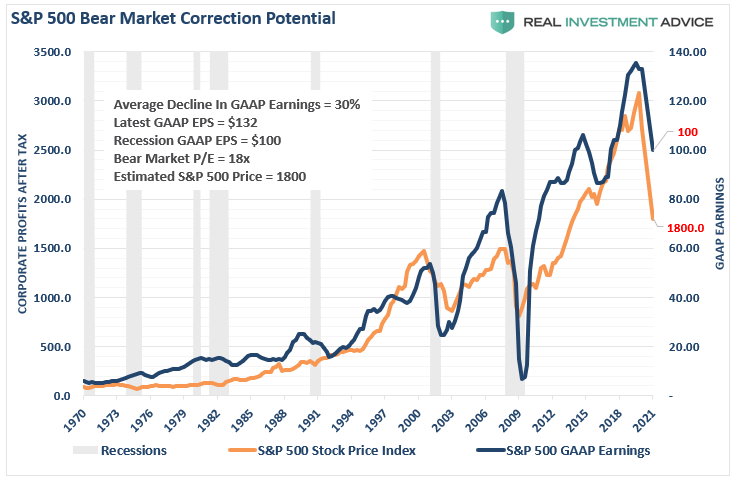
Assuming a 15% decline in GDP (some estimates run as high as 30%), the suggestion of only a 10% decline in earnings seems laughable. The chart below looks at S&P’s estimates (as reported) going back to 2008, versus the S&P 500, and expectations for a “V-sharped” market recovery.
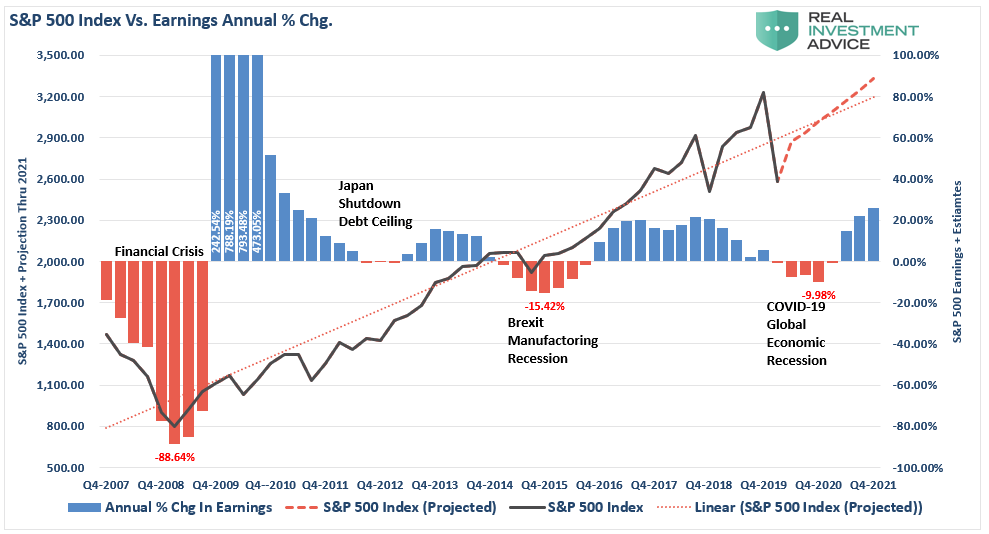
In 2008, during the “Financial crisis,” which did NOT shut down the economy, the annual change in earnings fell by 89%. Even during the Brexit/Manufacturing recession of 2015-2016, earnings fell by 15%.
Again I ask you, “Does it seem realistic that with a decline in economic growth not seen since the “Depression,” earnings would only decline by 10%?”
But if you are chasing the market currently, this is what you are “buying into.”
Valuations Are An Issue
“I would say basically we’re like the captain of a ship when the worst typhoon that’s ever happened comes. We just want to get through the typhoon, and we’d rather come out of it with a whole lot of liquidity. We’re not playing, ‘Oh goody, goody, everything’s going to hell, let’s plunge 100% of the reserves [into buying businesses].’
Nobody in America’s ever seen anything else like this. This thing is different. Everybody talks as if they know what’s going to happen, and nobody knows what’s going to happen.” – Charlie Munger.
I quoted Charlie in this past weekend’s newsletter as it is the basis of our views on capital preservation and risk management.
“While it may seem silly, we believe the process of investing is not about ‘guessing,’ but rather ‘knowing,’ what you are buying.”
Currently, the “race to chase the bottom” has gotten investors to once again vastly overpay for assets which portends poor future returns. More importantly, they have jumped into “buying risk,” at a point where that “risk,” or rather the opportunity to lose capital, can not be calculated.
But if you think I am overly bearish on my estimates, I assure you I am not.
“Credit Suisse, JPMorgan and Goldman all point out the schizophrenia in being bullish in a time when corporate profits are set for the biggest – and longest – drop since the Great Depression, late last week two more banks joined the bandwagon with Citi warning that ‘equities fall the same as EPS in a recession… and reflect that equity markets are currently not reflecting the expected decline of 50% in global EPS in 2020.” – Zerohedge
If any of these numbers come to fruition, which there is more than a decent probability they will, then investors are currently paying higher valuations now than they were at the peak of the market in February.
“Bank of America’s Savita Subramanian has also done the math and concludes that as ‘stocks have rallied, bottom-up consensus estimates for 2020 have fallen’, which in turn has pushed the S&P 500’s forward P/E ratio from March’s low of 13.0x to 19.5x, higher than mid-Feb’s peak P/E of 18.9x.” – Zerohedge

Using BofA’s valuation table of 20 different metrics, it is hard to suggest that buying stocks today will have a positive outcome over the next few years, much less the next few months.
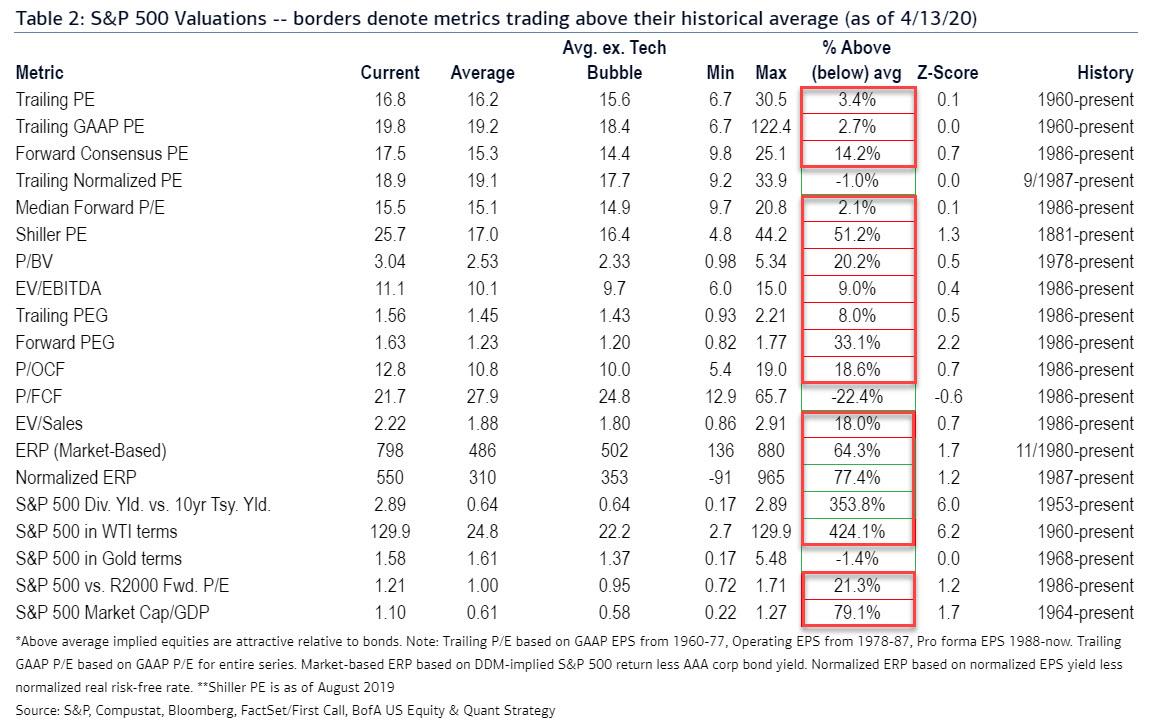
Importantly, this isn’t “bullish” or “bearish,” this is just math.
The Bear Market Isn’t Over
“The smoothed CAPE multiple at 25.9x in April — expanding from 24.9x in March! — which compares with 24.0x in January 2008, the first month of the Great Recession twelve years ago. We had a 26.0x multiple on our hands, as an example, back at the end of 2015. You see, that is a multiple you can pay if you are assured that the economy will be expanding, as it did then and the next year at a 2% pace. But that is not the case today. And you can’t simply say ignore 2020 earnings so conveniently when the hole future profits trajectory has been semi-permanently impaired.
We are into an epic 40% down quarter on GDP and with no visibility, which is why a growing list of firms are pulling their guidance. The CAPE multiple peaked in January at 31.0x, shrunk to 24.9x in March, and is back to 25.9x. Let me just say, for the record, that we have never seen a bear market end with a smoothed P/E multiple as rich as 24.9x — the highest trough multiple was 21.2x back in that 2000-2003 tech wreck bear market. The average trough in the 8-recessionary bear markets back to 1960 is 12.8x and the median is 13.5x.” – David Rosenberg
Throughout history, earnings are very predictable. Using the analysis above, we can “guesstimate” the decline in earnings, as well as the potential decline in stock prices to align valuations. The chart below is the long-term log trend of earnings versus its exponential growth trend.
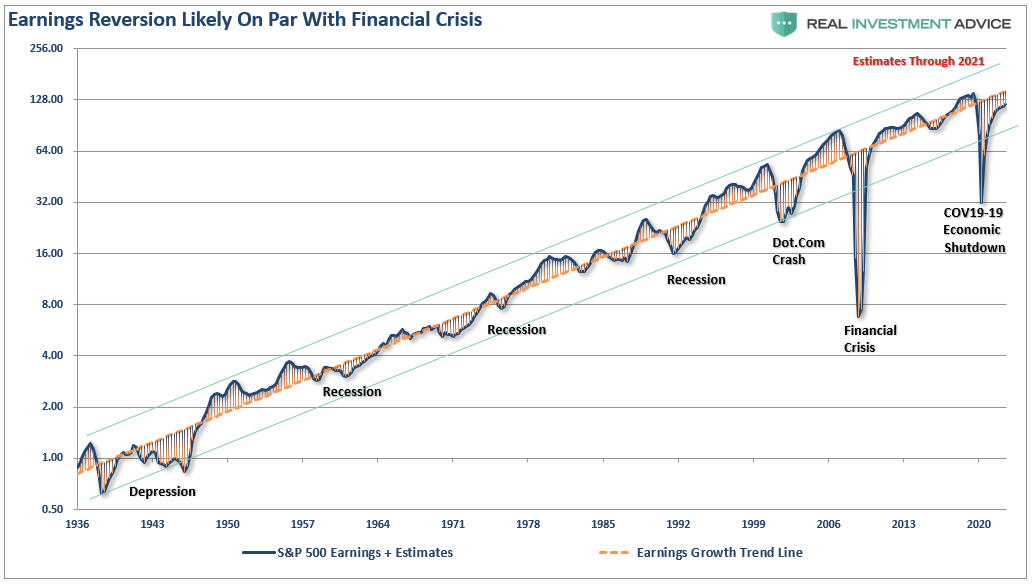
In early March, as the viral impact was just setting in, we made an early assumption of the impact on earnings. Needless to say, we were overly optimistic. To wit:
“Using that historical context, we can project a recession will reduce earnings to roughly 100/share. The resulting decline asset prices to revert valuations to a level of 18x (still high) trailing earnings would suggest a level of $1800 for the S&P 500 index.”
Again, I am not “overly dramatic” or “super bearish.” I am also not saying the index is going to 1800.
What I am saying is there is a good bit of data to support the thesis that a much larger earnings decline is in process, and markets will have to adjust to bring valuations in line with earnings.
That is just how markets work both with, and without, the Fed.
However, given the horrific data we now have coming in, we already know our previous estimates of $100/share were too high. A more realistic, and still overly optimistic of a 50-60% decline in earnings, makes current valuations even more difficult to support. (Using the chart and table below, you can pick your price and valuation level.)
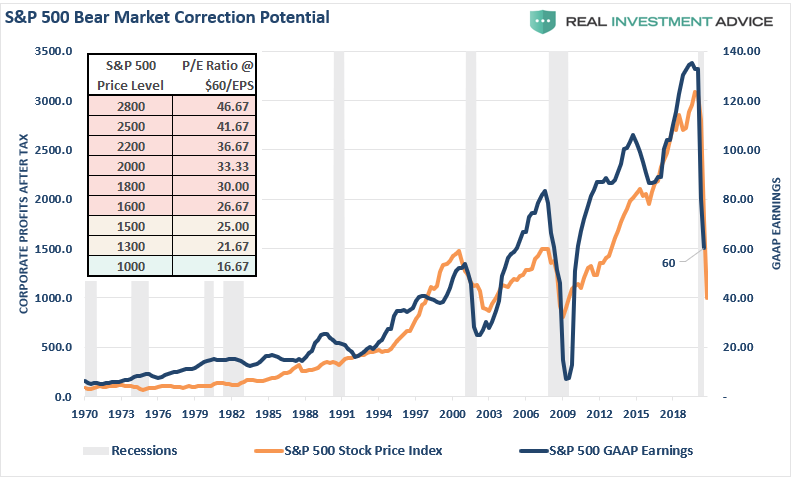
Whether its corporate profits, earnings, or GDP, no matter how you analyze the data, it suggests the outlook for stocks going into the summer is not favorable.
While it certainly seems to be a simple formula that as long as the Fed remains active in supporting asset prices, the deviation between fundamentals and fantasy doesn’t matter. It has been a hard point to argue as of late..
However, what has started, and has yet to complete, is the historical “mean reversion” process which has always followed bull markets. This should not be a surprise to anyone, as asset prices eventually reflect the underlying reality of corporate profitability and earnings.
Recessions reverse excesses.

