
During the past couple of months, I discussed why the 35% decline in March was only a “correction” and not a “bear market.” Technically speaking, margin debt also confirms the bull market remains intact. However, therein also lies the risk of the next correction.
As noted previously in “March Was Only A Correction,” there is a significant difference.
“The distinction is essential.
- ‘Corrections’ generally occur over short time frames, do not break the prevailing trend in prices, and are quickly resolved by markets reversing to new highs.
- ‘Bear Markets’ tend to be long-term affairs where prices grind sideways or lower over several months as valuations are reverted.
Using monthly closing data, the “correction” in March was unusually swift but did not break the long-term bullish trend. Such suggests the bull market that began in 2009 is still intact as long as the monthly trend line holds.
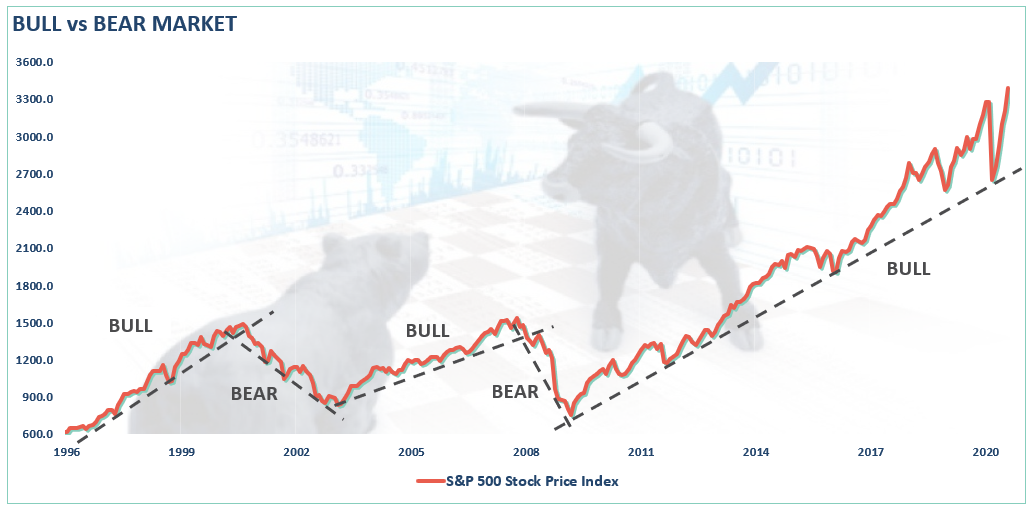
Margin debt is also confirming that March was just a correction.

The Issue Of Margin Debt
Margin debt is not a technical indicator for trading markets. What margin debt represents is the amount of speculation that is occurring in the market. In other words, margin debt is the “gasoline,” which drives markets higher as the leverage provides for the additional purchasing power of assets. However, “leverage” also works in reverse as it supplies the accelerant for more significant declines as lenders “force” the sale of assets to cover credit lines without regard to the borrower’s position.
The last sentence is the most important. The issue with margin debt, in particular, is that the unwinding of leverage is NOT at the investor’s discretion. It is at the discretion of the broker-dealers that extended that leverage in the first place. (In other words, if you don’t sell to cover, the broker-dealer will do it for you.) When lenders fear they may not be able to recoup their credit-lines, they force the borrower to either put in more cash or sell assets to cover the debt. The problem is that “margin calls” generally happen all at once, as falling asset prices impact all lenders simultaneously.
Margin debt is NOT an issue – until it is.
Event Risk
It is when an “event” causes lenders to “panic” that margin becomes problematic.
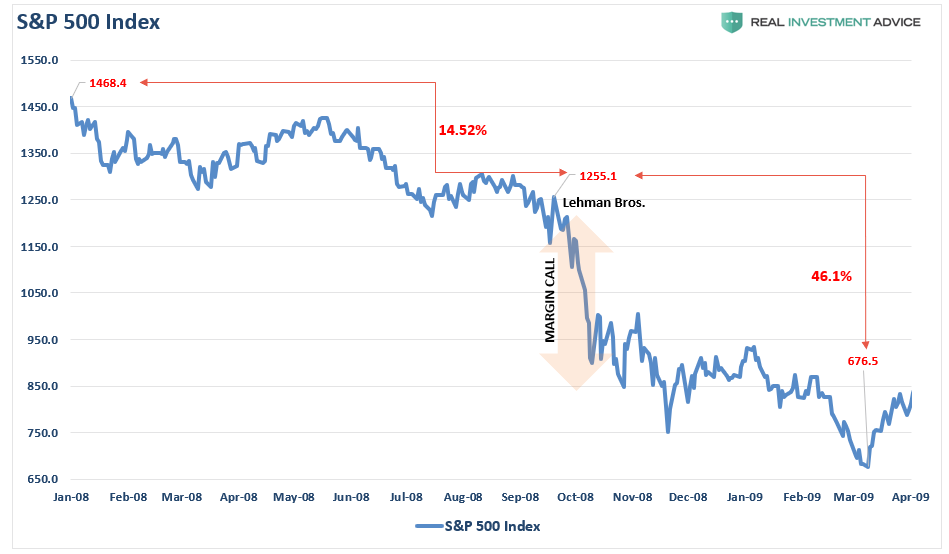
We have seen margin liquidation events twice in the last 15-years. The first was during as the 2008 financial-crisis forced Lehman into bankruptcy.
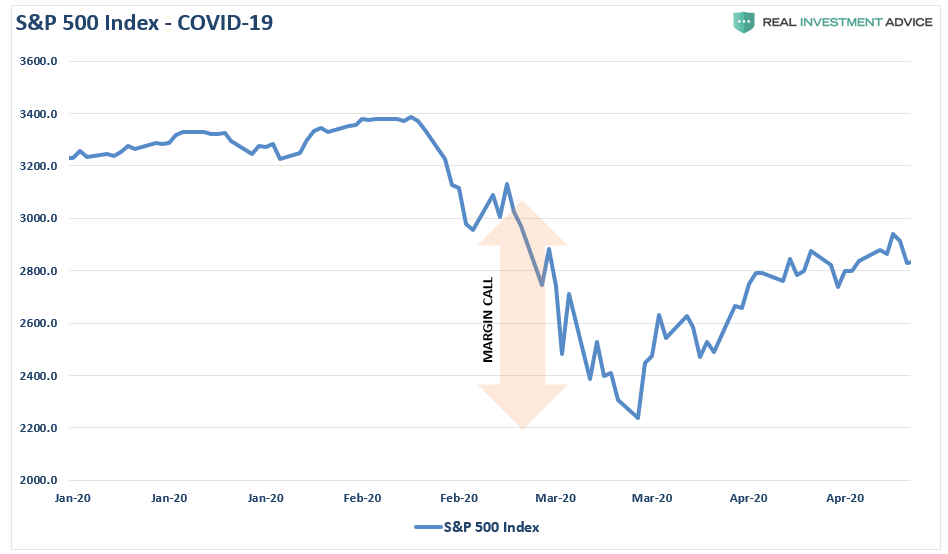
The second time was in March of this year.
How do we know that March was a “Margin Call?”
There are two reasons.
- The Fed rushed to the rescue of the banks (again) as credit risk went parabolic; and,
- The chart below of “free credit” balances shows the massive liquidation of margin debt as brokerage firms called in credit lines.
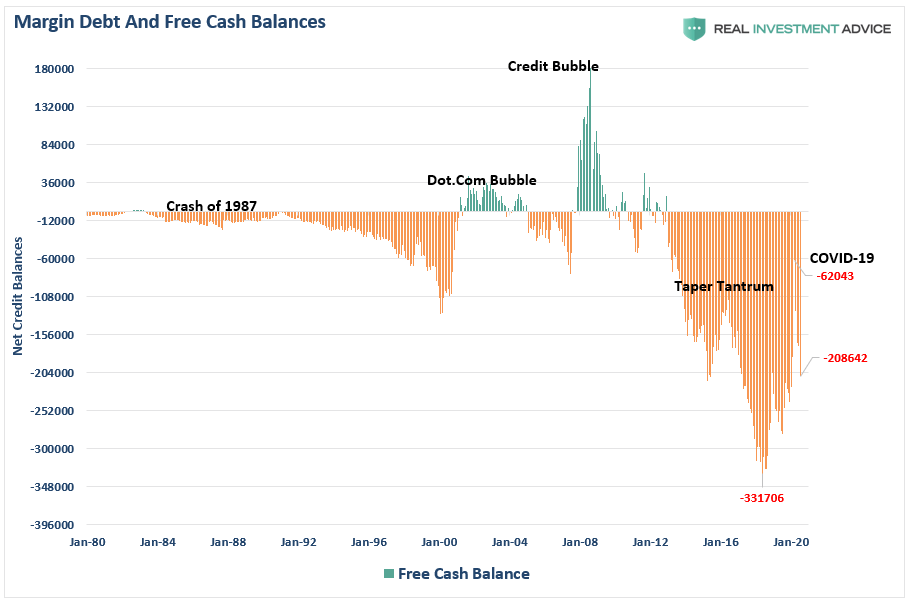
Free credit balances are crucial as it is the difference of “unused margin plus cash,” which gets subtracted from “outstanding margin.” In other words, like a credit card with a zero balance, when the lined gets paid off, there is a positive free cash balance; when it is negative, it shows the utilization of the “credit.”
The chart below overlays the two:
- The actual level of margin debt, and;
- The level of “free cash” balances.
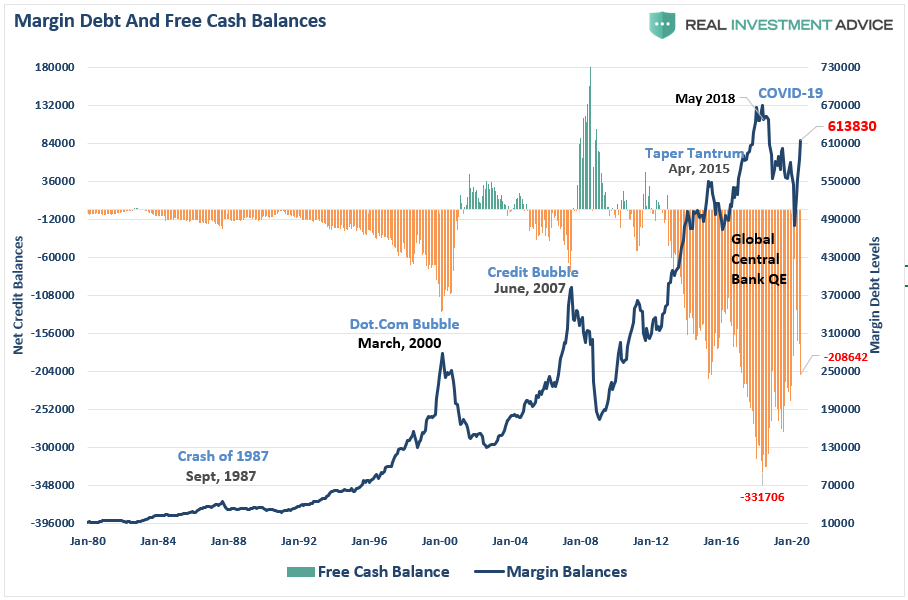
What is immediately recognizable is that reversions of negative “free cash” balances have led to severe implications for the stock market, just as we saw in March. Importantly, margin debt was already warning about the potential risk from the peak in 2018, something we discussed later that year.
Margin Debt Confirms Correction
Notably, the decline in margin debt in March also confirms the decline was a “correction” and not a full-fledged “bear market.”
The chart shows the relationship between cash balances and the market. I have inverted free cash balances, so the relationship between increases in margin debt and the market is better represented.

Note that during the 1987 correction, the 2015-2016 “Brexit/Taper Tantrum,” the 2018 “Rate Hike Mistake,” the “COVID Dip,” the market never broke its uptrend, AND cash balances never turned positive.
Both a break of the rising bullish trend and positive free cash balances were the hallmarks of the 2000 and 2008 bear markets.
Had such occurred, the positive free cash balances, and significantly reduced valuation levels, would have been supportive of the beginning of a longer-term bull market. However, with negative cash balances surging and extreme deviations from long-term means, investors are likely once again set up for another reversion. Such is not even to mention the long-term correlations to valuations.
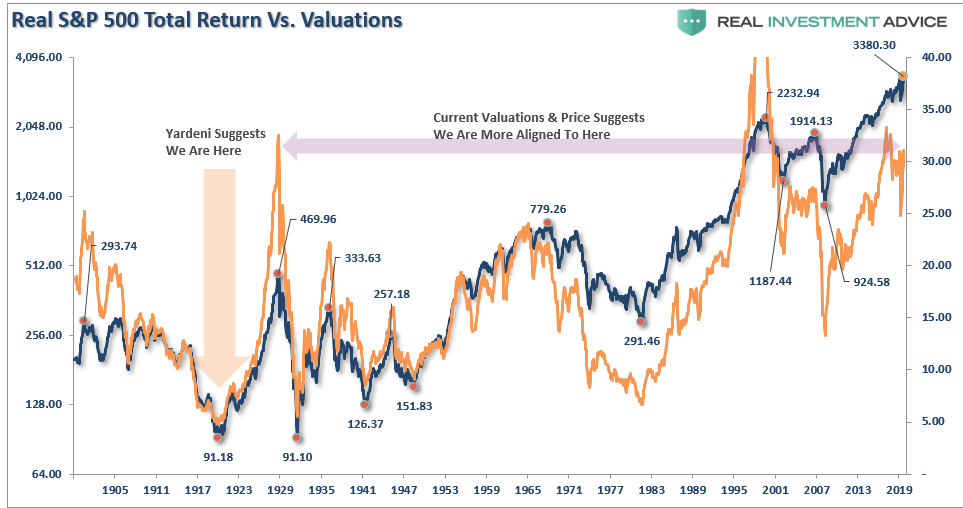
As noted in “Why This Isn’t 1920,” the highest correlation between stock prices and future returns comes from valuations.
Technically Speaking
Margin data goes back to 1959, so we can get a long-look at margin debt and its relationship to the market. The chart below is a “stochastic indicator” of margin debt overlaid against the S&P 500. (Note: Margin data is only current through July. Therefore, the 6% advance in the market has likely pushed margin debt back towards 100.)
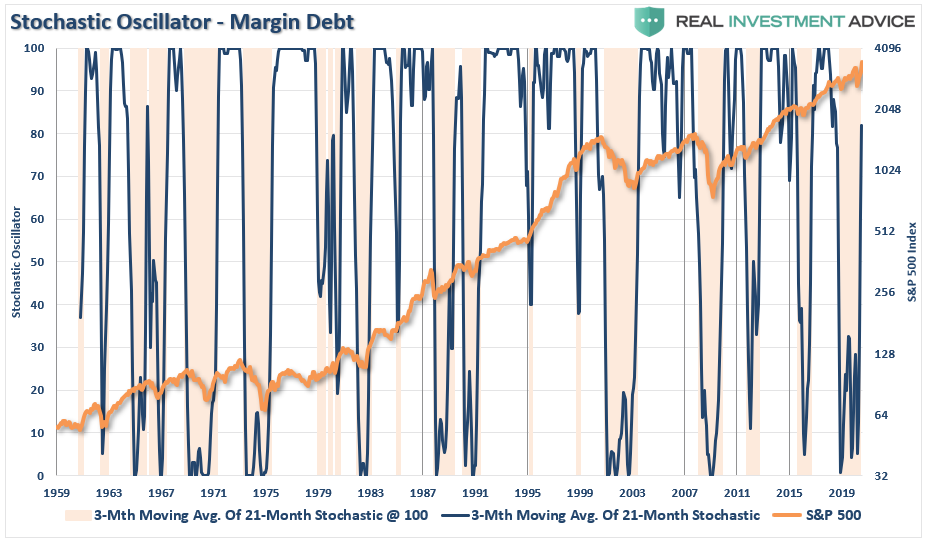
The stochastic indicator is a momentum indicator developed by George C. Lane in the 1950s. In this case, it shows the position of the most recent margin debt level relative to its previous high-low range. The indicator measures the momentum of margin debt by comparing the closing level with the range over the past 21-months.
The stochastic indicator represents the speed and momentum of margin debt level changes. Such means the stochastic indicator changes direction before the market. As such, it can be considered a leading indicator.
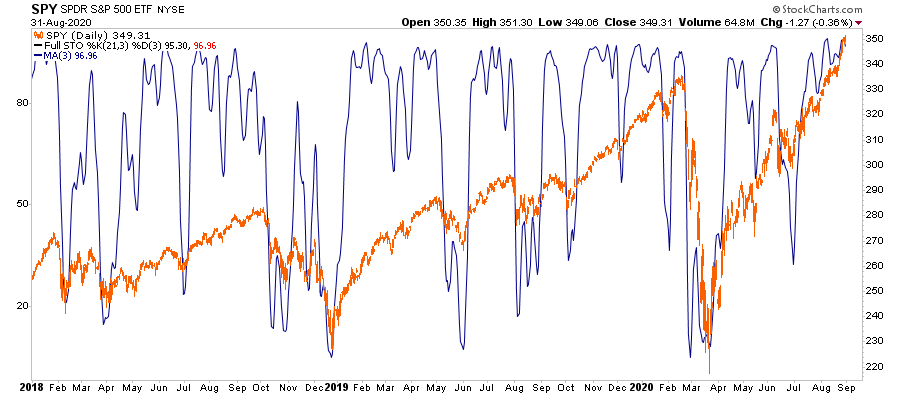
As noted above, it is very likely with the surge in August; the indicator is back to overbought levels, which suggests market risk has risen also. Our stochastic measures of the market itself are confirming much the same.
It’s All Coincident
I want to make a critical point here. Margin debt, like valuations, are “terrible market timing” indicators and should not be used as such. Valuations, margin debt, and other technical ratios are more “coincident” indicators at best.
Rising levels of margin debt are a measure of investor confidence. Investors are more willing to take out debt against investments when shares are rising, and they have more value in their portfolios against which they can borrow. However, the opposite is also true as falling asset prices reduce the amount of credit available, and the liquidation of assets must occur to bring the account back into balance.
I both agree and disagree with the idea that margin debt levels are simply a function of market activity and have no bearing on the outcome of the market.
As we saw in March, the double-whammy of collapsing oil prices and economic shutdown in response to the coronavirus triggered a sharp sell-off fueled by margin liquidation.
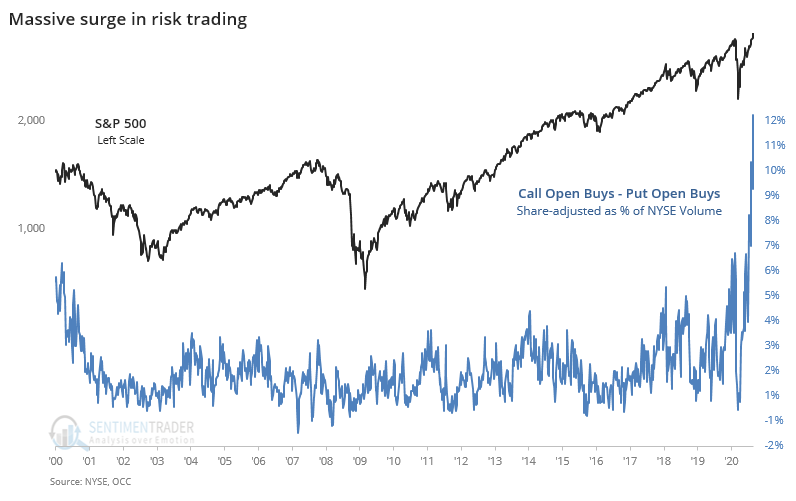
Currently, the majority of investors have forgotten about March. Or worse, assume it can’t happen again for a variety of short-sighted reasons. However, the “gas tank” is nearly full once again as investors are more exuberant now than at the peak of the market previously, as noted by Sentiment Trader yesterday.
Excuses Won’t Work
Sure, this time could indeed be different. That has remained the “sirens song” of investors since March. However, as Sentiment Trader summed up, this is usually not the case.
“Whenever some of this data fails to lead to the expected outcome for a few weeks or more, we hear the usual chorus of opinions about why it doesn’t work anymore. This has been consistent for 20 years, like…
- Decimalization will destroy all breadth figures (2000)
- The terror attacks will permanently alter investors’ time preferences (2001)
- The pricking of the internet bubble will forever change option skews (2002)
- Easy money will render sentiment indicators useless (2007)
- The financial crisis means relying on any historical precedents are invalid (2008)
- The Fed’s interventions mean any indicators are no longer useful (2010 – present)
All of these sound good, and for a time it seemed like they were accurate. Then markets would revert and the arguments would get swept into the dustbins of history.”
It’s not too late to take action to preserve capital now, so you have the capital to invest later.
Winter Is Coming
As noted in this past weekend’s newsletter “Winter Is Coming:”
“While we remain long-biased in our equity portfolios, we have begun to ‘harvest’ some of our big winners (take profits), and do some ‘winter preparation’ by adding to our defensive ‘value’ oriented positions, and our risk hedges.
In the short-term, this will indeed provide some drag between our portfolio and the major market index. However, when the first ‘cold snap’ washes across the markets, our preparation should protect our garden from ‘frostbite.’
We indeed remain ‘bullish’ on the markets currently as momentum is still in play. However, just as any farmer is keenly aware of the signs ‘Winter’ is approaching, we are just taking some precautionary actions. As noted last week:
‘If you wait for the “blizzard” to hit, it will be too late to make much difference.’”
While margin debt is a function of the ongoing mania, it just one indication of excess. Currently, if you only take the opportunity to look, there are many signs the last days of summer are drawing to a close.

