
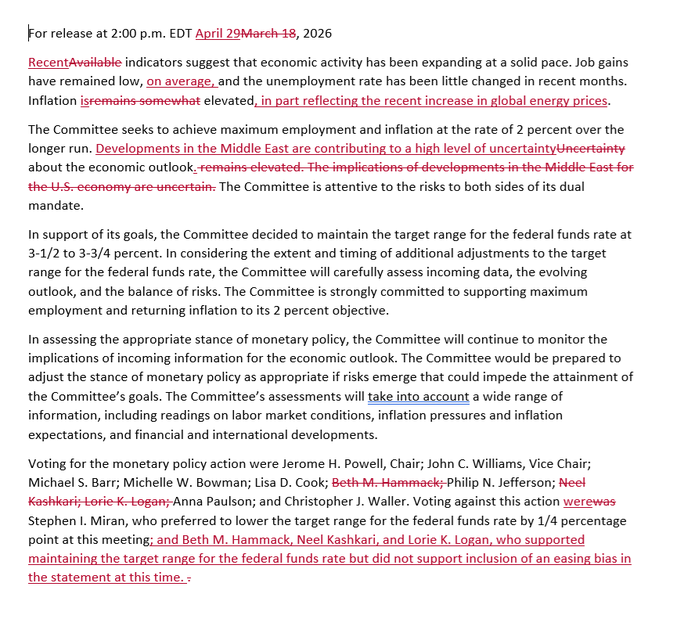
Presuming Kevin Warsh’s nomination as Fed Chair is approved by the Senate, as is widely expected, yesterday’s FOMC meeting was Jerome Powell’s last as its Chair. However, he will stay on as a voting Governor. As he explains: Things that happened in the last 3 months left me no choice but to see them through at least that long.” His personal forecasts and opinions on future monetary policy were less important than they were at prior meetings. But the FOMC meeting statement, which represents the views of the voting members, was very telling.
As seen at the end of the statement, in the graphic below, there were four dissenting votes, the most since 1992. Stephen Miran voted to cut rates by 0.25%, as he has in the last few meetings. More interestingly, three voters, Beth Hammack, Neel Kashkari, and Lori Logan, agreed with no change to the Fed Funds rate but dissented on the vote because they did not support what they viewed as an easing bias in the statement. They took offense at the following sentence:
The Committee is attentive to the risks to both sides of its dual mandate.
Given that the three dissenters have recently voiced inflationary concerns, their dissents represent a new hawkish bias toward potentially raising rates. With Powell lingering at the Fed and the three hawkish dissents, Warsh will have trouble forming a consensus to cut rates. To wit, the Fed Funds futures markets now price in a 88% chance the Fed doesn’t change rates by the end of January 2027 and a slight 12% chance of a rate hike. Given the widely differing opinions of FOMC voting members, Fed meetings are likely to become less predictable, which may lead to more volatility in the stock and bond markets. That said, a resolution of the Iranian conflict and lower oil prices could bring a consensus back to the Fed.
What To Watch Today
Earnings

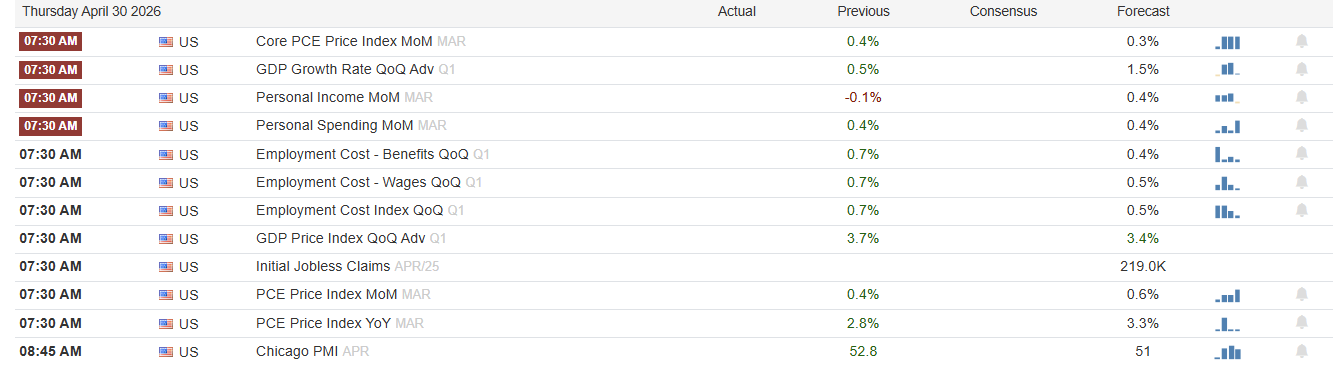
Economy
Market Trading Update
Yesterday, we discussed the preview of last night’s earnings bonanza and Powell’s last Fed meeting(noted above). Tonight, we will continue the earnings parade with Apple (AAPL), Ely Lilly (LLY), and Caterpillar (CAT), among many others. However, the most dangerous place in any market is wherever the crowd has agreed to stand. When positioning gets one-sided, the unwinds are violent and unforgiving. Silver’s collapse last fall is the cleanest recent example. The setup looked unstoppable, until it didn’t.
The April Bank of America Global Fund Manager Survey, drawn from 193 managers running $563 billion, gives us the cleanest read on where consensus has piled in. “Long oil” and “long global semiconductors” now share the top spot as the most crowded trades, each cited by 24% of respondents. “Long gold,” which dominated this list for most of 2025, has slipped to 15%. “Long Magnificent 7,” once the consensus trade with 54% of managers crowded into it back in December, has collapsed to just 9%.
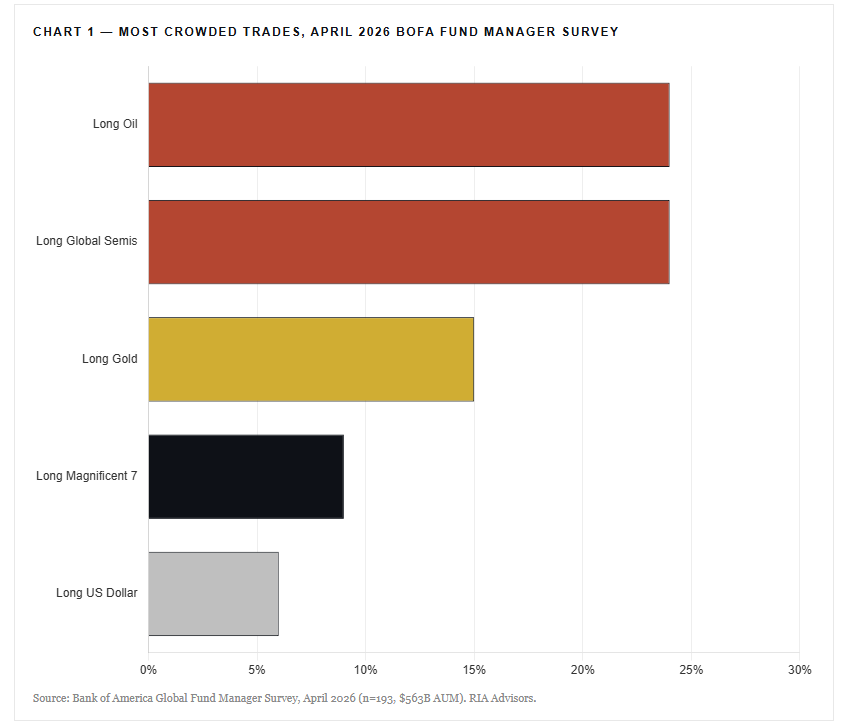
That last shift is the real story under the surface. The trade everyone was selling each other on six months ago is barely on the radar today. Capital didn’t disappear. It rotated into oil and semiconductors, leaving big technology names in its wake.

The hedge fund positioning data confirms the rotation. Morgan Stanley’s prime brokerage data shows that hedge funds have aggressively bought Energy over the last two weeks. Net exposure to the sector is at twelve-month highs, with funds the most overweight Energy relative to its Russell 3000 weight in any month over the past year. That reading sits in the 98th percentile.

Here’s the problem with all this. Oil is not gold, and gold is a passive store of value and a sentiment hedge. Furthermore, oil sits at the heart of the inflation and growth transmission channel and a 10% move in crude doesn’t wash out. It shows up in CPI prints, gasoline retail data, and earnings guidance for half the consumer-facing economy. Crowding into oil right as it becomes the consensus geopolitical hedge is the opposite of a hedge. It’s a leveraged macro bet wearing a defensive costume.
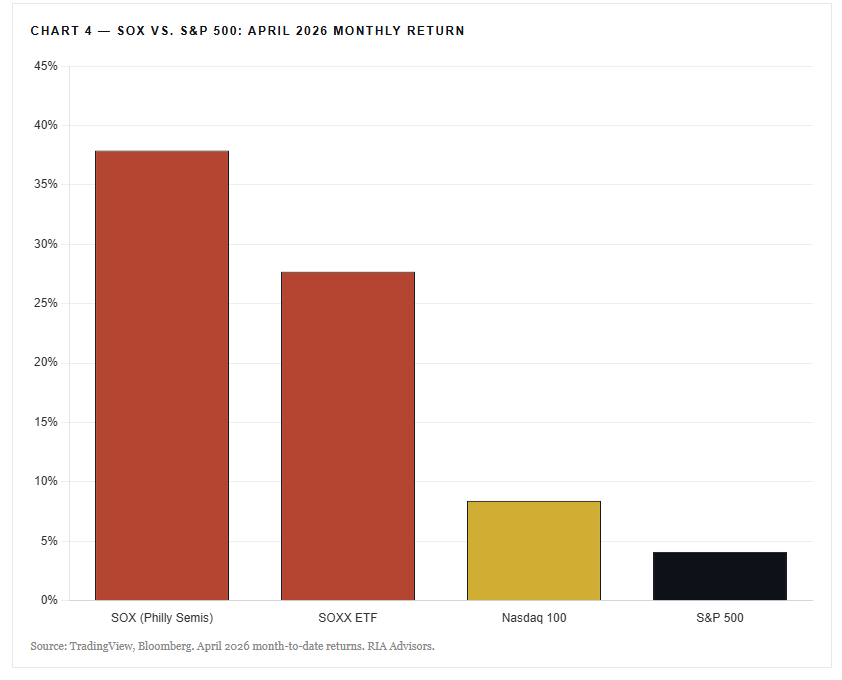
Semiconductors carry the same risk in a different jacket, and the moves of the past month make caution explicit. The Philadelphia Semiconductor Index (SOX) has logged 18 straight green sessions, the longest winning streak in its 32-year history. SOX is up roughly 38% in the past month and 148% over twelve months, hitting a record 10,564 on April 24th. The iShares Semiconductor ETF (SOXX) gained 27.7% in April, its largest monthly return since BlackRock launched the fund in July 2001.
The flow data confirms the chase. SOXX pulled in $2.05 billion in April alone, more than double its previous monthly record. The VanEck Semiconductor ETF (SMH) absorbed another $3.4 billion. Combined, the two funds raised $5.45 billion in a single month, a record for the category. Names below the megacap line have gone vertical: Astera Labs +79%, Marvell +53%, Intel +51%, all in April alone. The AI capex story is real. The earnings are there. But when retail sentiment for SOXX screens “extremely bullish” on every monitoring tool while Michael Burry quietly loads $330 puts on the same fund, the setup for a violent mean reversion is textbook. The trade is no longer asymmetric. It’s late.
So, where is the next trade? The most likely answer is the trade everyone just left. The Magnificent 7 still owns the earnings story. FactSet’s bottom-up estimates put 2026 Mag 7 earnings growth at 22.8%, compared with 12.1% for the other 493 names in the S&P 500. Forward quarters run even wider, with Mag 7 EPS growth accelerating from 14.9% in Q4 2025 to 19.7% by Q3 2026.
That fundamental gap is the gravitational pull. When only 9% of managers cite the group as crowded, when relative valuations have compressed against the broader index, and when the earnings engine still runs more than two times the rest of the market, the rotation back becomes a question of timing rather than direction. Money chases earnings growth eventually. The unwinds now building in oil and semiconductors will provide the cash. The earnings will pull it home. The crowd is rarely wrong about direction. It’s almost always wrong about timing.

Revisiting Hedges
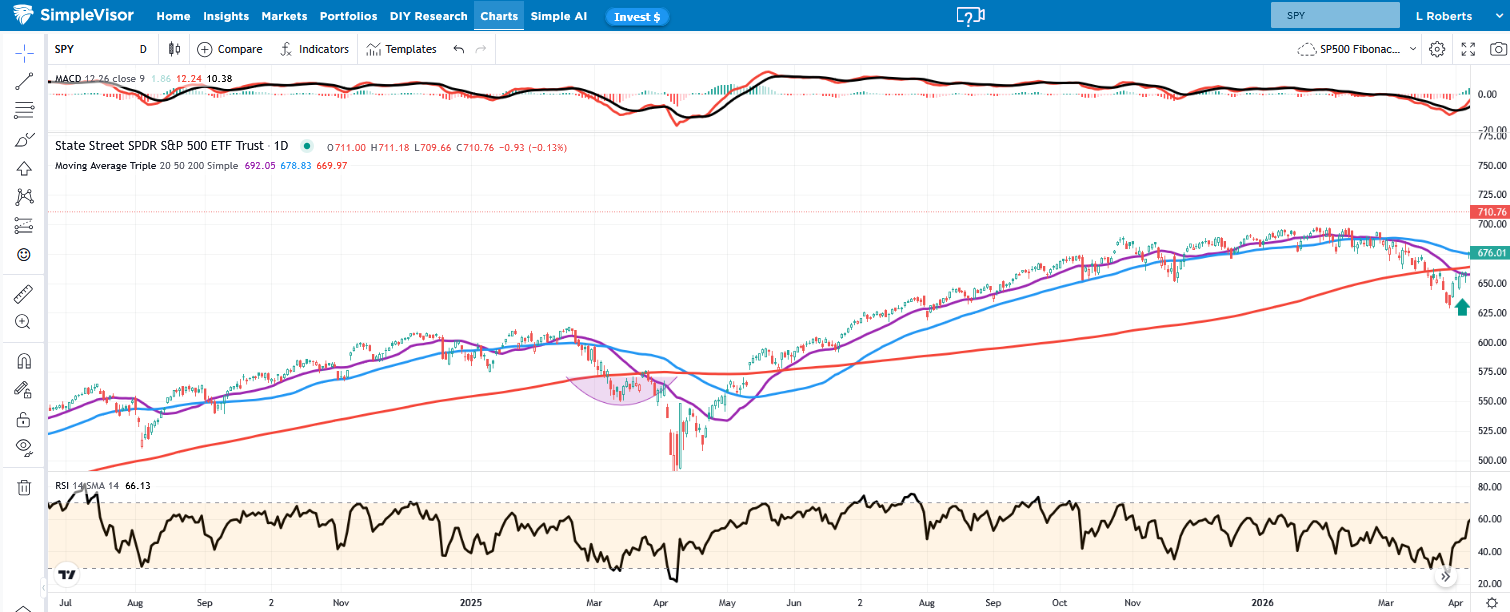
The end date on the graph below is early April. We look back in time to show what the market looked like when we added hedges to our core portfolios. Going into the hedging decision, the S&P 500 had traded below its 200-day moving average for almost two weeks. Further, prior to adding the hedges, it had rallied back to the 200-day moving average. As the graph highlights, amid tariff concerns in April 2025, the market behaved similarly, with the price rejecting the 200-day moving average and falling sharply. Our concern was a similar rejection of the key moving average, followed by a replay of that event. Furthermore, amid the ongoing conflict in Iran, there were geopolitical concerns and oil-related economic risks to consider. A cease-fire was agreed upon days later, and the market zoomed to record highs. We removed the hedges right after the agreement was announced, when the S&P 500 was trading decently above its 200-day moving average.
Looking back at the hedge trades can be instructive.
- The hedges were relatively small, thus not nearly enough to shield our portfolios from losses or inhibit gains. We certainly had lots of room to sell or add more hedges if needed.
- Our concern was broad-based selling, or systematic risk, not losses due to the idiosyncratic, or company-specific risk of any of our holdings. Thus, the hedges allowed us to reduce risk on the margin and keep our portfolio intact.
- The hedges were not put on in anticipation of a full-blown bear market, but were intended to shield our portfolios from geopolitical volatility.
- We are better off that the hedges didn’t work. Yes, we took a slight loss on the hedges, but our portfolios fully participated in the upside over the last few weeks.
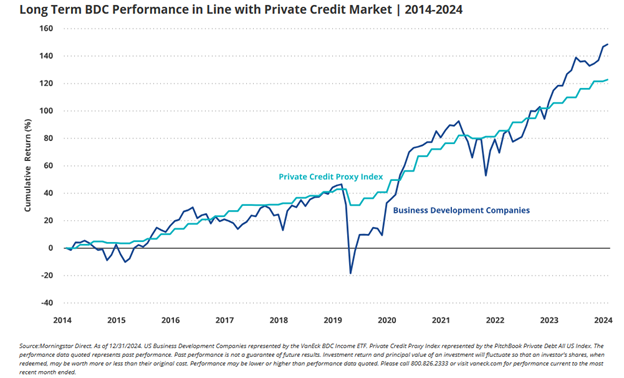
BDCs: Not All Yield Is Created Equal
Gated funds, collateral fraud, and auto-sector defaults are giving investors in private credit funds and their stock-market equivalents, business development corporations (BDCs), a headache.
We have discussed the recent woes of private credit funds (HERE, HERE, HERE), yet we haven’t addressed BDCs. The similarities and differences between private credit funds and BDCs are important. For instance, the bad press about the widespread gating of private credit funds. While BDCs own similar assets, they trade on a stock exchange. Thus, investors who want to sell don’t have to rely on a fund manager’s whim; they can sell their shares in seconds.
The poor sentiment toward private credit funds has dragged down many high-quality BDCs, as well as weaker ones. The chaos and bad press surrounding private credit funds are not reasons to avoid BDCs. In fact, we think it’s a reason to consider it.
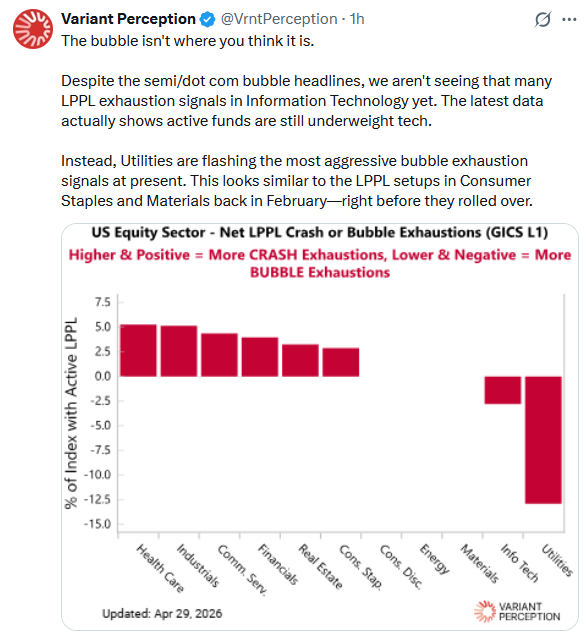
Tweet of the Day
“Want to achieve better long-term success in managing your portfolio? Here are our 15-trading rules for managing market risks.”
Please subscribe to the daily commentary to receive these updates every morning before the opening bell.
If you found this blog useful, please send it to someone else, share it on social media, or contact us to set up a meeting.

