


The Fed has raised rates by 5.50% in a little over a year. For the most part, during that period, Fed members were on the same page about their resolve to quickly bring inflation back to 2%. With inflation trending in the right direction, the end of the rate hiking cycle is near. However, there appear to be two camps emerging, the doves and the hawks, with differing opinions on what to do next. We think this battle will become more pronounced over the coming months. Therefore, understanding the dove’s and the hawk’s points of view is critical to forecasting monetary policy.
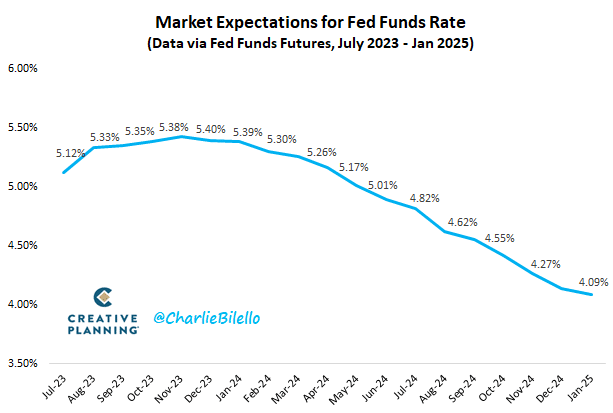
Unlike the hawks, the doves think inflation will continue to trend lower, with small odds of an echo bounce in inflation. As such, their predominant goal is avoiding a recession. Cutting rates sooner will help offset the inevitable lag effects of the prior rate hikes that will become an economic headwind. The hawks, unlike doves, are concerned that inflation may bounce back as it did numerous times in the 1970s. Powell and others seem content waiting until 2025 for rate cuts. They are in the “do whatever it takes,” including a recession and higher employment to kill high inflation camp. Inflation and employment data will guide the doves and hawks. It may further separate their opinions or merge into a more unified view. The graph below, courtesy of Charlie Bilello, shows the market expectations for the Fed.
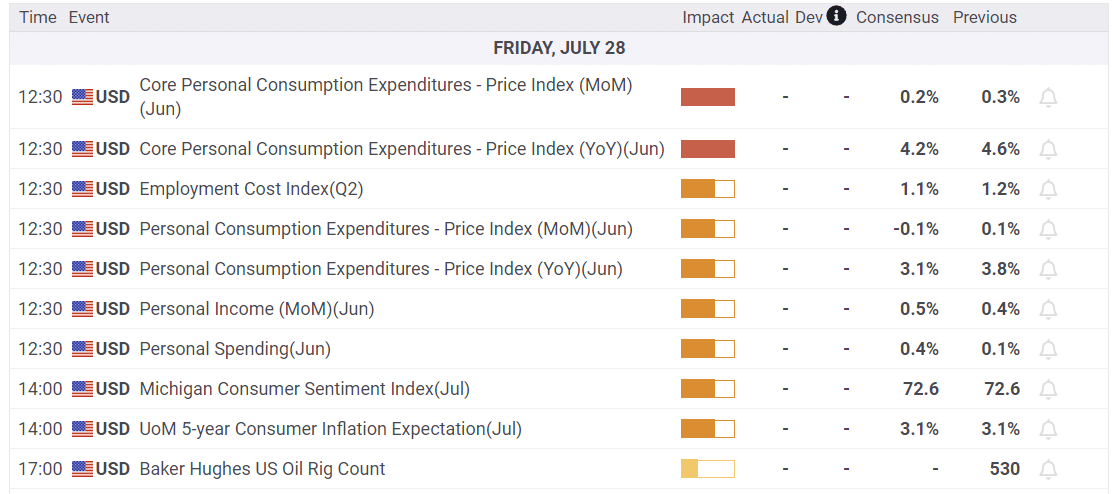
What To Watch Today
Economy
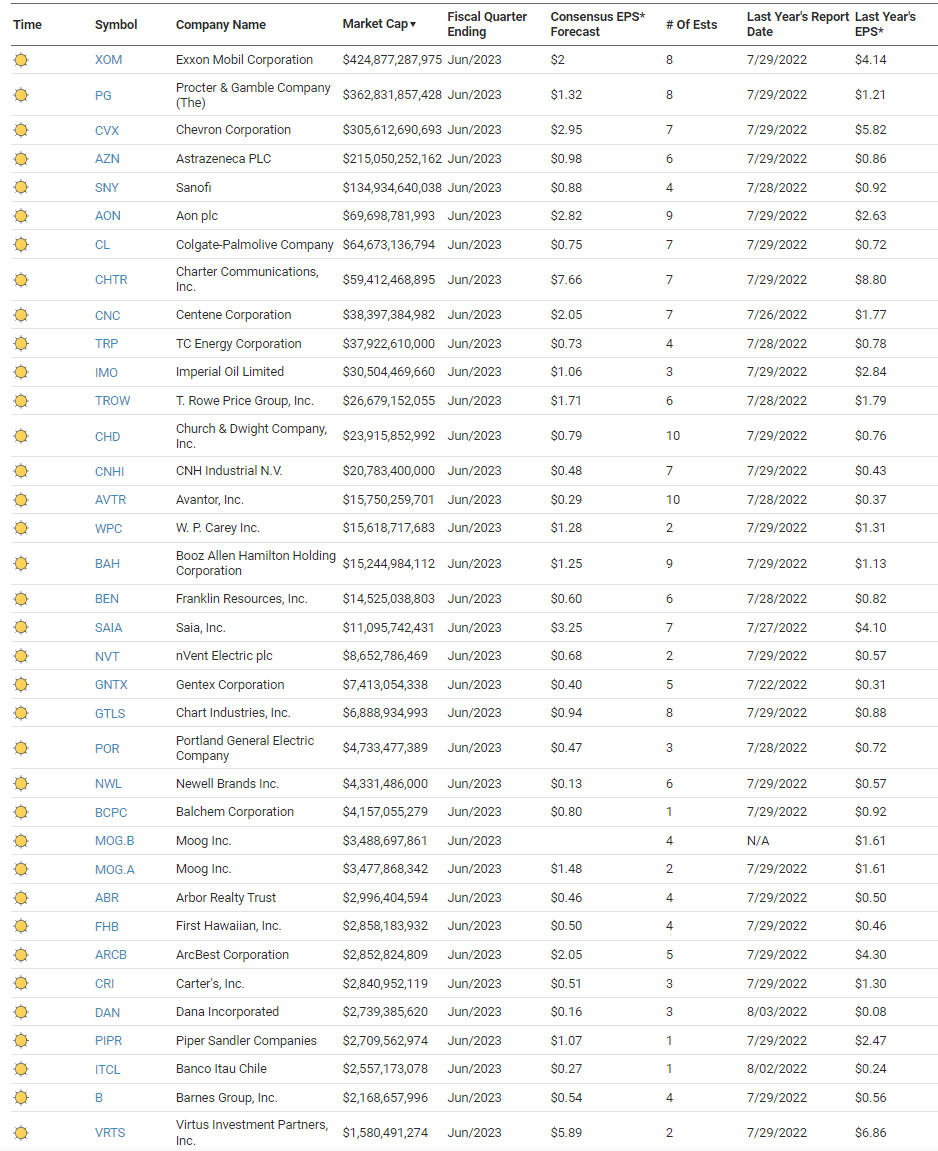
Earnings
Market Trading Update
Interesting developments over the last couple of days on the economic front continue to give the bulls support for the rally. First, the Federal Reserve now expects NO recession in their forecast, and GDP rang in at 2.4% annualized growth on a near 50% drop in the deflator. With no sign of a recession near term, inflation dropping sharply, and economic growth picking up, the bulls have continued pushing higher asset prices.
With markets well above long-term moving averages and overbought readings plentiful, we expect a correction once the earnings season is complete. As shown, the market has cleared the last Fibonacci retracement hurdle, and only minor resistance and the current trend channel stand in the way of retesting all-time highs. The deviation from the underlying moving averages is significant and, at some point, will need to be retested.
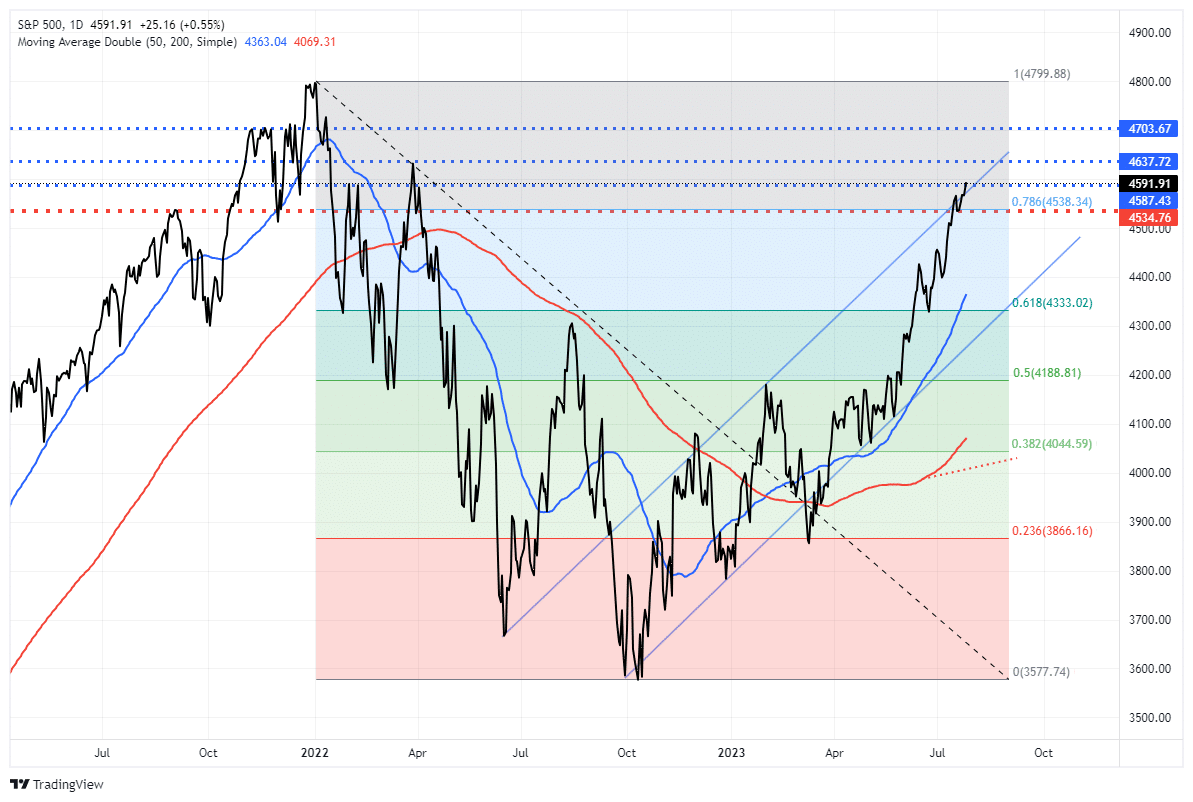
Next week, we will have the last of the mega-caps reporting, including both Apple (AAPL) and Amazon (AMZN). Once those announcements are passed, the markets will likely begin to reflect on the underlying fundamentals and economic data. Such should provide the setup needed for a short-term correction in August or September.

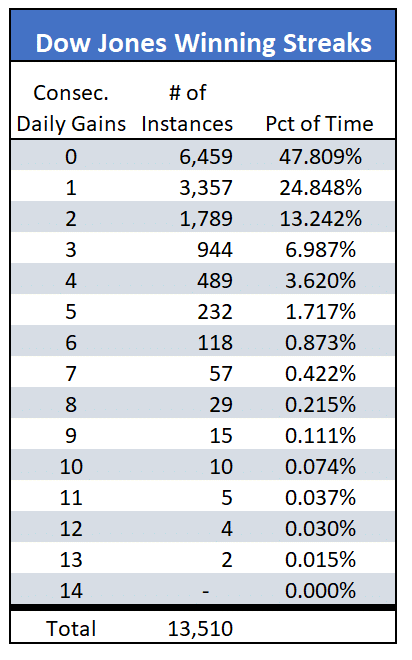
The Dow Ties A Record
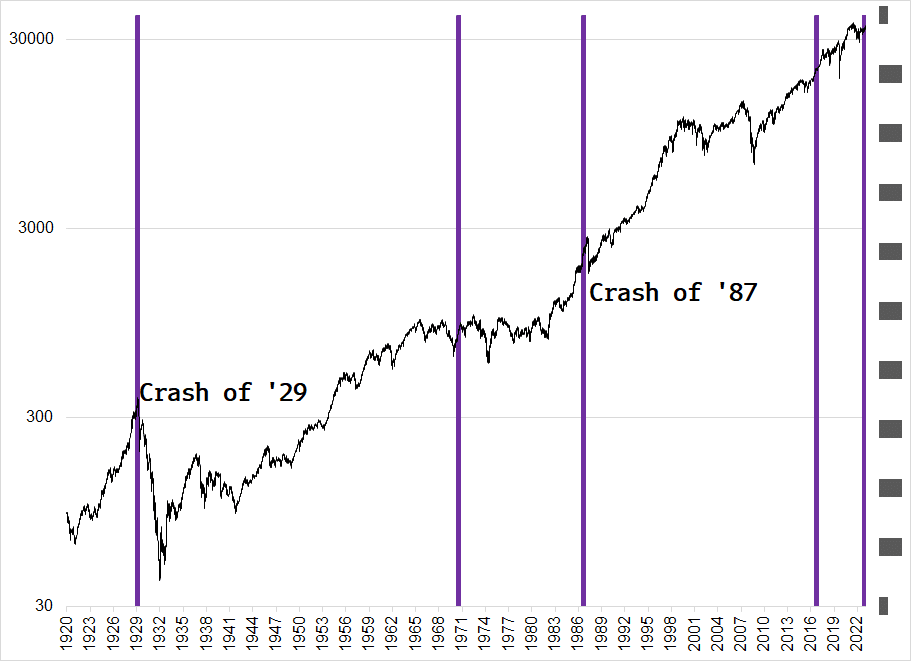
Yesterday, the Dow Jones Industrial Average closed lower for the first time 14 days. As the table below shows, the 13 day streak of consecutive gains which ended on Thursday ties only one other instance going back to 1970. The second graph, courtesy of Brent Donnelly, shows the Dow has been up 11 or more consecutive days four other times since 1920. Of those four, two preceded significant market crashes. What does it mean? There is no doubt the market is very overbought. However, we shouldn’t read anything more into the streak than a market ripe for a normal correction.
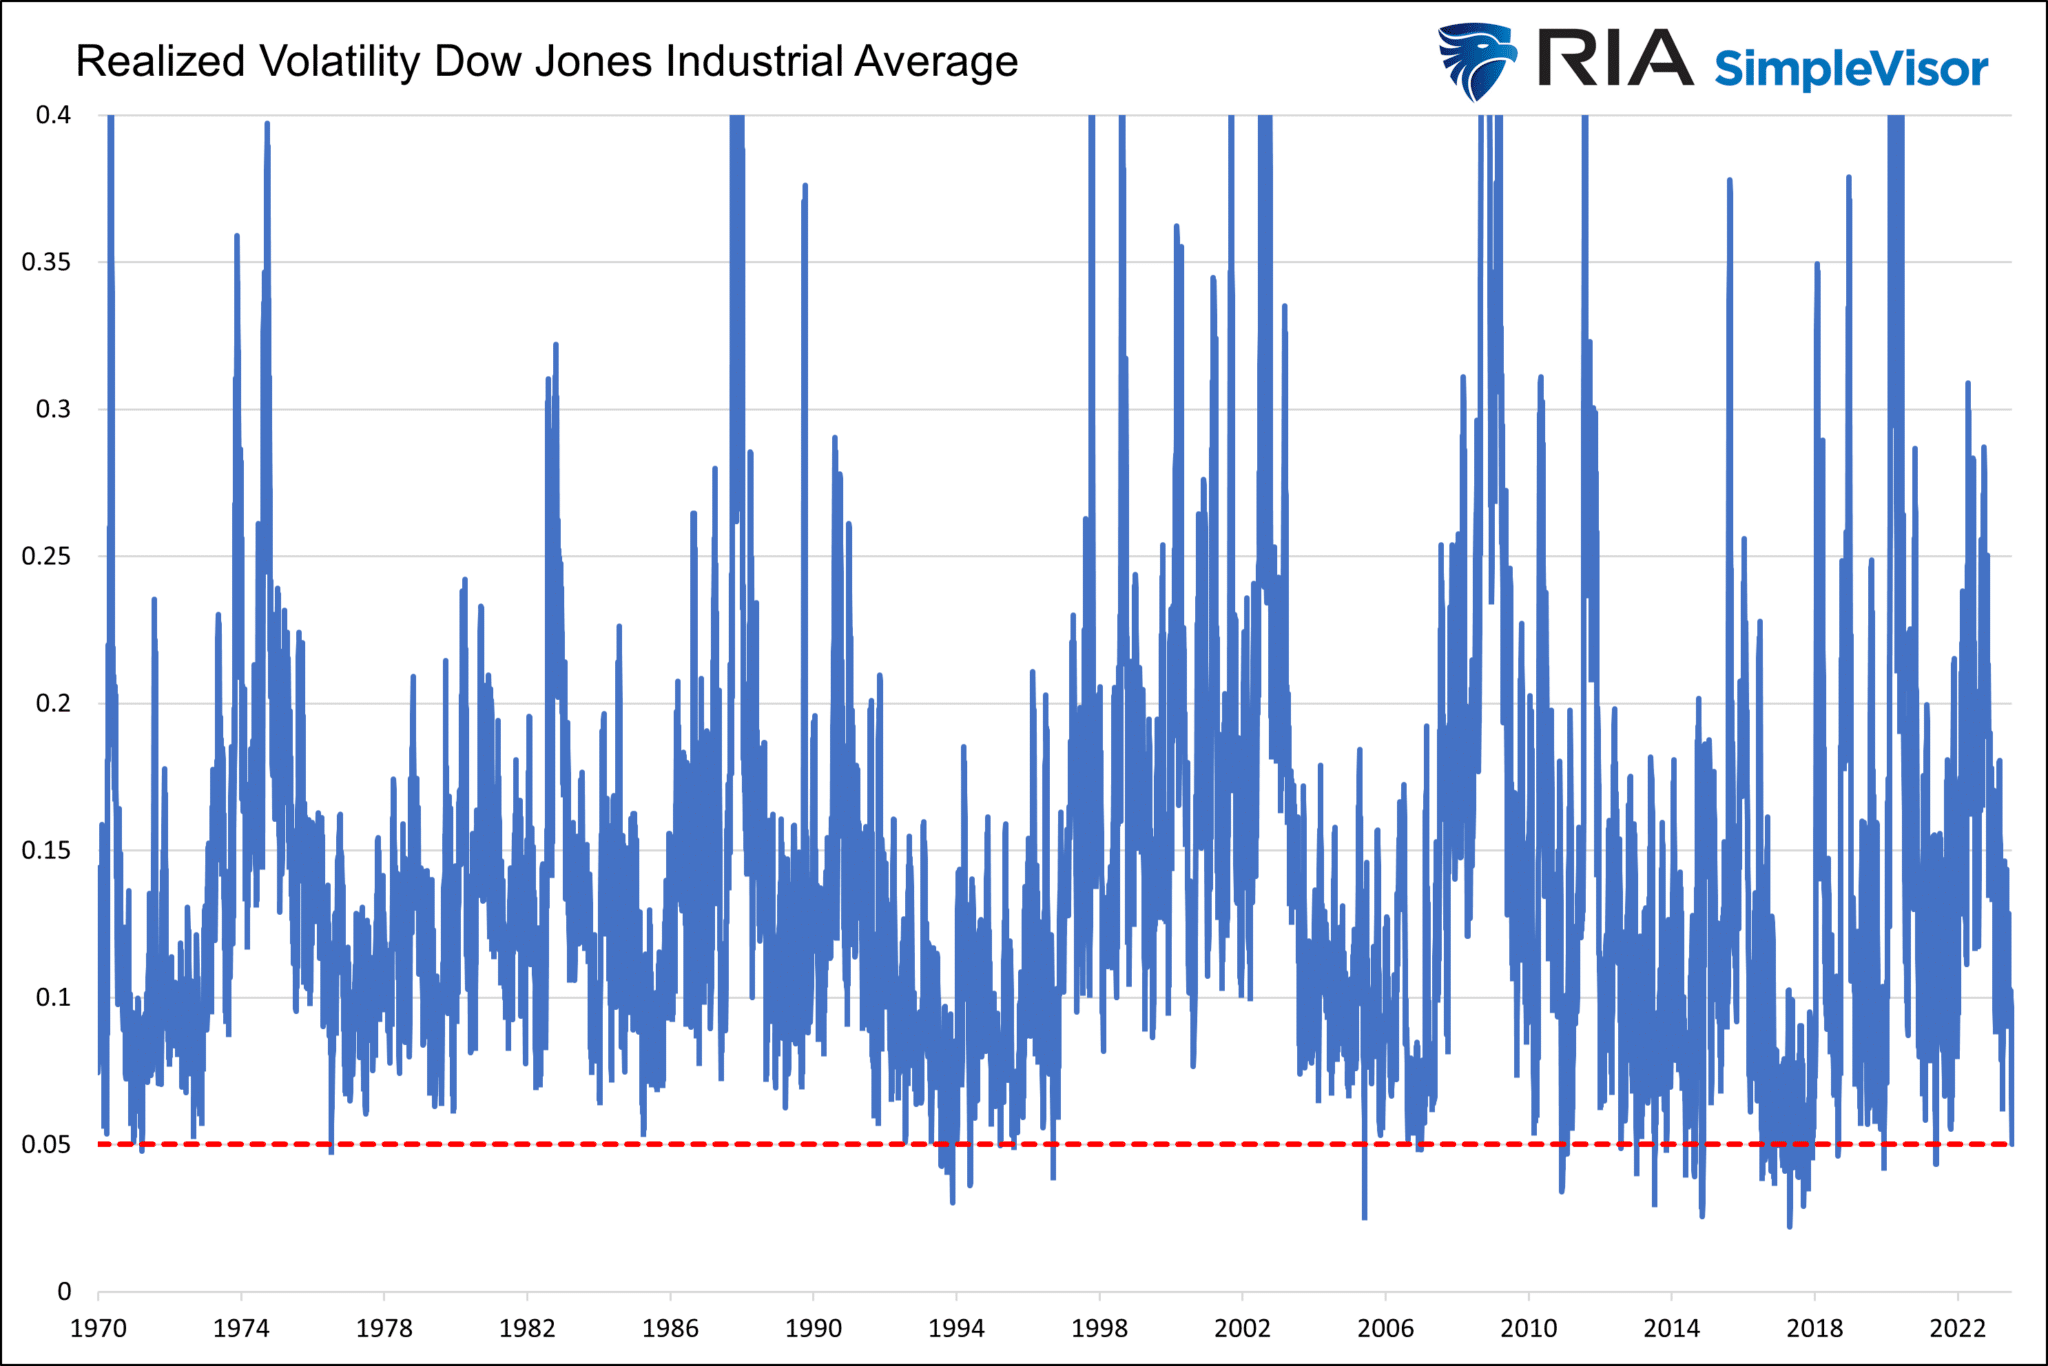
Realized Volatility Dropping With The Winning Streak
As the Dow Jones Industrial Average marches higher and higher each day, its realized volatility is declining. Since the recent winning streak began, the running 14-day annualized realized volatility is down to a mere 5.05. For context, the average since 1970 is 14.65. A reading below the current level has occurred 1.4% of the time. Implied volatility on the S&P 500 is also low. While realized volatility measures past price movements, implied volatility measures what options traders think realized volatility will be in the future. The lower the implied volatility, the more the complacency. As noted in the section above, the market is ripe for correction.
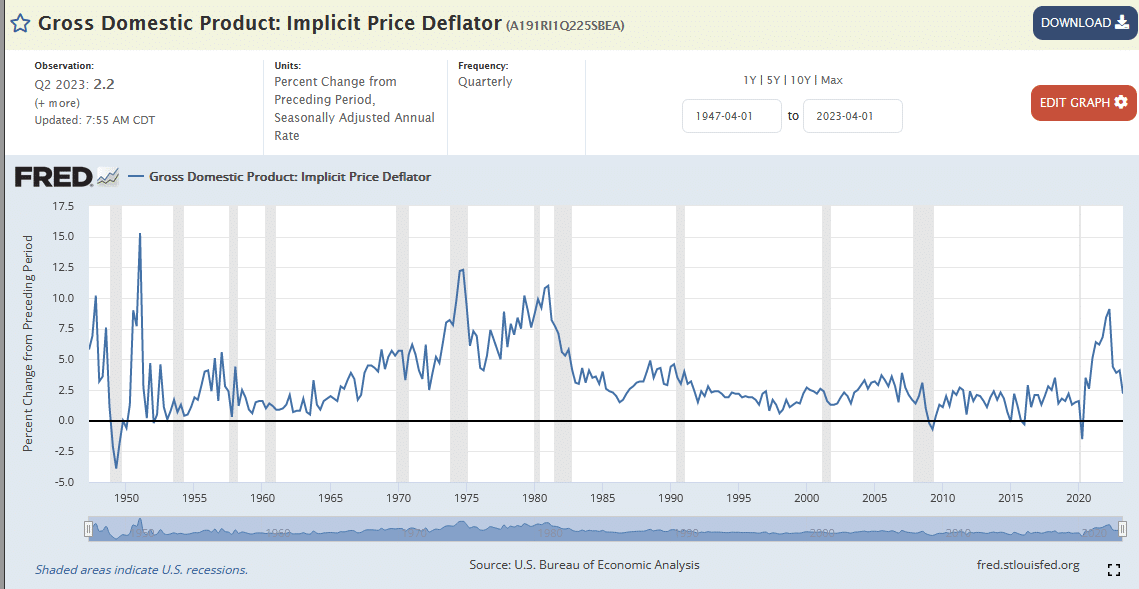
GDP Price Index Boosts GDP
Second quarter GDP beat expectations by 0.4%, coming at +2.4%. The beat was more a function of prices than actual economic activity. Analysts expected the GDP price index to be 3%. It came in at 2.2%, 0.8% below expectations. This rate is deducted from nominal GDP to arrive at the well-followed real GDP. Had the price index been 3%, real GDP would have fallen 0.4% short of expectations. Like recent CPI data, this too alludes that prices are normalizing quickly. As we show, it is back into the upper range of the band preceding the pandemic.
Tweet of the Day
Please subscribe to the daily commentary to receive these updates every morning before the opening bell.
If you found this blog useful, please send it to someone else, share it on social media, or contact us to set up a meeting.
Also Read


