
In “Part 1” of this series, I discussed at length whether Dr. Robert Shiller’s 10-year cyclically adjusted price-earnings ratio was indeed just “B.S.” The primary message, of course, was simply:
“Valuation measures are simply just that – a measure of current valuation. If you ‘overpay’ for something today, the future net return will be lower than if you had paid a discount for it.
Valuation models are not, and were never meant to be, ‘market timing indicators.'”
With that said, in this missive I want to address some of the current, and valid, arguments against a long term smoothed price/earnings model:
- Beginning in 2009, FASB Rule 157 was “temporarily” repealed in order to allow banks to “value” illiquid assets, such as real estate or mortgage-backed securities, at levels they felt were more appropriate rather than on the last actual “sale price” of a similar asset. This was done to keep banks solvent at the time as they were being forced to write down billions of dollars of assets on their books. This boosted banks profitability and made earnings appear higher than they may have been otherwise. The ‘repeal” of Rule 157 is still in effect today, and the subsequent “mark-to-myth” accounting rule is still inflating earnings.
- The heavy use of off-balance sheet vehicles to suppress corporate debt and leverage levels and boost earnings is also a relatively new distortion.
- Extensive cost-cutting, productivity enhancements, off-shoring of labor, etc. are all being heavily employed to boost earnings in a relatively weak revenue growth environment. I addressed this issue specifically in this past weekend’s newsletter:
“What has also been stunning is the surge in corporate profitability despite a lack of revenue growth. Since 2009, the reported earnings per share of corporations has increased by a total of 221%. This is the sharpest post-recession rise in reported EPS in history. However, that sharp increase in earnings did not come from revenue which is reported at the top line of the income statement. Revenue from sales of goods and services has only increased by a marginal 28% during the same period.”
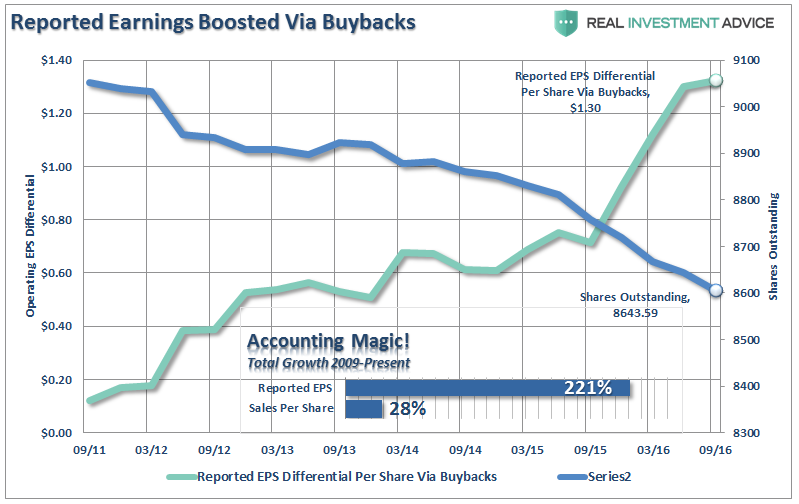
- The use of share buybacks improves underlying earnings per share which also distorts long-term valuation metrics. As the WSJ article stated:
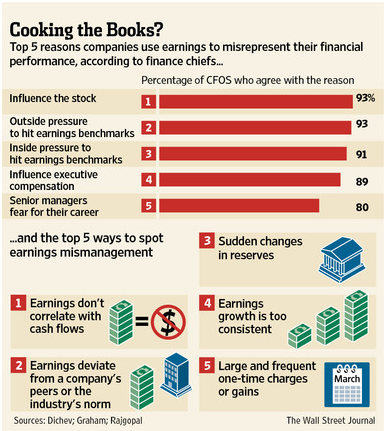
“If you believe a recent academic study, one out of five [20%] U.S. finance chiefs have been scrambling to fiddle with their companies’ earnings.
Not Enron-style, fraudulent fiddles, mind you. More like clever—and legal—exploitations of accounting standards that ‘manage earnings to misrepresent [the company’s] economic performance,’ according to the study’s authors, Ilia Dichev and Shiva Rajgopal of Emory University and John Graham of Duke University. Lightly searing the books rather than cooking them, if you like.”
This should not come as a major surprise as it is a rather “open secret.” Companies manipulate bottom line earnings by utilizing “cookie-jar” reserves, heavy use of accruals, and other accounting instruments to either flatter, or depress, earnings.
“The tricks are well-known: A difficult quarter can be made easier by releasing reserves set aside for a rainy day or recognizing revenues before sales are made, while a good quarter is often the time to hide a big “restructuring charge” that would otherwise stand out like a sore thumb.
What is more surprising though is CFOs’ belief that these practices leave a significant mark on companies’ reported profits and losses. When asked about the magnitude of the earnings misrepresentation, the study’s respondents said it was around 10% of earnings per share.“
As shown, it is not surprising to see that 93% of the respondents pointed to “influence on stock price” and “outside pressure” as the reason for manipulating earnings figures.
- The extensive interventions by Central Banks globally are also contributing to the distortion of markets.
Due to these extensive changes to the financial markets since the turn of the century, I do not completely disagree with the argument that using a 10-year average to smooth earnings volatility may be too long of a period.
Duration Mismatch
Think about it this way. When constructing a portfolio that contains fixed income one of the most important risks to consider is a “duration mismatch.” For example, let’s assume an individual buys a 20-year bond, but needs the money in 10-years. Since the purpose of owning a bond was capital preservation and income, the duration mismatch leads to a potential loss of capital if interest rates have risen at the time the bond is sold 10-years prior to maturity.
One could reasonably argue, due to the “speed of movement” in the financial markets, a shortening of business cycles, and increased liquidity, there is a “duration mismatch” between Shiller’s 10-year CAPE and the financial markets currently.
The first chart below shows the annual P/E ratio versus the inflation-adjusted (real) S&P 500 index.
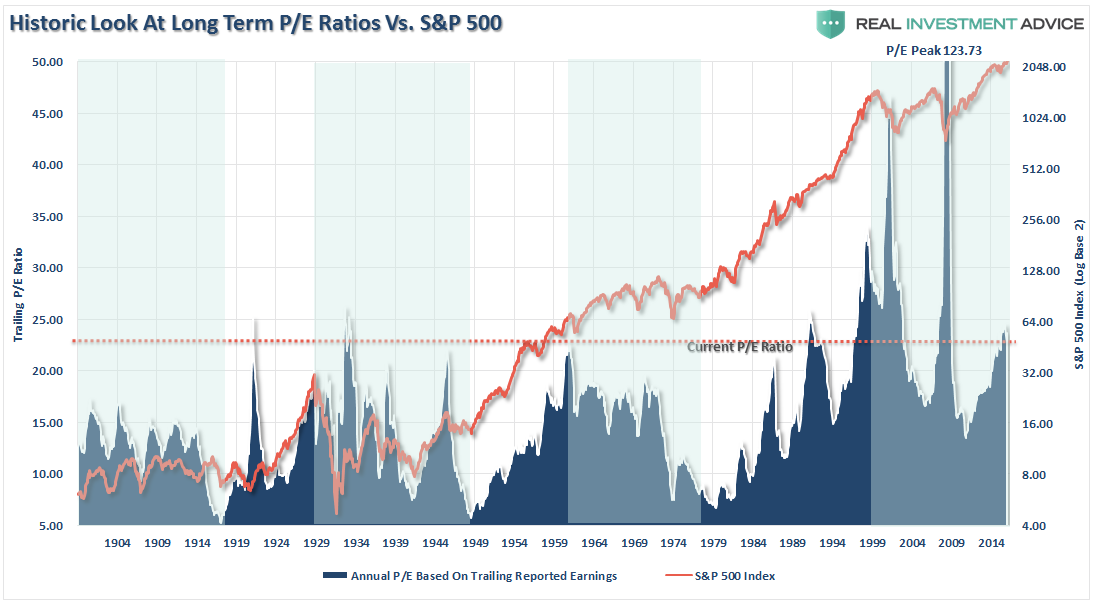
Importantly, you will notice that during secular bear market periods (green shaded areas) the overall trend of P/E ratios is declining. This “valuation compression” is a function of the overall business cycle as “over-valuation” levels are “mean reverted” over time. You will also notice that market prices are generally “sideways” trending during these periods with increased volatility.
You can also see the vastly increased valuation swings since the turn of the century, which is one of the primary arguments against Dr. Shiller’s 10-Year CAPE ratio.
Introducing The CAPE-5 Ratio
The need to smooth earnings volatility is necessary to get a better understanding of what the underlying trend of valuations actually is. For investor’s periods of “valuation expansion” are where the bulk of the gains in the financial markets have been made over the last 116 years. History shows, that during periods of “valuation compression” returns are much more muted and volatile.
Therefore, in order to compensate for the potential “duration mismatch” of a faster moving market environment, I recalculated the CAPE ratio using a 5-year average as shown in the chart below.
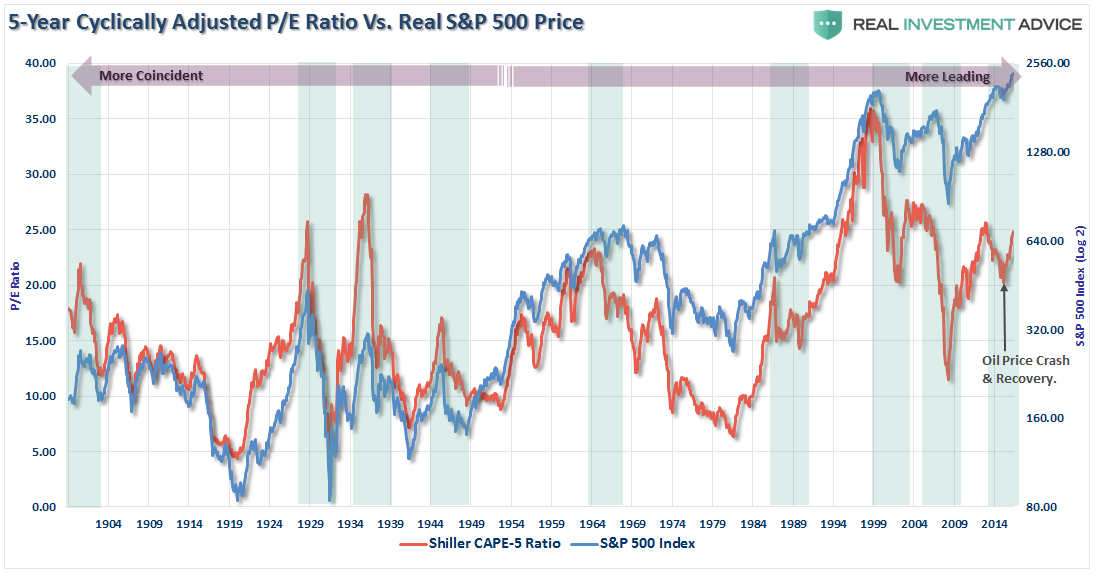
There is a high correlation between the movements of the CAPE-5 and the S&P 500 index. However, you will notice that prior to 1950 the movements of valuations were more coincident with the overall index as price movement was a primary driver of the valuation metric. As earnings growth began to advance much more quickly post-1950, price movement became less of a dominating factor. Therefore, you can see that the CAPE-5 ratio began to lead overall price changes.
A key “warning” for investors, since 1950, has been a decline in the CAPE-5 ratio which has tended to lead price declines in the overall market. The recent decline in the CAPE-5, which was directly related to the collapse and recovery in oil prices, has so far been an outlier event. However, complacency “this time is different,” will likely be misplaced as the corrective trend currently remains intact.
To get a better understanding of where valuations are currently relative to past history, we can look at the deviation between current valuation levels and the long-term average. The importance of deviation is crucial to understand. In order for there to be an “average,” valuations had to be both above and below that “average” over history. These “averages” provide a gravitational pull on valuations over time which is why the further the deviation is away from the “average,” the greater the eventual “mean reversion” will be.
The first chart below is the percentage deviation of the CAPE-5 ratio from its long-term average going back to 1900.
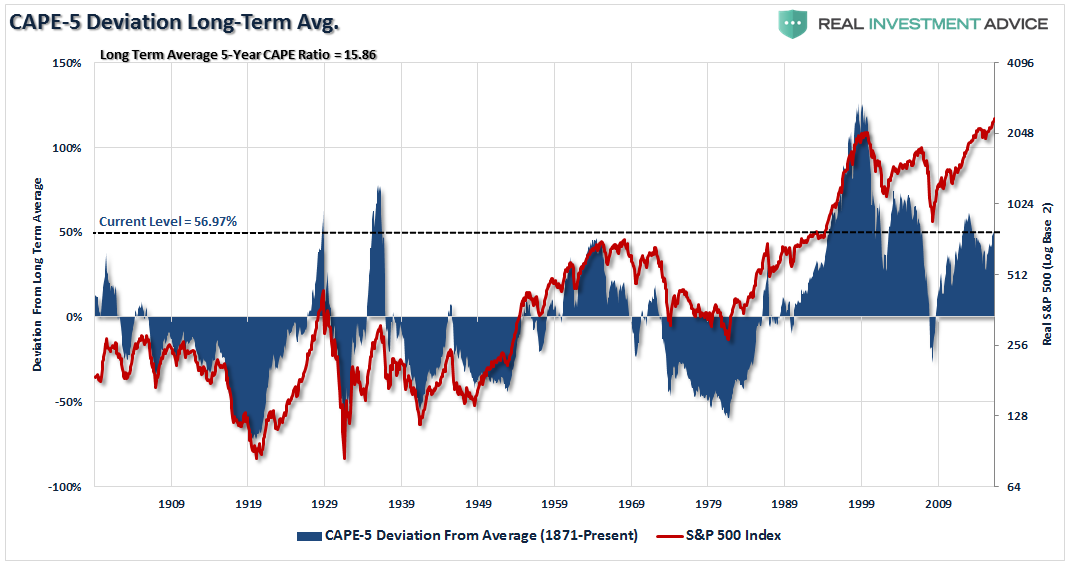
Currently, the 56.97% deviation above the long-term CAPE-5 average of 15.86x earnings puts valuations at levels only witnessed five (5) other times in history. As stated above, while it is hoped “this time will be different,” which were the same words uttered during each of the five previous periods, you can clearly see that the eventual results were much less optimal.
However, as noted, the changes that have occurred Post-WWII in terms of economic prosperity, changes in operational capacity and productivity warrant a look at just the period from 1944-present.
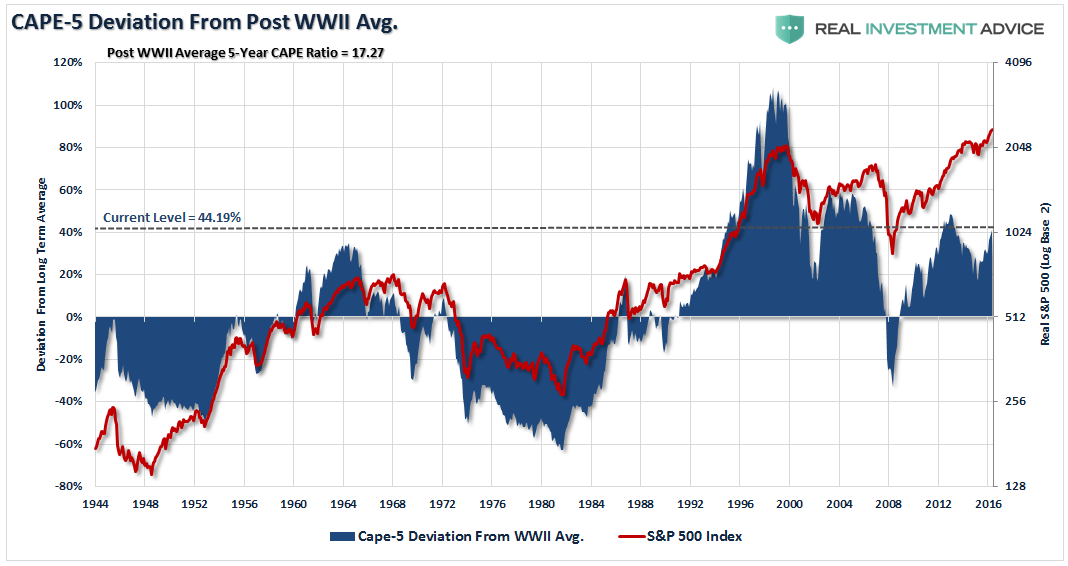
Again, as with the long-term view above, the current deviation is 44.19% above the Post-WWII CAPE-5 average of 17.27x earnings. Such a level of deviation has only been witnessed three times previously over the last 70 years in 1996, 2005 and 2013. Again, as with the long-term view above, the resulting “reversion” was not kind to investors.
Is this a better measure than Shiller’s CAPE-10 ratio?
Maybe, as it adjusts more quickly to a faster moving marketplace. However, I want to reiterate that neither the Shiller’s CAPE-10 ratio or the modified CAPE-5 ratio were ever meant to be “market timing” indicators.
Since valuations determine forward returns, the sole purpose is to denote periods which carry exceptionally high levels of investment risk and resulted in exceptionally poor levels of future returns.
Currently, valuation measures are clearly warning the future market returns are going to be substantially lower than they have been over the past eight years. Therefore, if you are expecting the markets to crank out 10% annualized returns over the next 10 years for you to meet your retirement goals, it is likely that you are going to be very disappointed.
Shiller’s CAPE: Is It Really B.S. – Part 1


Lance Roberts is a Chief Portfolio Strategist/Economist for RIA Advisors. He is also the host of “The Lance Roberts Podcast” and Chief Editor of the “Real Investment Advice” website and author of “Real Investment Daily” blog and “Real Investment Report“. Follow Lance on Facebook, Twitter, Linked-In and YouTube
Customer Relationship Summary (Form CRS)
Also Read