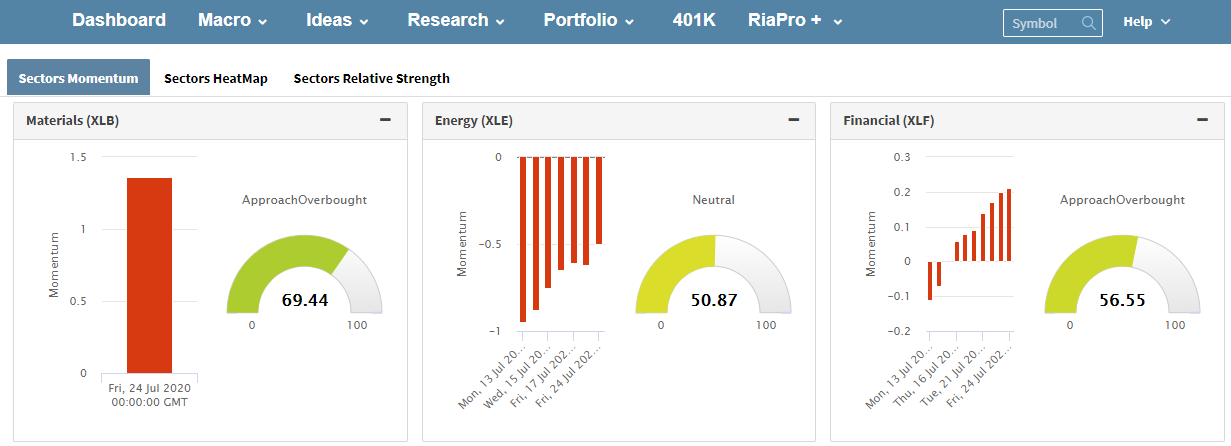
HOW TO READ THE SECTOR BUY/SELL REVIEW: 08-25-20
Each week we produce a “Sector Buy/Sell Review” chartbook of the S&P 500 sectors to review where the money is flowing within the market as a whole. This helps refine not only decision making about what to own and when, but what sectors to overweight or underweight to achieve better performance.
You can also view sector momentum and relative strength daily here.
There are three primary components to each chart below:
- The price chart is in orange
- Over Bought/Over Sold indicator is in gray in the background.
- The Buy / Sell indicator is in blue.
When the gray indicator is at the TOP of the chart, there is typically more risk and less reward available at the current time. In other words, the best time to BUY is when the short-term condition is over-sold. Likewise when the buy/sell indicator is above the ZERO line investments have a tendency of working better than when below the zero lines.
We added 2- and 3-standard deviation extensions from the 50-dma this week. We are back to “stupid” overbought on many levels. Caution is advised.
SECTOR BUY/SELL REVIEW: 08-25-20
Basic Materials
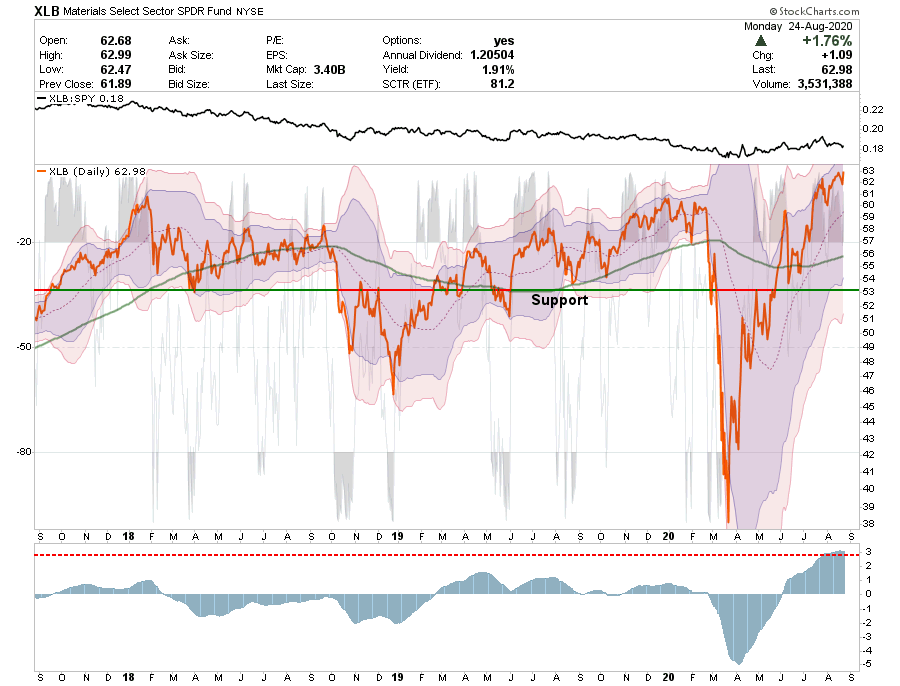
- The following comment applies to just about every chart in today’s review: “This is getting a bit ridiculous in terms of price deviations from long-term means.”
- With the market pushing into, and confirming all-time highs, basic materials rallied on Monday pushing into the previous high territory.
- The buy signal is now at the highest level on record.
- It WILL revert at some point, most likely after the bulls achieve an all-time high print for the major index.
- Short-Term Positioning: Bullish
- Last Week: No Positions
- This Week: No Positions
- Stop-Loss moved up to $57
- Long-Term Positioning: Bearish
Communications
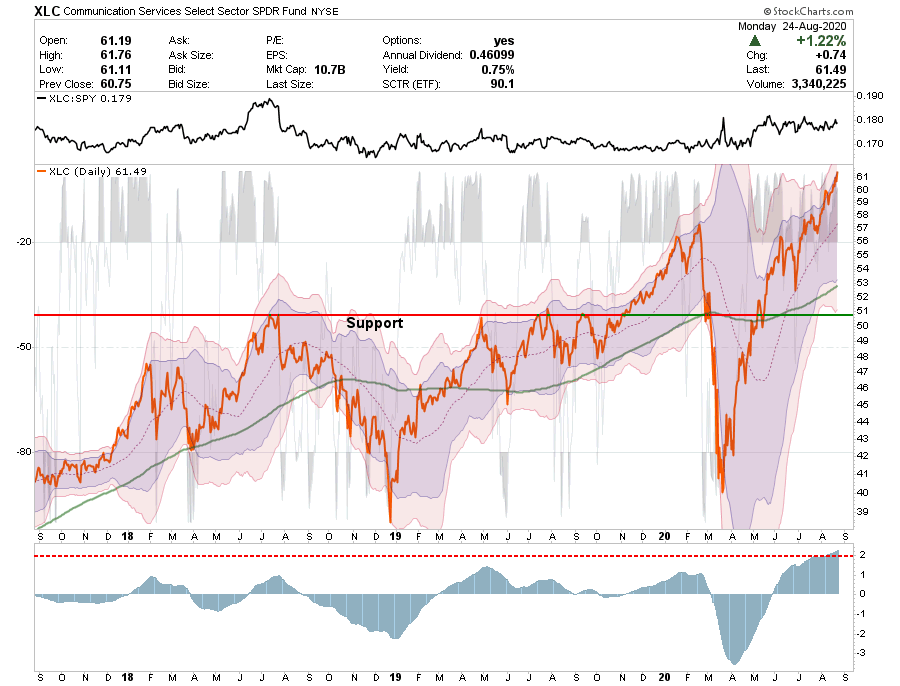
- XLC has pushed into extremes with the largest deviation from the 200-dma in its history, 3-standard deviations above the 50-dma, and the most overbought buy signal ever.
- A correction is coming. It is just a question of “when” and “what causes it.”
- Take profits and reduce risk. Move up stop levels.
- We moved our stop to $53.
- Short-Term Positioning: Bullish
- Last Week: Hold positions
- This Week: We are starting to rebalance our holdings.
- Long-Term Positioning: Neutral
Energy
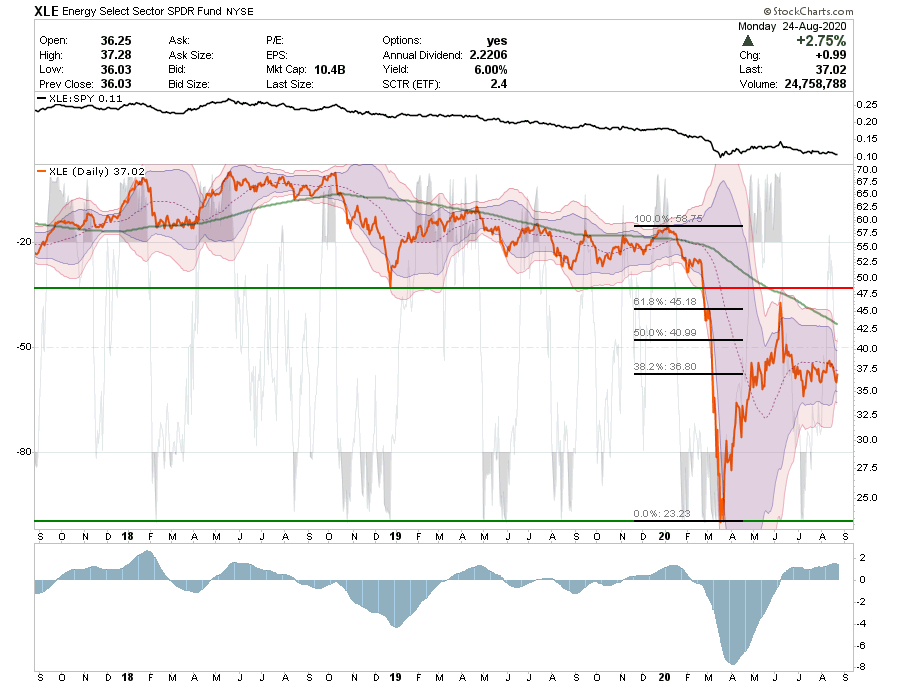
- Energy continues to fail at its 50-dma, but is also holding support.
- It needs to break above the 50-dma if we are going to see an advance.
- The sector is not overbought, and there is room for energy to improve on the upside if we see a rotation to value occur.
- Short-Term Positioning: Bullish
- Last week: Hold positions
- This week: Hold positions
- Stop-loss adjusted to $34.00
- Long-Term Positioning: Bearish
Financials
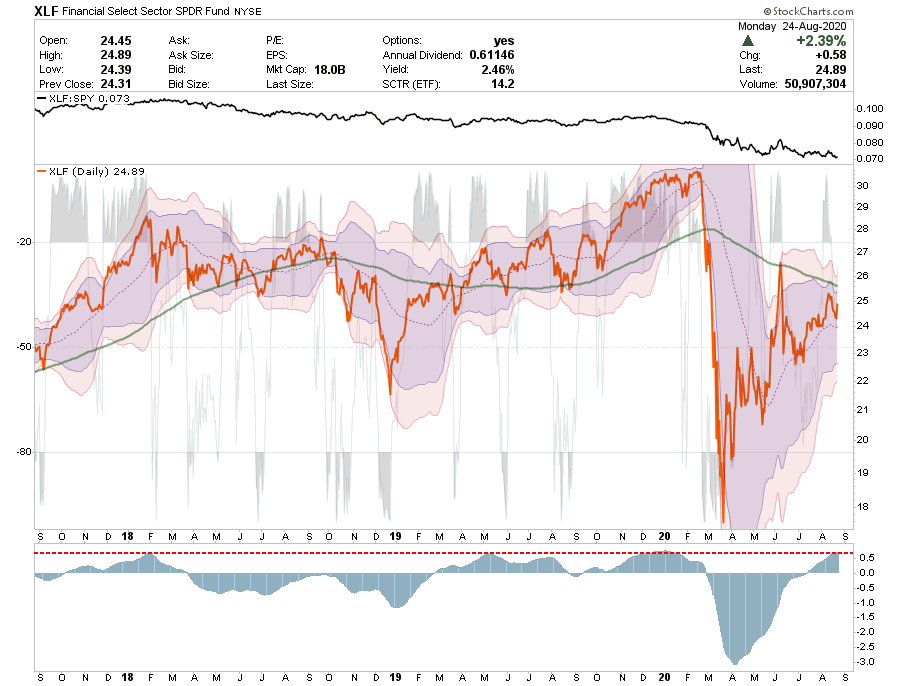
- Financials continue to underperform and remain a sector to avoid currently.
- As noted previously, the 200-dma was the next target and financials failed at that resistance last week.
- The bit of pickup on rotation was disappointing, and banks remain out of favor for now.
- Short-Term Positioning: Neutral
- Last week: No position
- This week: No position
- Long-Term Positioning: Bearish
Industrials
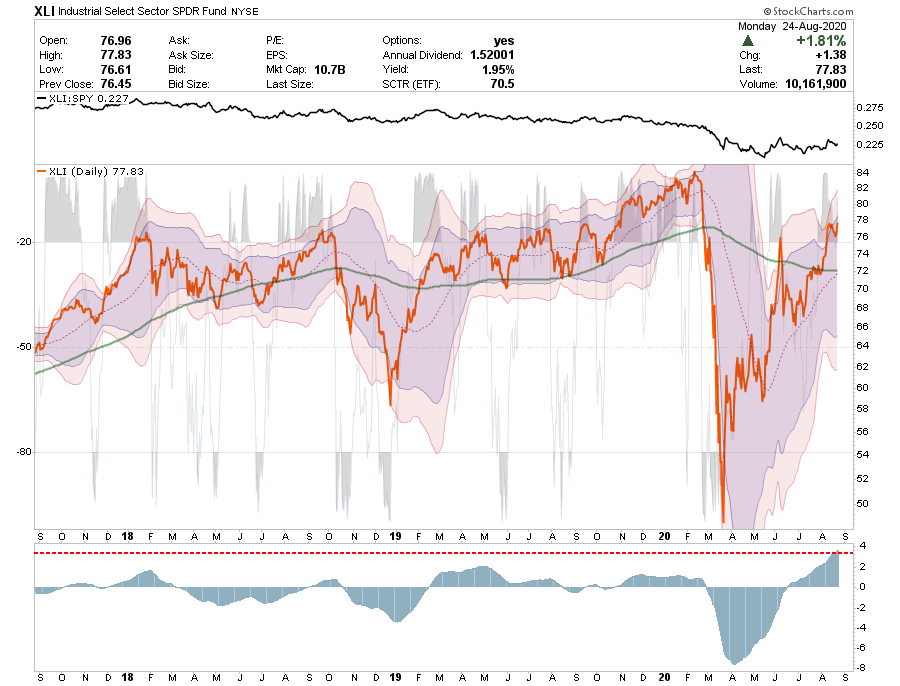
- Industrials bounced of support at the 200-dma and went parabolic into the 3-standard deviation zone.
- That buy signal is very extended and the sector is extremely overbought.
- A dollar counter-trend rally could impact the sector due to international exposure.
- Take profits and rebalance risk.
- Short-Term Positioning: Bullish
- Last week: No change.
- This week: No change.
- Long-Term Positioning: Bearish
Technology

- Technology stocks, and the Nasdaq, are extremely overbought with the buy signal at a higher level now than in February before the crash. (It’s the highest level EVER.)
- We are holding our positions currently, after taking some profits. But the deviation above the moving averages will be resolved likely sooner than later. In other words, a correction is coming.
- We are starting to hedge our portfolio and reducing risk accordingly.
- Short-Term Positioning: Bullish
- Last week: Reduced positions slightly.
- This week: Reduce risk if you haven’t.
- Long-Term Positioning: Bullish
Staples
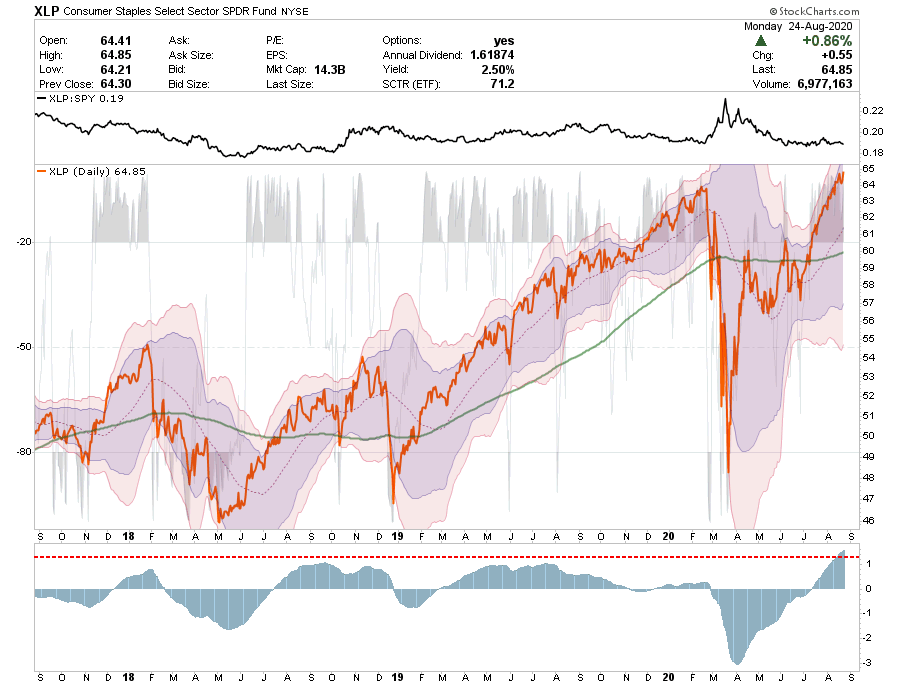
- XLP has now played catchup with the overall market. The buy signal is now extremely extended at the highest level ever.
- XLP is overbought and is trading at 3-standard deviations above the mean. A correction is coming, timing is the only question.
- Rebalance holdings and tighten up stop-losses.
- We are moving our stop-loss alert to $59 as our stop-level.
- Short-Term Positioning: Bullish
- Last week: Hold positions
- This week: Rebalancing holdings soon.
- Long-Term Positioning: Bullish
Real Estate
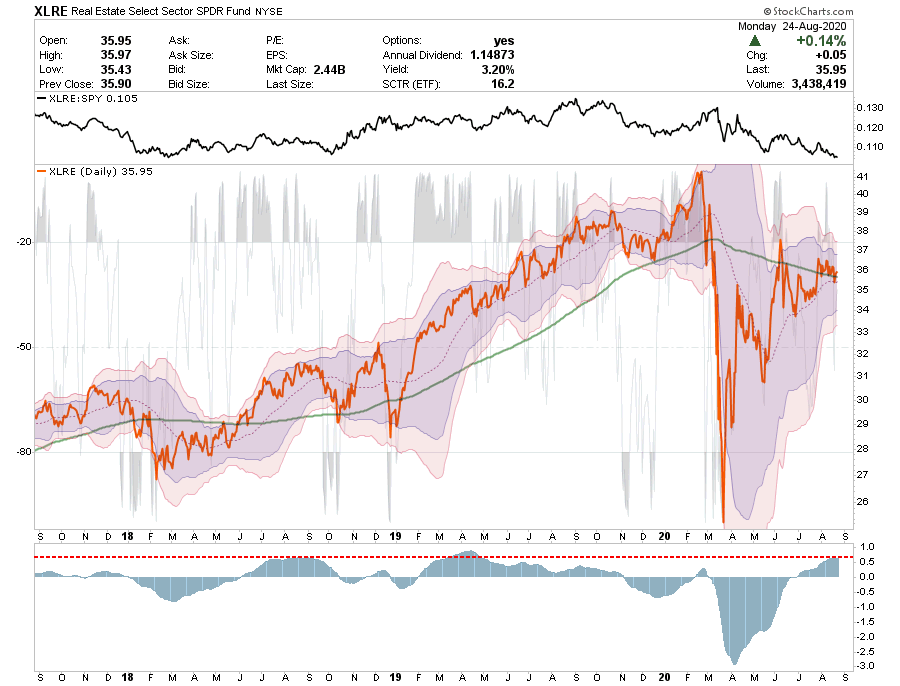
- XLRE has triggered a buy signal and is holding support at the 200-dma.
- We added some exposure back to REITs last week. (See portfolio commentary.)
- Move stops up to $34.
- Short-Term Positioning: Neutral
- Last week: No holdings.
- This week: Added 3% XLRE in ETF, and 1% WELL, PSA to Equity.
- Long-Term Positioning: Bullish
Utilities

- XLU has been holding support at the 200-dma but failed last Friday. It is now critical that XLU climbs back above resistance by the end of the week.
- We are looking to add some exposure here cautiously for a risk-off rotation trade in the market.
- The failure of support keeps us sidelined on additions currently.
- Short-Term Positioning: Neutral
- Last week: Hold positions
- This week: Hold positions
- Long-Term Positioning: Bullish
Health Care
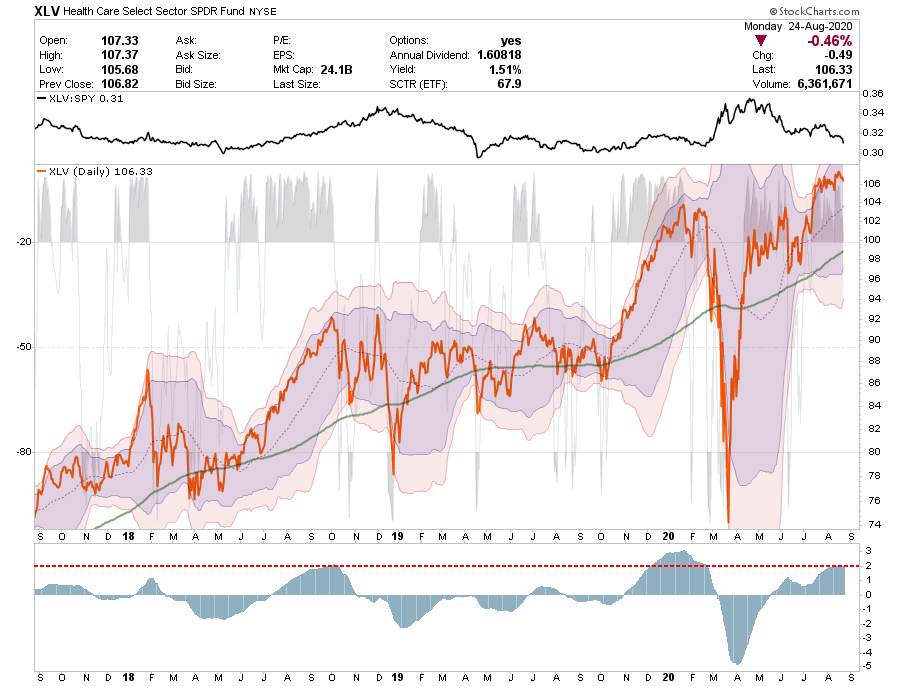
- As noted previously, XLV is trading 3-standard deviations above the moving average and a correction was likely.
- We are getting some consolidation and sideways trading. We will see if it will be enough to roll back some of the overbought conditions.
- The 200-dma is now important support and needs to hold, along with the previous tops going back to 2018.
- We are moving our stop to $100
- Short-Term Positioning: Bullish
- Last week: Hold positions
- This week: Hold positions.
- Long-Term Positioning: Bullish
Discretionary
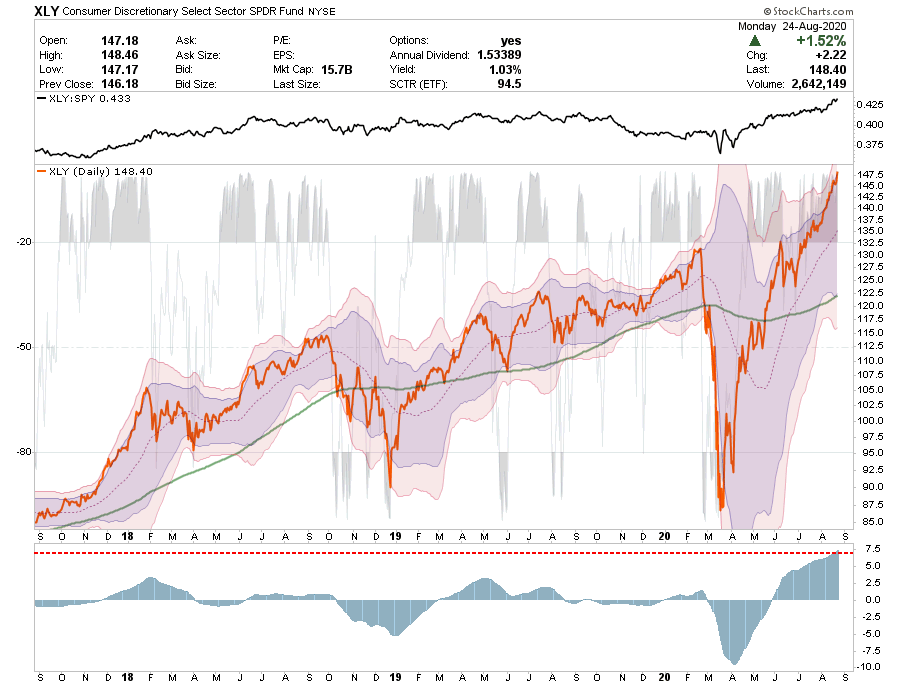
- XLY is trading at extremes and is at the biggest deviation from its 200-dma in history.
- The same goes for its buy signal.
- I have no idea what trips this sector up, but it is coming and the correction will be substantial.
- Take profits and hedge risk.
- Stop-loss is set at $130
- Short-Term Positioning: Bullish
- Last week: No position
- This week: No position
- Long-Term Positioning: Neutral
Transportation
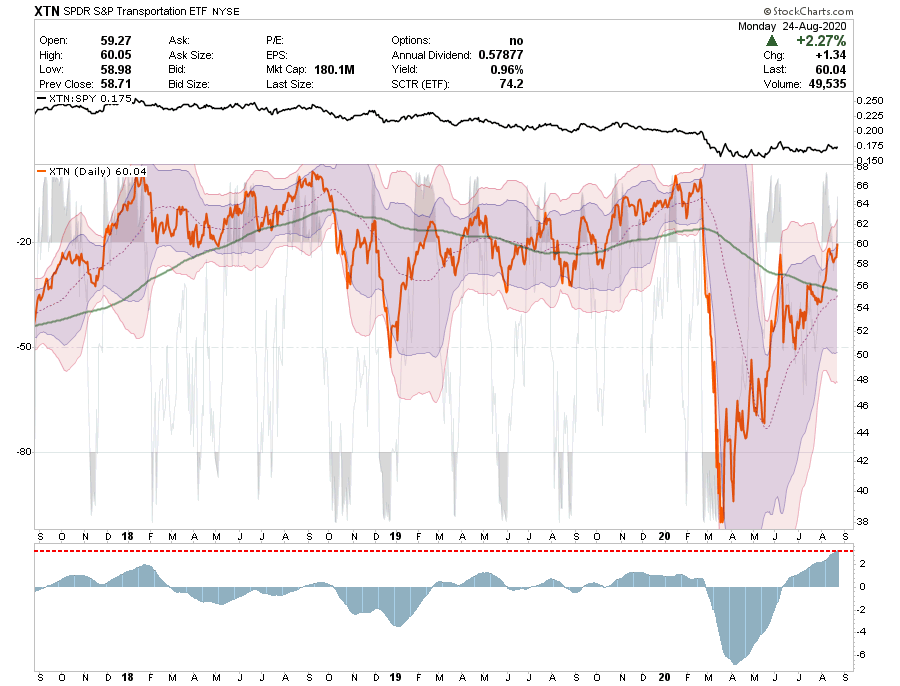
- The rally in XTN is now 3-standard deviations above the moving average after finally clearly the 200-dma resistance.
- The sector is performing better, but weak relative to the index.
- Take profits and reduce risk.
- Stop-loss set at $54
- Short-Term Positioning: Neutral
- Last week: Reduced position in IYT.
- This week: Rebalance and reduce risk.
- Long-Term Positioning: Bearish


Lance Roberts is a Chief Portfolio Strategist/Economist for RIA Advisors. He is also the host of “The Lance Roberts Podcast” and Chief Editor of the “Real Investment Advice” website and author of “Real Investment Daily” blog and “Real Investment Report“. Follow Lance on Facebook, Twitter, Linked-In and YouTube
Customer Relationship Summary (Form CRS)
Also Read