


Following Wednesday’s Fed meeting, ZeroHedge aptly titled an article, “Santa Powell Unleashes Global ‘Buy Everything” Frenzy As Dollar, Yield Tumble.” Stocks and Bonds surged higher as the Fed was much more dovish than expected. Like Paavolov’s dogs, investors latched onto the prospect of rate cuts in 2024 and bought stocks and bonds without asking essential questions. If we were at the post-FOMC press conference and could ask Santa Powell just one question, it would be about financial conditions. On October 19, 2023, Powell stated the following:
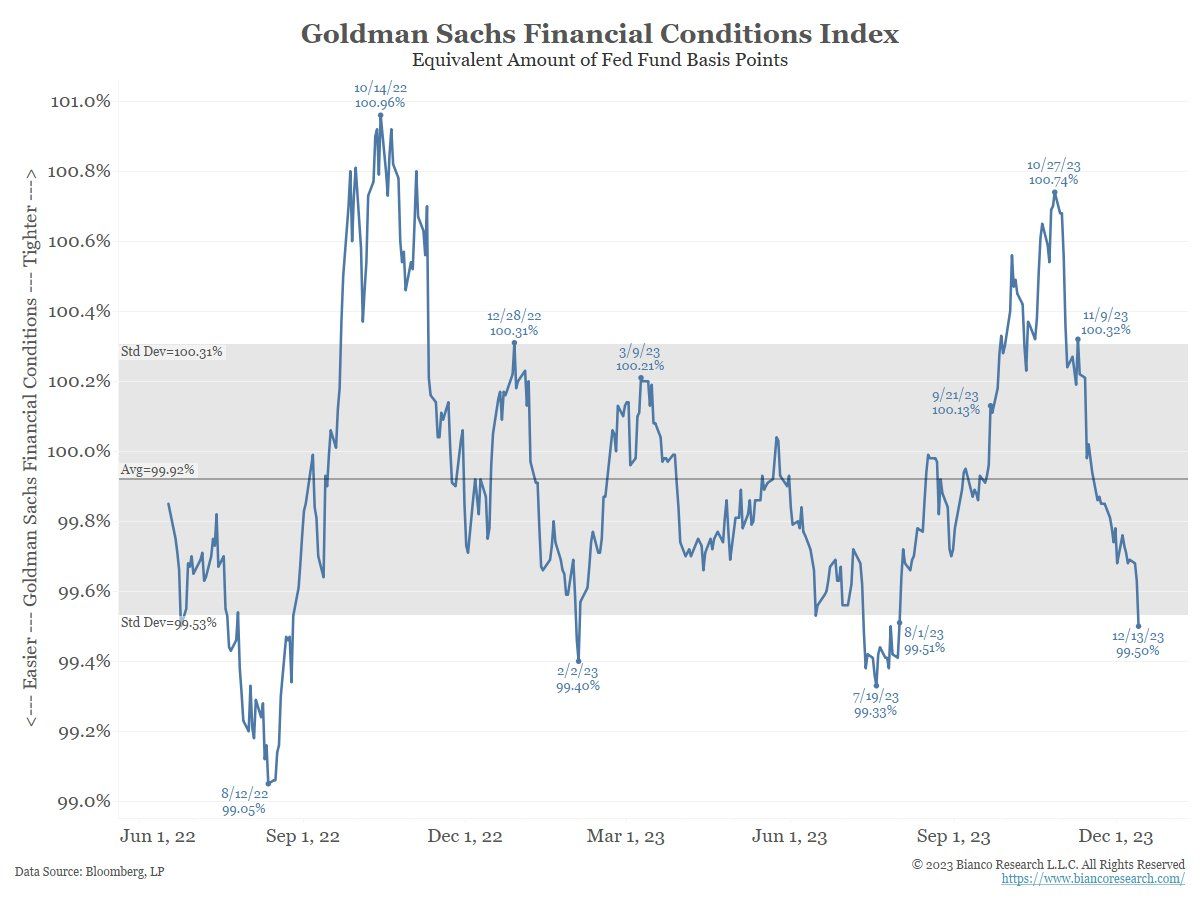
“Financial conditions have tightened significantly in recent months, and longer-term bond yields have been an important driving factor in this tightening. We remain attentive to these developments because persistent changes in financial conditions can have implications for the path of monetary policy.”
At that time, Powell gave the market hope that the Fed was done increasing rates because long-term interest rates rose significantly. Since then, as shown below, financial conditions have loosened considerably on the back of ten-year yields falling 1% and stocks climbing over 10%. So, Santa Powell, we must ask, if financial conditions have implications for monetary policy, why are easier financial conditions being met with a dovish tilt? This leads to a more critical question worth pondering. What might Powell know that the market doesn’t?
What To Watch Today
Earnings

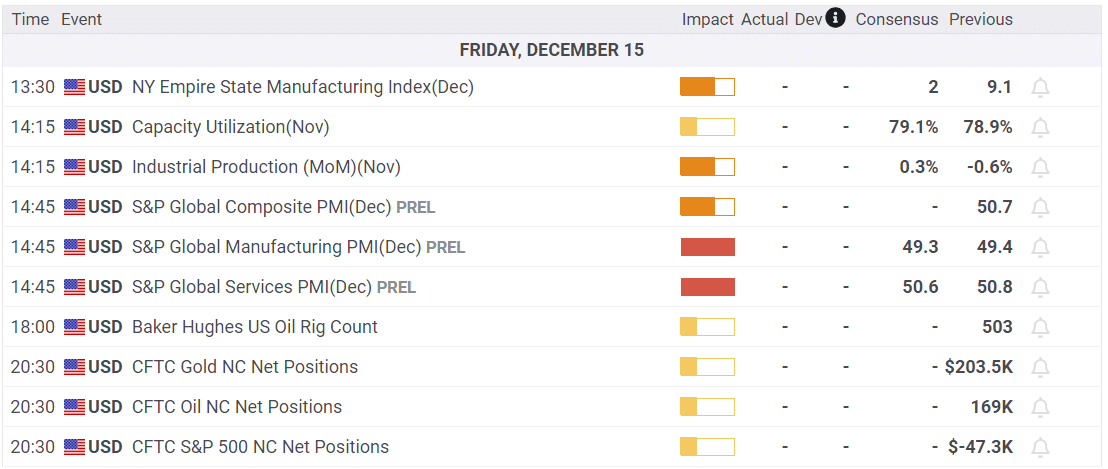
Economy
Market Trading Update
The market continues to push higher with all-time highs in sight. After consolidating for the first few weeks of December, the Fed pivot on Wednesday brought the Santa Rally to Wall Street early. Notably, the market has competed a bullish “Cup and Handle Formation” as defined by Investopedia:
“The pattern was first described by William J. O’Neil in his 1988 classic book on technical analysis, How to Make Money in Stocks. A cup and handle price pattern on a security’s price chart is a technical indicator that resembles a cup with a handle, where the cup is in the shape of a ‘u’ and the handle has a slight downward drift. The cup and handle pattern is considered a bullish signal, with the right-hand side of the pattern typically experiencing lower trading volume. The pattern’s formation may be as short as seven weeks or as long as 65 weeks.”
That pattern seems quite evident in the following weekly chart of the S&P 500 index. With the breakout of the “cup and handle” formation in place, an attempt at all-time highs seems to be the logical next step. Any subsequent correction to relieve current overbought conditions should maintain the bullish trend line from the March 2020 lows.
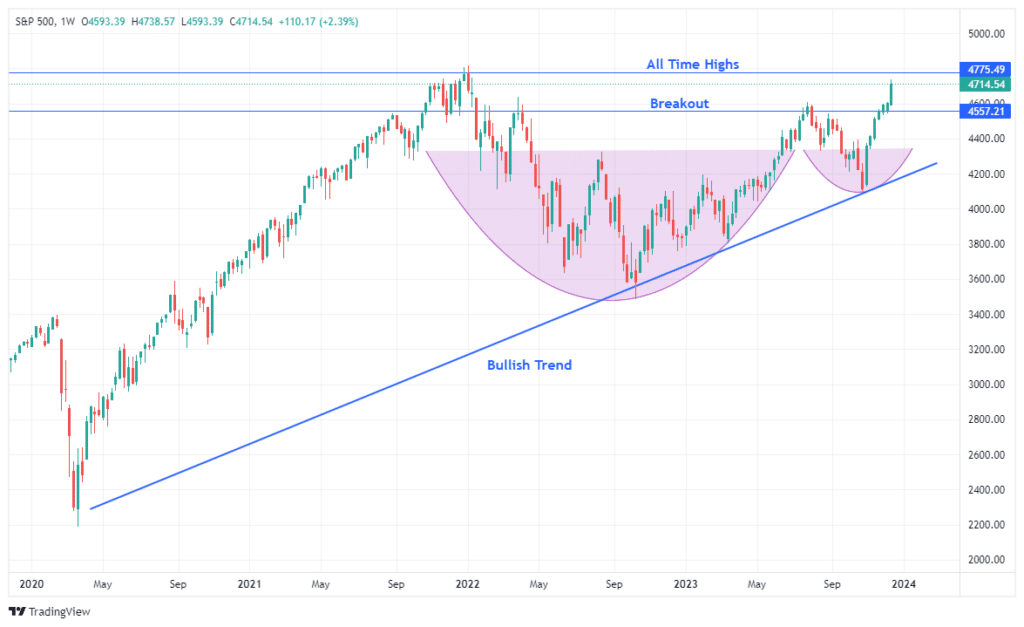
The market is aggressively overbought in the short term, and investor sentiment is now pushing more extreme levels. Such has always preceded a market correction and will not be different this time. However, as they say, timing is everything. We recommend making a shopping list for stocks you want to own and being patient for the market to give you a better risk/reward entry point.

More Good Inflation News
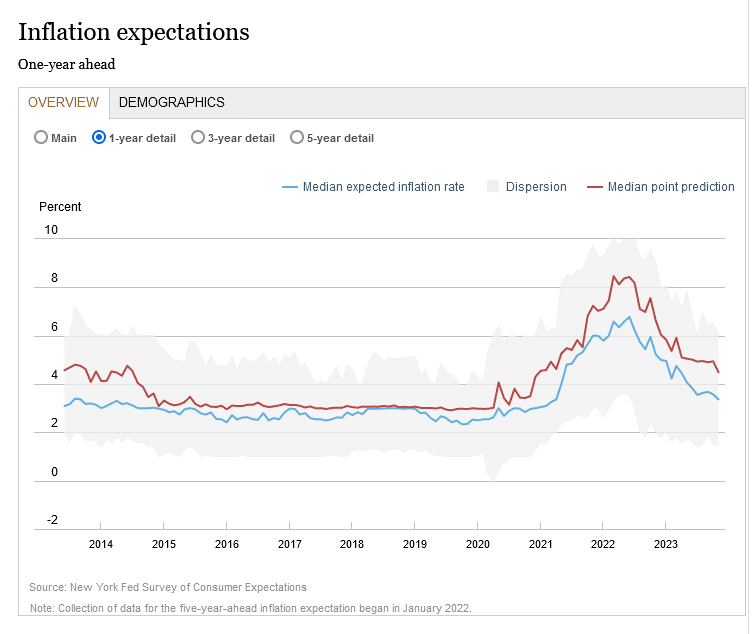
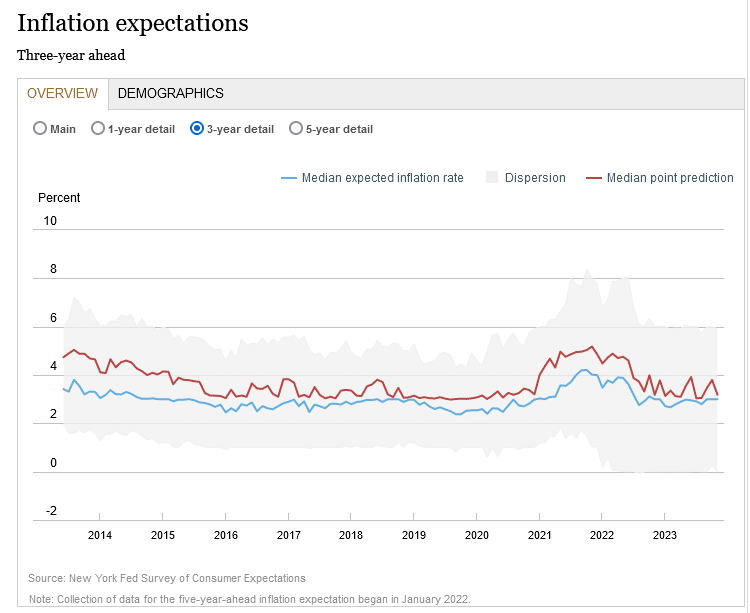
Tuesday’s Commentary touched on inflation swaps trading slightly below 2%. While the Fed focuses on market-implied inflation expectations, like inflation swaps, it also tracks surveys. In that vein, the New York Fed Survey of Consumer Expectations shows that one- and three-year inflation expectations are closing in on the Fed’s 2% target. The first graph shows that median one-year inflation expectations fell to 3.4%, the lowest level since April 2021. The range of survey responses (gray) continues to decline as well. Three-year expectations have not been nearly as volatile. Based on the survey, consumers expect 3% inflation for the next three years.
As you view the data, you must also consider context. While inflation ran below 2% for much of the period preceding the pandemic, the expectations wavered around 3%. Therefore, the one- and three-year median readings of 3.4% and 3.0% are close to the pre-pandemic norms. Like implied market inflation rates, this survey should also comfort the Fed that inflation is normalizing rapidly.
Got Small Caps?
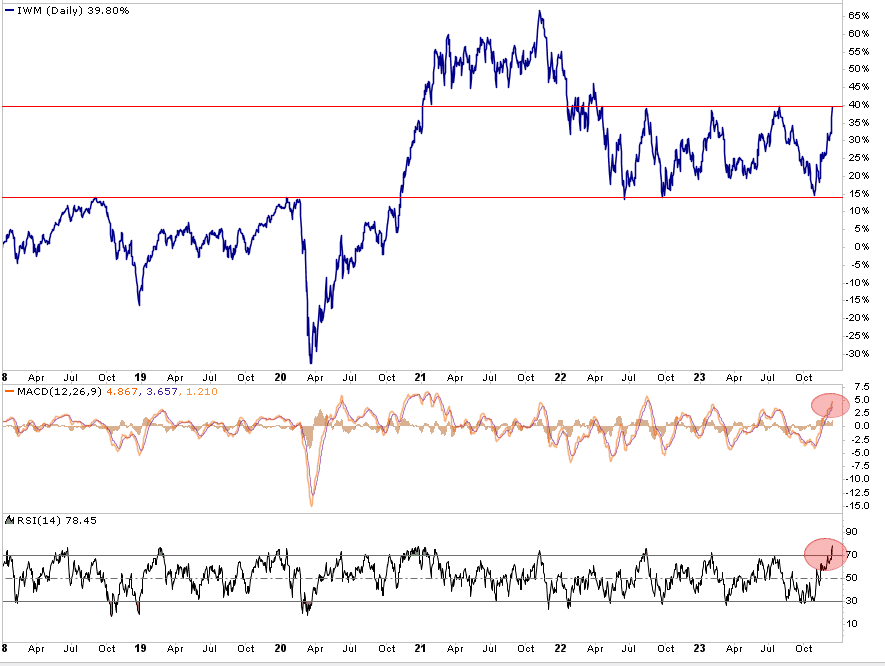
After bottoming in late October, small-cap stocks have been on a tear. Santa Powell backing off of rate cuts started the rally. His comments on Wednesday further fueled it. Since late October, the IWM small-cap ETF is up about 25%, more than double that of the S&P 500. The graph below shows the surge but offers caution. In late October, it bounced off of a strong support line. At that time, the MACD and RSI, below the price graph, were signaling a buying opportunity. 25% later, IWM is hitting a solid level of resistance. Further, the RSI points to decidedly overbought conditions, and the MACD is getting ready to turn from high levels.
Small-cap stocks tend to be more interest-rate sensitive than large-cap stocks. If rates are indeed on a path much lower and Santa Powell navigates the rare soft landing, these stocks may continue to outperform the S&P 500. However, it may be worth waiting to buy or add to small-cap stocks. A short-term pullback is likely in the cards.
Tweet of the Day
Please subscribe to the daily commentary to receive these updates every morning before the opening bell.
If you found this blog useful, please send it to someone else, share it on social media, or contact us to set up a meeting.
Also Read


