
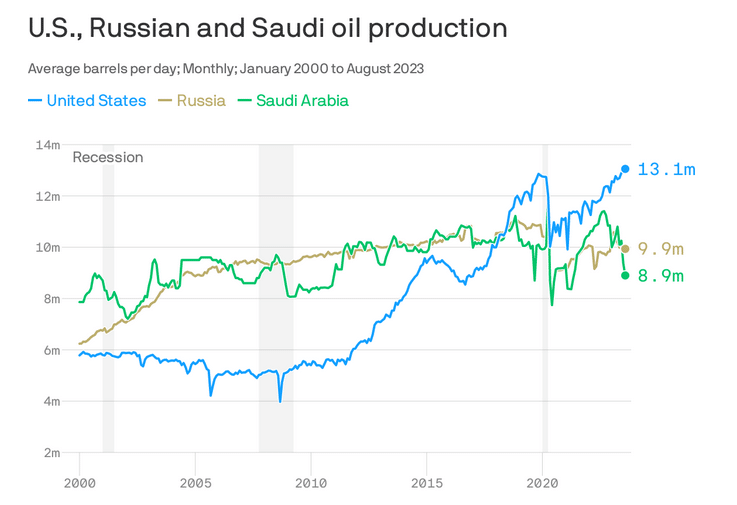
The US now accounts for the most oil production in the world. Importantly, as we share in the graph below courtesy of Axios, the ramp-up of US oil production since 2020 has helped offset recent supply reductions by Russia and Saudi Arabia. Oil production troughed in 2020 as the pandemic crushed demand and limited production. Since then, US oil production has risen by 3 million barrels per day as the global economy recovered. Despite recently cutting production, Saudi Arabia still produces about 1 million barrels per day more than at the 2020 trough. Total production from the three largest oil producers, accounting for about 40% of production, is about 1.5 million barrels per day less than was being produced in 2019.
Crude oil prices are on long-term support at around $70 a barrel. Before the pandemic, crude oil hovered around $60 a barrel. The higher price incentivizes more production, which will likely keep the trend in US oil production rising. Further supporting robust oil production in the US and other nations, the Department of Energy forecasts energy consumption will increase by 1.9% this year and 1.4% next year. To help put more context to the graph below, the Department of Energy expects consumption to average 102.44 million barrels per day, 1.45 million barrels than 2023. Barring a recession or a steep decline in prices, it’s probable that US oil production will continue upward, which should minimize production cuts from Russia and Saudi Arabia.
What To Watch Today
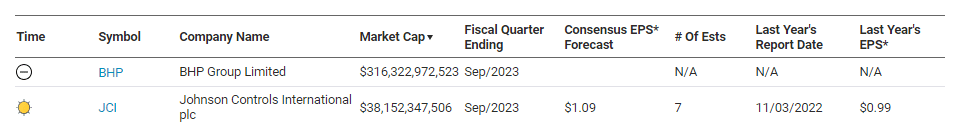
Earnings
Economy

Market Trading Update
Today is “Inflation Day.” The CPI print will hit the headlines as this email hits your inbox. Given the recent weakness in oil prices, still softening home demand, and cooling food prices, the expectation is only a 0.1% increase, with YoY inflation falling to just 3.1%. However, there is a likelihood we could see an even softer print this morning, which, if that is the case, could send stocks higher on expectations that the Fed will think about cutting rates sooner than later.
Nonetheless, as shown in the chart below, the markets remain well extended and overbought on many levels, and the upside remains limited for now. The big risk to stocks will be the FOMC meeting tomorrow afternoon, where a more hawkish outlook from the Fed could upset traders short-term. For now, the downside risk remains and we continue to suggest being patient with new buys until a better entry point presents itself.


Forecasting Inflation With Interest Rate Swaps
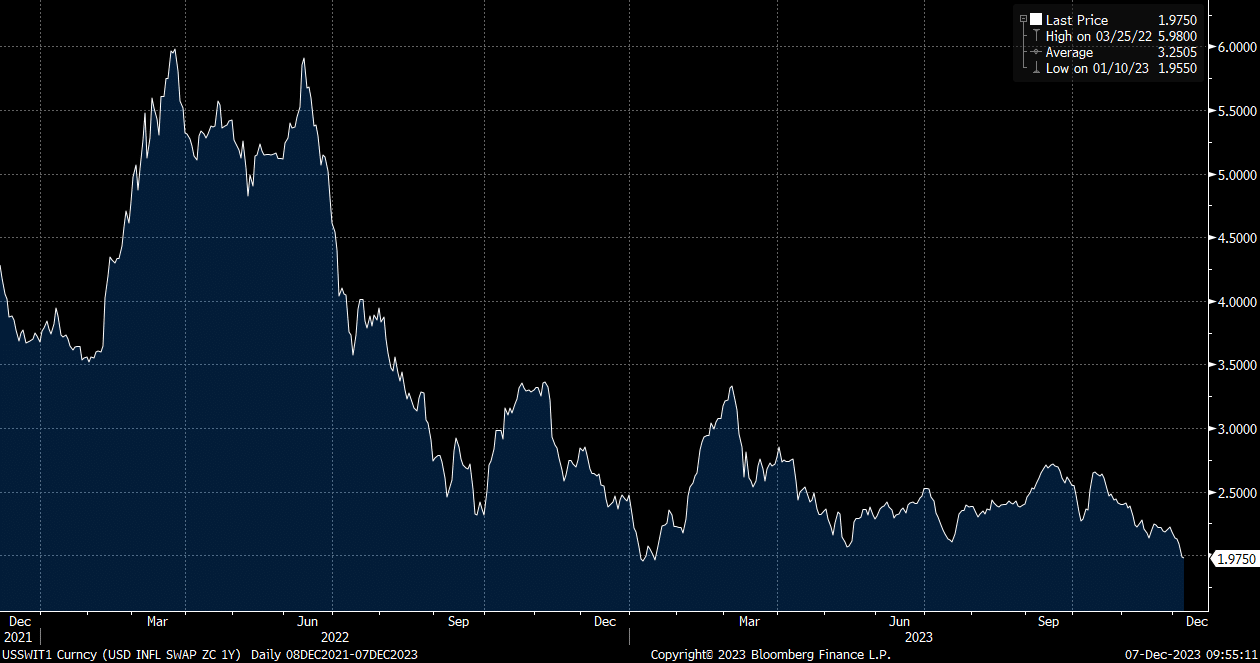
The Bloomberg graph below shows one-year inflation swaps. Inflation swaps are a financial derivative predominantly used by banks and institutional speculators to hedge or bet on inflation. The two swap counterparties exchange a fixed set of payments for payments that fluctuate with the actual inflation rate. While the swaps help banks and others protect or profit from future inflation, they provide all market participants with a market-generated implied inflation rate.
As the graph shows, one-year inflation expectations, as implied by swaps, are now at 1.975%. Hence, the swap market thinks inflation will reach the Fed’s target in a year. The Fed carefully watches inflation swaps to survey inflation expectations. Swaps, along with actual inflation data and inflation surveys, go a long way in the Fed’s rate policy decision-making. Therefore, expectations like that below allow the Fed to pause. If one-year inflation swaps and other indicators continue lower, the Fed may begin discussions on rate cuts.
Deflation Or Hyperinflation?
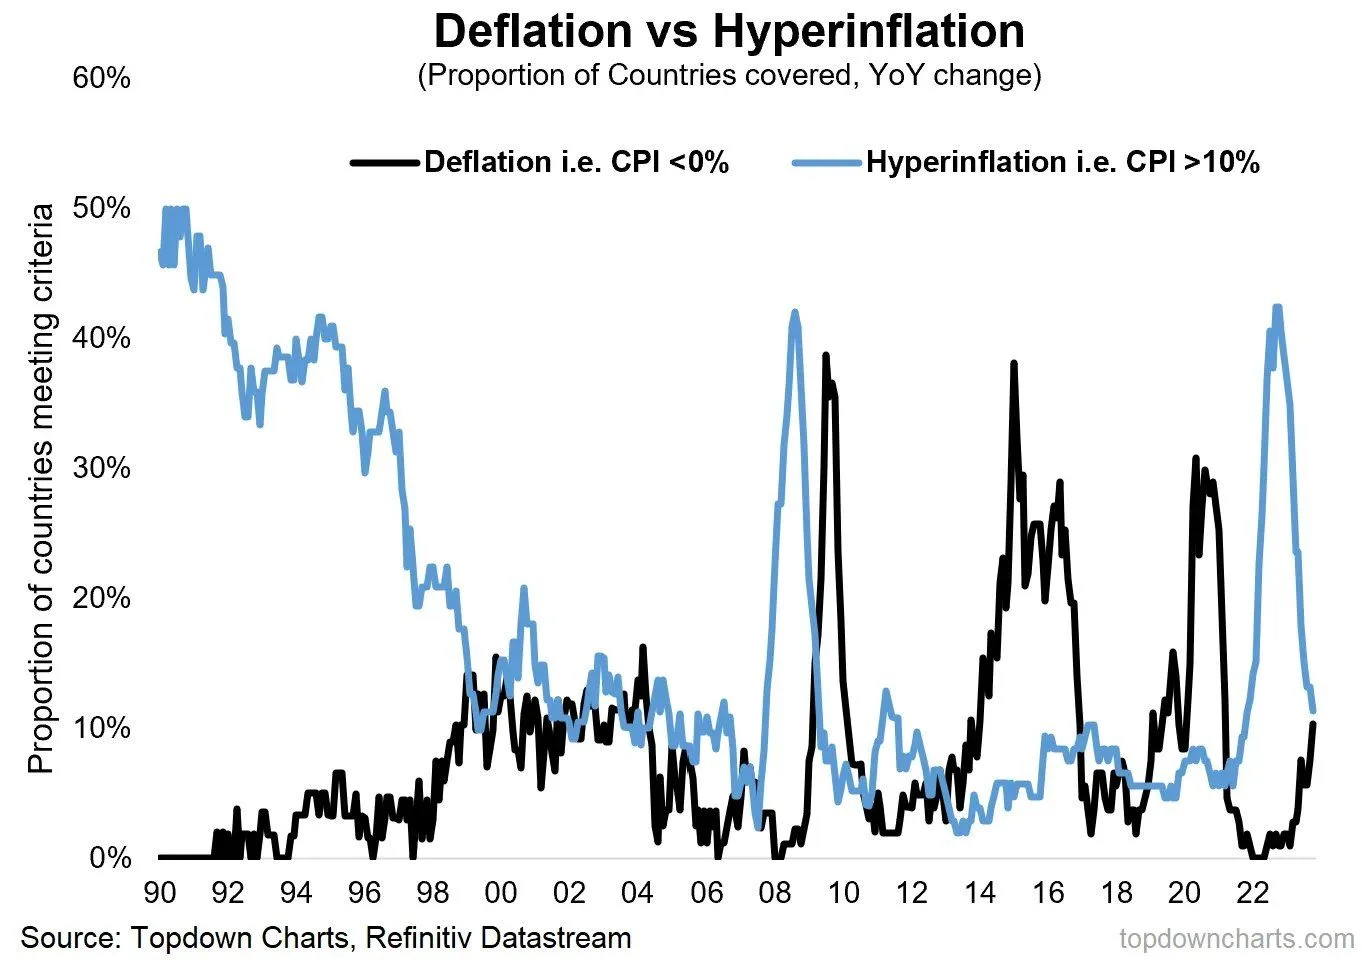
The graph below, courtesy of Topdown Charts, helps us appreciate the global macroinflation environment. As it shows, almost 50% of the countries covered were in a hyperinflationary environment in 2022. That has since dropped considerably. Not surprisingly, the number of countries experiencing deflation is rising, albeit it is still low.
The data from 2008 provide an interesting comparison to today. The percentage of countries with hyperinflation in 2008 is similar to 2022. Further, those experiencing deflation when hyperinflation peaked were zero in both instances. A global recession resulted in surging deflation and collapsing hyperinflation. Might we be on the doorsteps of another such instance?
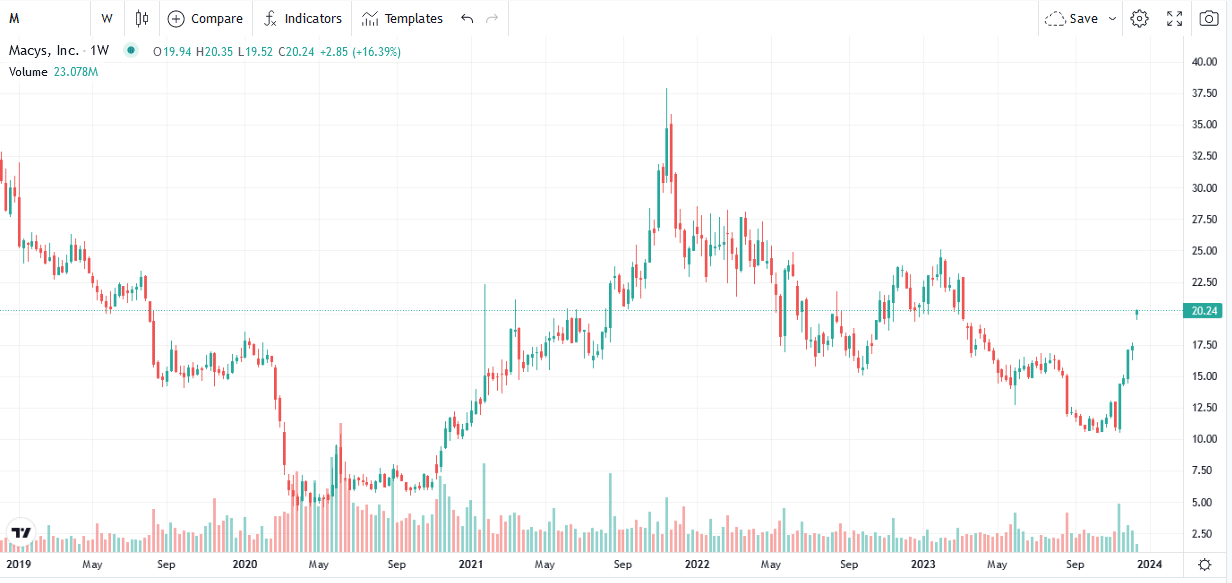
Is Macy’s Going Private?
Macy’s (M) traded almost 20% higher on Monday as an investor group led by Arkhouse Management and Brigade Capital submitted a takeover bid for $21 per share. They are already shareholders. It appears the reason for the bid is Macy’s real estate. Per Yahoo Finance:
“The buyout group is undoubtedly interested in Macy’s large real estate portfolio, which has attracted activists and potential buyers in the past,” Morningstar analyst David Swartz said in a note.
J.P. Morgan analysts estimate Macy’s total real estate value at about $8.5 billion, or $31 per share, including the iconic Herald Square property worth about $3 billion.
If the group can come up with the required financing and complete the deal, we may see other retailers catch a bid as they, too, sit on valuable land.
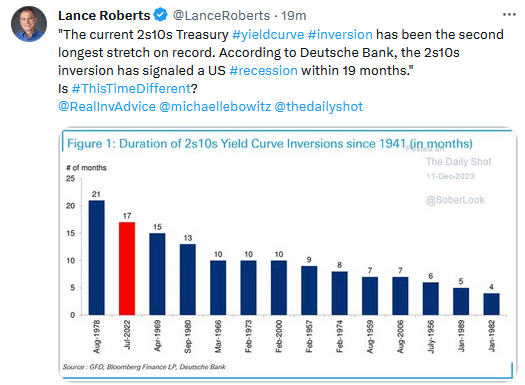
Tweet of the Day
Please subscribe to the daily commentary to receive these updates every morning before the opening bell.
If you found this blog useful, please send it to someone else, share it on social media, or contact us to set up a meeting.

