
Traditionally, the annual Jackson Hole Symposium is where the Fed Chair signals which economic forces are shaping the Fed’s thinking for the coming year. With a few members pushing for rate hikes and inflation making others anxious, the market is taking his speech as more of an indication of what the Fed may or may not do at the next few FOMC meetings, and less about its 2027 outlook. Focused on the here and now, Warsh was blunt in his assessment of inflation. He signaled the Fed may not be done fighting inflation, saying financial conditions didn’t look restrictive enough to him and that recent benign inflation readings hadn’t convinced him the trend was improving meaningfully. Per Warsh’s speech:
And while this summer’s PCE and CPI readings were better than expected, they do not tell me that underlying trends have meaningfully improved.
Here is my standard: We must be confident that underlying inflation is moving to our objective, clearly and at sufficient speed. Otherwise, we have work to do. That’s our job . . . our mandate . . . and our charge to keep.
Warsh backed up inflation concerns with hard data. For instance, PCE inflation sits at 3.7% year over year, with core measures also elevated. He disaggregated all 199 components of the PCE basket and found 54% of goods and services rose above 3% over the past year, down from post-pandemic highs near 77%, but still well above the 32% average of the two decades before the pandemic.
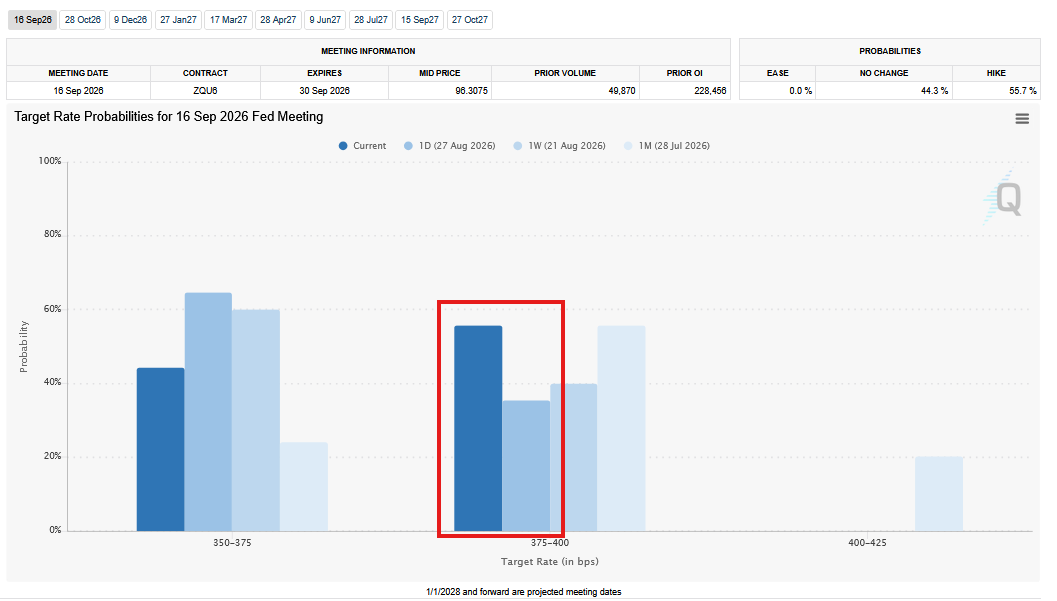
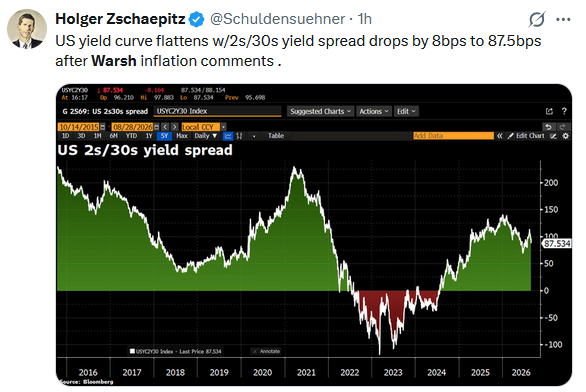
Did Warsh present a more hawkish view to support the bond market, or does he genuinely see inflation this way? We ask this because at the last FOMC meeting he was more optimistic on recent inflation trends. Whatever the motivation, longer bond yields fell on the remarks while shorter yields rose, flattening the yield curve. That is what a credible inflation-fighting message would be expected to do: reassure long-duration holders while raising the odds the Fed holds or hikes at the next meeting rather than cuts. As we show below, within an hour of the speech, the odds of a hike at the September 16th meeting rose from 35% to 57%.
What To Watch Today
Earnings
- No notable earnings releases today
Economy

Market Trading Update
As noted above, the market remains within a stone’s throw of previous highs, but underlying momentum quietly rolls over. The S&P 500 finished the week at 7,711.76, about 1.1% below the record close of 7,796 set on August 13. The index sits 2.0% above its rising 50-DMA near 7,556 and a healthy 8.4% above its 200-DMA near 7,114, and the golden cross remains firmly intact. When looking solely at the trend, the reamins a bull market. However, a look at the underlying momentum shows the cracks are appearing.
Specifically, the 14-day RSI closed at 56.6, down from 58.6 a week ago and well off the overbought readings that accompanied the mid-August record. That reading suggests a more neutral condition, not stretched, and it leaves room in either direction. More telling is the MACD, where the signal line has rolled over; the MACD line at 41 is now sitting below its 51 signal, with a negative histogram. Furthermore, the histogram is narrowing rather than widening, so this is a loss of upside thrust, not the start of a breakdown. Price at the highs on fading momentum is how most short pauses begin, and occasionally how larger ones do.

Overall, participation is the most important tell. As we detailed in Breadth Is Lacking: Is The Rally Sustainable?, a rally led by a shrinking group of names is weaker. This week proved it again. The equal-weight index fell while the cap-weight rose, and small caps dropped 1.4%. When the generals advance without the troops, the advance is on borrowed time.
Heading into next week, this is how we would suggest approaching the market. The record close at 7,796, and the round 7,800 level, are the resistance barriers. If the markets can muster a decisive close above the levels, on strong breadth, that would reopen 7,900 and then 8,000.
Absent that, we will continue to treat rallies into 7,800 as a place to trim winners back to target weight, not to add.
On the downside, the first support is the recent swing low near 7,643, then the 50-DMA at 7,556. Any break of the 50-DMA is the level that begins to turn the recent pause into something worth hedging with index puts or a raised cash buffer. Our money-flow model already trimmed equity exposure toward target weight at the August highs, and we see no reason to reverse that currently.

The base message is to continue keeping risk controls in place, a larger-than-normal cash buffer, and swap risk for safety until the market declares where it is headed next.

The Week Ahead
After Jackson Hole and with little earnings news, markets will likely be quiet in the run-up to Labor Day weekend. That said, Friday’s August employment data will be closely watched. Currently, the street expects the Friday BLS employment report to show payrolls rose by 45k with a 0.1% uptick in the unemployment rate to 4.2%.
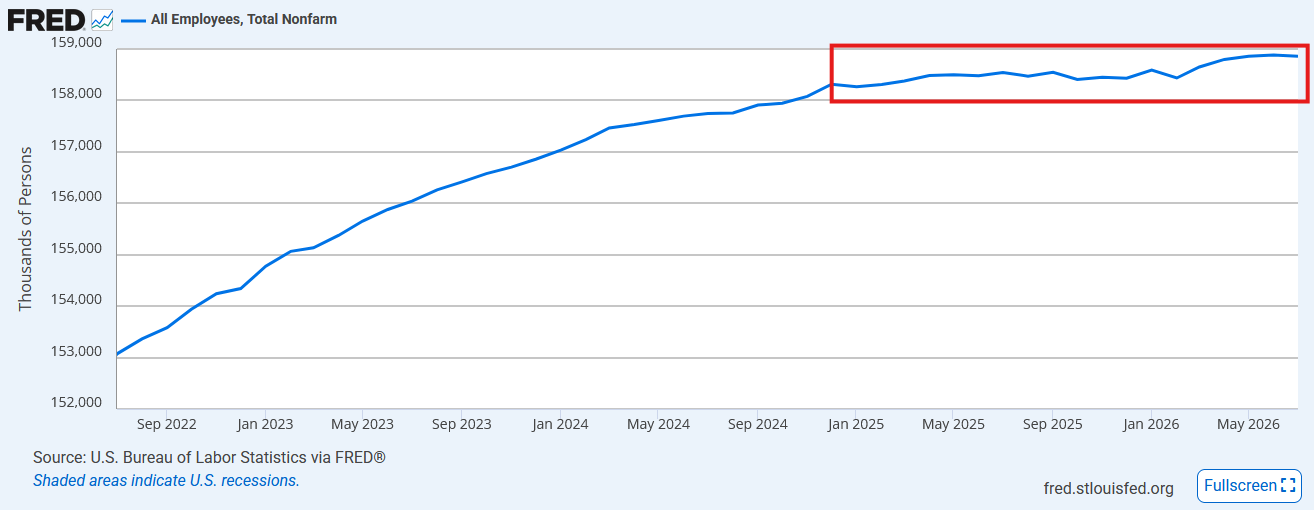
The graph below shows that payroll growth has largely stalled out since December 2024. Over that period, payrolls have grown by less than 28k per month on average, with most gains coming in March through May of 2026. Some of that growth is likely related to the World Cup. Thus, in addition to the weakness we saw in July’s data (-23k) as those workers were let go, we may see more in this week’s report.
Since December, the labor force has grown by 2.4 million people, and the number of jobs has grown by 540k or about a fifth of the labor force growth. Over the same period, unemployment remained steady at 4.1%. The curious difference is due to the participation rate, which has fallen by 1.1% to 62.4%. For more on the participation rate and why it may not be as concerning as it seems, check out our Commentary from August 26, 2026. The following paragraph is from the Commentary:
The St. Louis Fed recently broke down what’s driving the decline, and the answer is not necessarily that unemployed workers have stopped looking for jobs. A “statistical population-control revision” the BLS made in January accounts for 43% of the decline. Another sizeable chunk is due to our aging population; older workers are participating less, as more baby boomers retire. This accounts for another 41% of the decline. The remaining piece is the concern. There has been a sharp drop in the number of prime-age workers 25 to 54.
Democratic Socialism: A Beautiful Cake With A Bitter Aftertaste
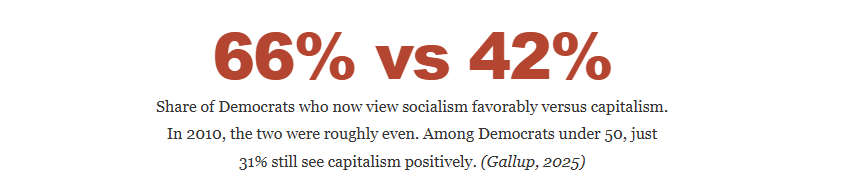
On January 1st, a self-described democratic socialist was sworn in as mayor of the largest city in America. Weeks before that, socialist candidates swept a wave of primaries, sending the largest bloc of socialist legislators in New York history to Albany and two more to Congress. Then billionaire governor JB Pritzker went on CNN, was asked whether the socialist wins were a good thing, and answered that they are “the recipe for winning in 2026 and beyond.” Make no mistake, democratic socialism is no longer a fringe idea in America. It’s a live political program with real momentum. The only question that matters is what it delivers after you buy it.
I have been managing money for a very long time through many market cycles, from manias to crashes. Over that time, I have learned to separate what a policy promises from what it produces. So let’s do that honestly here, starting with a concession most defenders of markets won’t make: Capitalism has flaws.

Tweet of the Day
New UPDATED Trading Rules With Desktop Printout
“Want to achieve better long-term success in managing your portfolio? Here are our 15-trading rules for managing market risks.”
Please subscribe to the daily commentary to receive these updates every morning before the opening bell.
If you found this blog useful, please send it to someone else, share it on social media, or contact us to set up a meeting.