
Presiding over his first Fed meeting, Kevin Warsh and the FOMC held rates at 3.50%-3.75%. Such was the fourth consecutive hold following a series of rate cuts. The decision for Warsh to hold rates steady was in little doubt. The Fed’s economic projections, aka the dot plot, and Warsh’s debut press conference were what every investor was paying close attention to, given the improvement in the labor market, 4+% inflation, and the bond market’s increasing odds of a rate hike by year’s end.
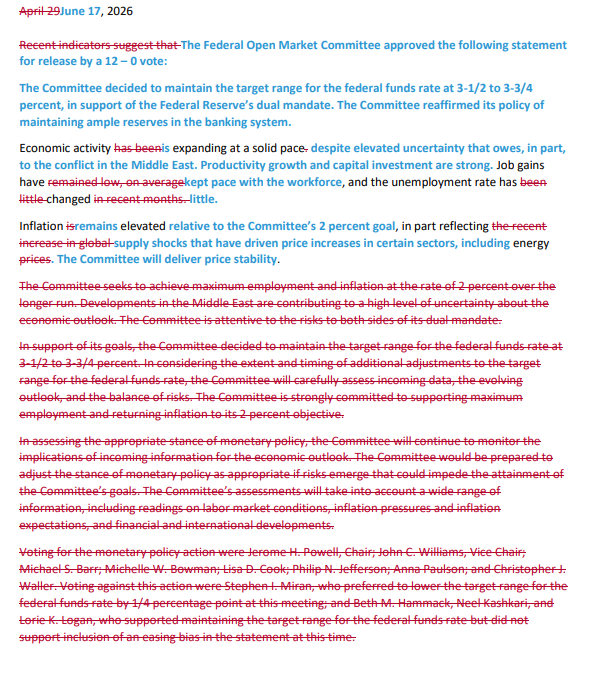
As shown below, there was a dramatic change to the Fed statement. It’s the shortest since the Alan Greenspan era and contains no forward guidance. Also of note, there were no dissenting votes, which suggests the Fed’s posture is more hawkish. The statement “The Committee will deliver price stability,” together with the higher inflation forecasts we discuss below, is definitely hawkish. That said, they also state, “its policy of maintaining ample reserves in the banking system.” This line may lead some to believe the Fed could do QE even if it hikes rates.
Further evidence of a hawkish shift was the rather large changes to the dot plot forecasts. The 2026 median Fed Funds rate projection for year-end moved from 3.4% to 3.8%, with next year’s rate higher by half a percentage point as well. 9 of the 19 participants think the Fed will hike rates this year. The higher forecasted Fed Funds rates were the result of higher inflation forecasts. Core PCE was revised higher by 0.6% for 2026 and by 0.3% for 2027. Bottom line: the projections and the Fed’s pledge to deliver price stability are leading markets to assume that Warsh and the Fed will hike rates. Please note that Warsh did not add his projections to the dot plot.
At his press conference, Warsh had three primary messages:
- Inflation: “2% inflation is the Fed’s long-held objective … I see no reason until we have delivered the 2% goal, to revisit that goal.”
- No forward guidance. “We agreed [it] was not well suited for the current policy juncture.” The Dot Plots will continue, but Warsh won’t participate.
- Warsh is launching 5 task forces to “propose next steps” for policymaker consideration, including on Fed communications.
What To Watch Today
Earnings

Economy

Market Trading Update
Yesterday, we discussed the impressive amount of liquidity continuing to enter the market. As noted in that commentary, retail continues to show up and “buy the dip,” and they’re not tiptoeing in this time.
Net flows into the roughly 100 largest US-domiciled equity index ETFs jumped north of $150 billion over the past month, the second-highest monthly haul on record in dollar terms. After spending much of the war scared of their own shadow and reluctant to buy the dip, individual investors have apparently decided the coast is clear.
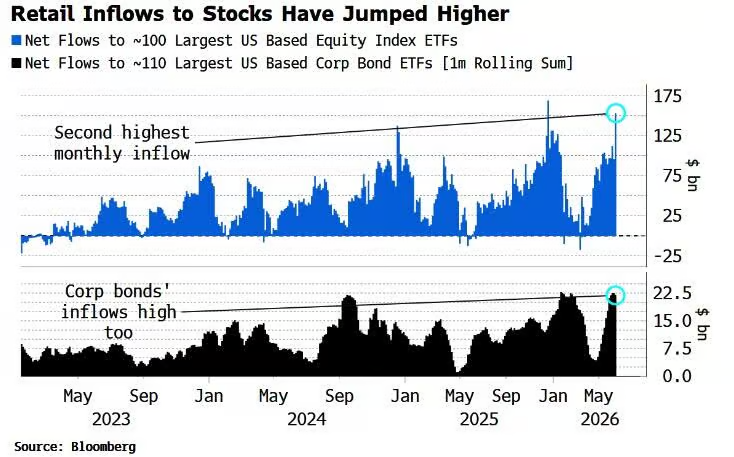
Corporate bond ETF flows hit a high, too, so this isn’t a narrow story. Blame SpaceX if you want a single culprit. Cathie Wood’s ARKK printed a massive inflow spike on the day of the IPO, and the fingerprints are all over the tape.

So is this early-cycle or late-cycle behavior? Make no mistake, it’s late. The anatomy of every rally runs the same way. Smart money spots the trend first, institutions pile in second, and the public shows up last, buying with little regard for valuation. That’s the Mania Phase on Dr. Jean-Paul Rodrigue’s bubble curve, and a surge in retail flows is precisely what marks the handoff from Awareness to Mania. When the crowd dives in, it has historically signaled the beginning of the end, not the start of something new.

Here’s where it gets interesting, though. Late-cycle is not the same as imminent reversal. The recent pullback found support right at the 50-day moving average near 7,267, and the index bounced and closed June 15 at 7,554, well above its 200-day average of 6,887. The RSI is running near 60, bullish but nowhere close to overbought, and 64% of S&P constituents now trade above their own 50-day line, the best breadth reading since early April. That’s a healthy tape, not a broken one.
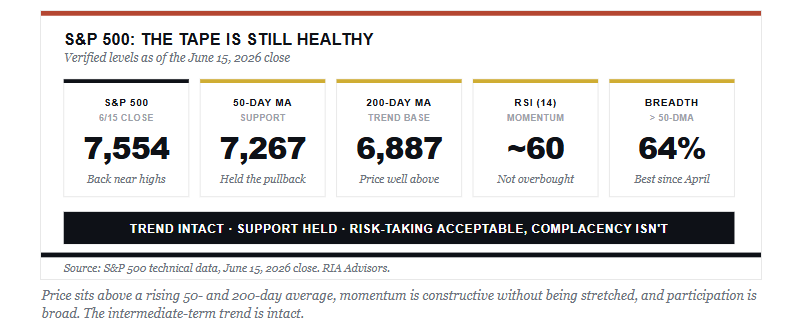
So should you fear another correction here? In the near term, the setup actually argues for MORE tolerance of risk, not less. As we noted yesterday, exponential markets usually run further than anyone expects, and they don’t correct by going sideways. The trend is intact, support held where it had to, and momentum remains constructive. Fighting that tape because the flows look frothy is how you miss the back half of a melt-up.
However, that is where the catch comes in, as frothy flows erode your margin of safety. Retail enthusiasm doesn’t cause the top; rather, it removes the cushion when the top finally arrives. We continue to suggest staying invested while the trend holds, but tighten the discipline. Honor your stops and trim the names that have run too far. Risk-taking is acceptable right now. Complacency is not.

Investor Allocations Offer Caution, But For When?
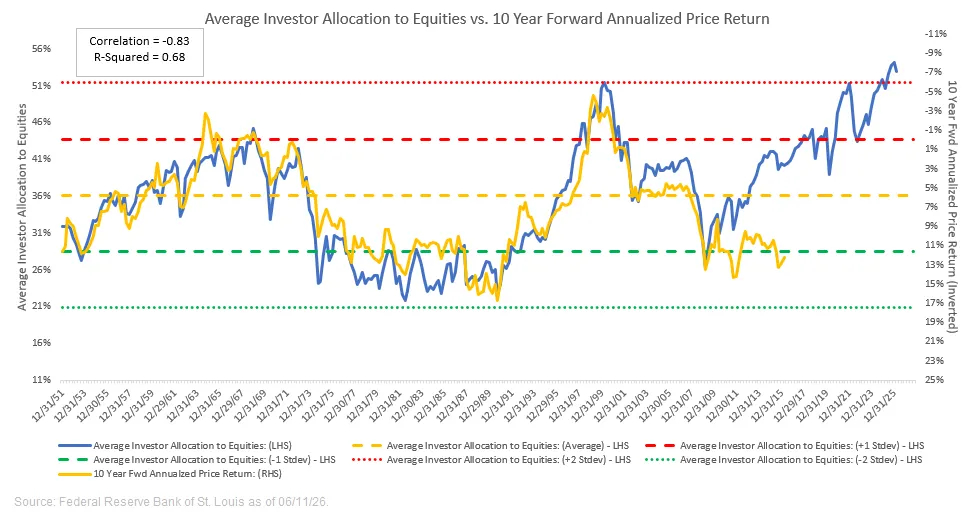
Jim Colquitt shared the stunning graph below in his latest Substack article. Before commenting on the graph, we share Jim’s comments.
The current reading of the Average Investor Allocation to Equities is 55.1%. This is the highest reading in the history of our dataset, which goes back to 1945.
This suggests that the market has never been more overvalued than it is right now*.
*Note: the data compiled is as of December 31, 2025.”
Fast forward to the recent quarter, and the updated Average Investor Allocation to Equities is 52.9%.
Our take: Jim’s graph, like many valuation graphs, portends market weakness over the next ten years. However, they also show a recent disconnect, as we have in Jim’s graph. Which leads to the question of whether this time is different. Not likely, but it could be. We think the bigger message is that investors should understand that valuations are extreme. Importantly, that doesn’t mean the long-running bullish trend is ending immediately. Further, the graph below and others don’t talk to the timing of 10-year returns. If the graph proves prescient, might the market rally for five more years before a massive correction, or might the correction start tomorrow, with an 8-year bullish trend following?

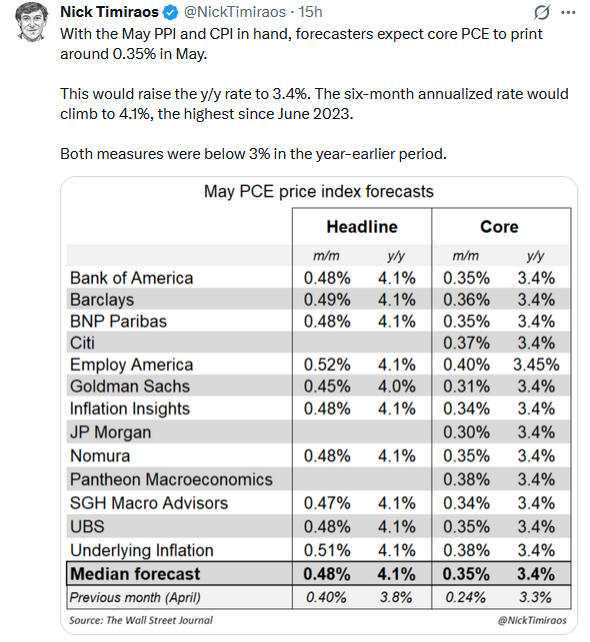
Tweet of the Day
New UPDATED Trading Rules With Desktop Printout
“Want to achieve better long-term success in managing your portfolio? Here are our 15-trading rules for managing market risks.”
Please subscribe to the daily commentary to receive these updates every morning before the opening bell.
If you found this blog useful, please send it to someone else, share it on social media, or contact us to set up a meeting.

