
After 15 years of guiding Apple to become the largest US company by market cap, Tim Cook stepped down as Apple’s CEO effective September 1. In his place, John Ternus, the company’s hardware engineering chief since 2021, will become Apple’s eighth CEO. The move was announced in April, but with the CEO turnover in September, Apple gave itself a long runway to better manage the transition. Ternus starts about two weeks before Apple’s mid-September iPhone launch, in which they will introduce the first foldable iPhone.
Interestingly, Apple didn’t pick a services leader, a software executive, or an AI specialist as its next CEO. Ternus is an engineer who has overseen the development of the iPhone, iPad, AirPods, Mac computers, and the Apple Watch. With Ternus, Apple appears to be focusing on hardware innovation, while most of its fellow mega-cap technology companies are chasing AI-related products. Some analysts consider Apple’s AI position a vulnerability. The long-delayed Siri overhaul, expected this fall, is reportedly built in part on licensed Google’s Gemini technology, and Apple Intelligence (AI) has drawn criticism. Picking Ternus, a hardware engineer to be the CEO, may be recognition that Apple’s edge lies in building the best devices for running AI rather than building the models. For more perspective, we discussed the path Apple may be taking on AI in The Apple AI Strategy: Discipline Over Hype.
Tim Cook leaves a formidable record, a market cap that grew 24x to above $4 trillion, and services revenue that crossed $100 billion annually. Ternus inherits headwinds including weak revenue and earnings growth, tariff exposure, memory-driven cost pressures that forced price increases, and clear signs that Apple lags in its AI offerings.
The Ternus bet is that Apple’s next chapter is in physical devices, not a model-building arms race.

What To Watch Today
Earnings

Economy

Market Trading Update
Yesterday, we walked through September’s seasonal record and a market gone strangely quiet heading into it. Today, the sequel that matters for risk: September sector seasonality, and where the ballast sits when volatility wakes up.
Start with the calm itself. The VIX printed 14.13 on Friday, its lowest of 2026. Even after ticking back near 15 by midday Tuesday, it sits well below its usual level for early September. The S&P 500 hovers around 7,685, a whisper below its record. Ninety-one sessions have passed without a 2% down day. That’s not stability. That’s a spring wound tight.

Notice in the chart above how volatility behaves on the calendar. The median VIX since 1990 climbs from the mid-16s in late August toward 18 by mid-September and 19 by early October. We’re walking into that window priced for the opposite. Bob Farrell’s Rule #9 still applies: when everyone agrees on something, something else usually happens. Right now everyone agrees the tape is bulletproof.
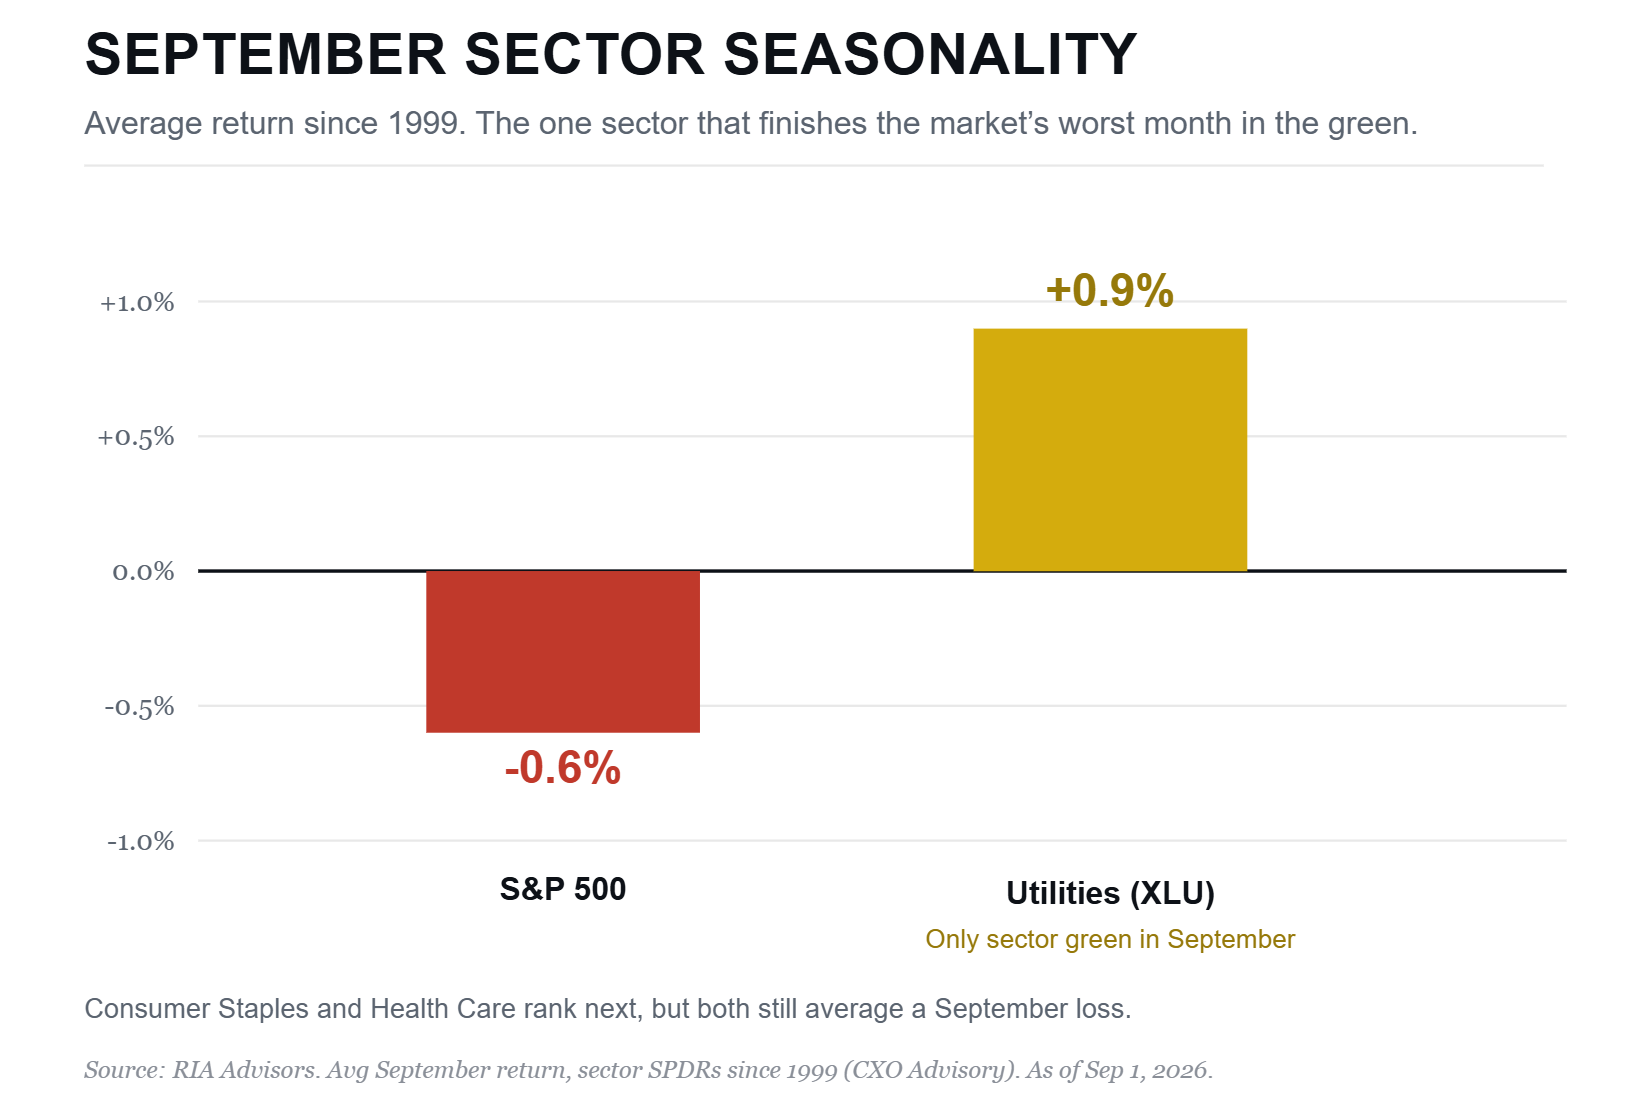
Here’s the part most seasonality talk skips. September is the worst month for the index, but it isn’t uniformly red beneath the surface. Since 1999, Utilities is the one sector that’s closed September GREEN, averaging close to a 1% gain while the S&P lost 0.6%. Consumer Staples and Health Care rank next. They don’t turn positive; they just bleed less. That’s ballast, not a bunker.
The cross-asset read rhymes. Gold sits in its own seasonal window into early October, with GLD near $407, and low-volatility funds tend to earn their keep right when the tape turns jumpy. To wit: the one classic hedge I’d be careful leaning on this year is long-duration Treasuries. With the 10-year back at 4.76% and a Fed under Warsh openly weighing a September hike, bonds aren’t the reliable shock absorber they were in calmer cycles.
There’s a second reason to shade defensive. Nvidia and Micron alone drive roughly a third of this year’s earnings growth. The top ten names explain two-thirds of it. Trimming the crowded winners toward target and rotating a slice into Utilities, Staples, and low-vol does double duty. It hedges the season and thins the concentration.
We suggest that the next move is to trim the most stretched tech back to weight, lift defensive and low-vol exposure, and let cash ride. None of these forecasts that September breaks. It’s ballast bought while it’s still cheap. Buy the umbrella while the sky’s blue. It costs a lot more once the rain starts, if they’ll sell you one at all.

Liquidity Always Has A Price
It’s worth comparing sports betting to Wall Street because both operate on the same underlying profit motives: the house extracts a liquidity fee regardless of outcome. FOr investors, knowing the cost of liquidity is imperative, whether it’s disclosed or hidden.
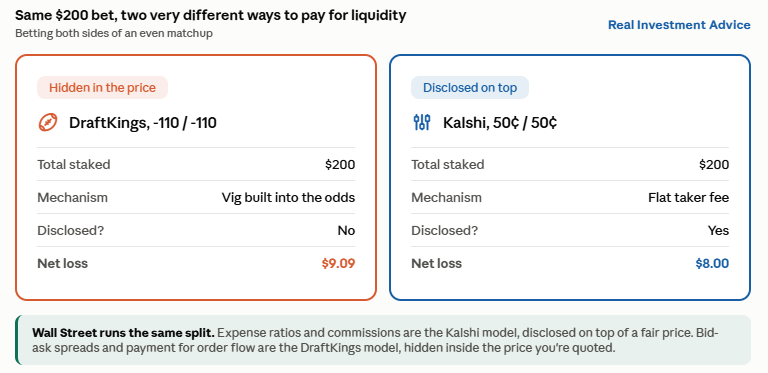
To help explain this concept, let’s start with a hypothetical sports bet in which the odds are even for two teams playing each other. Our first bet is to wager $100 on both teams playing using a traditional sportsbook like a casino or online betting site like DraftKings. In this case, the cost of liquidity is implied in the odds. Assuming the odds are -110 for both teams, the bet on the team that lost will lose the $100. The winning bet only collects $90.91 (Profit = $100 × (100 ÷ 110) = $100 × 0.9091 = $90.91). The net cost for both trades is $9.91, or 4.95%.
Now we do the same bet on a prediction market like Kalshi, buying $100 of each team’s contract at an even 50 cents each. Kalshi, instead of posting odds, charges a “taker fee“, which works out to about $8 on the same $200. The liquidity costs for our bets ranges from 4.00% to 4.95%.
Wall Street runs similarly. Some costs are disclosed, like mutual fund and ETF expense ratios or commissions. This is like Kalshi’s fee. Other costs hide inside the price. These include the bid-ask spread and payment for order flow arrangements. These often-small costs add up.
Every financial market, regulated or not, embeds a fee for the dealer providing liquidity by taking the other side of your trade. The question worth asking of any exchange, broker, or sportsbook is whether the cost is disclosed or built into the price. We bring this to your attention because we were just quoted a 2% bid-offer spread to sell a small, illiquid municipal bond. We bet the investor didn’t account for the cost when they bought it.

Tweet of the Day

New UPDATED Trading Rules With Desktop Printout
“Want to achieve better long-term success in managing your portfolio? Here are our 15-trading rules for managing market risks.”
Please subscribe to the daily commentary to receive these updates every morning before the opening bell.
If you found this blog useful, please send it to someone else, share it on social media, or contact us to set up a meeting.