
When businesses have concerns about the economy, they often lay off or stop hiring temporary workers before firing full-time employees. For that reason, temporary staffing employment has been a reliable early warning signal of labor market weakness and recessions. As we share below, declines in temporary help services employment preceded the last three recessions by 6 to 12 months in each case.
The relationship makes sense. When uncertainty rises, companies release temporary workers, as permanent headcount can be expensive to let go of and equally costly to rehire when needed again. Recently, however, the leading relationship between the number of temporary workers and the total number of employees has changed. The graph below shows an odd divergence between headline payroll growth and the number of temporary workers. The number of total employees has been rising steadily since the COVID lows, albeit employee growth has stagnated lately. To the contrary, the number of temporary workers has been declining steadily since 2022. It now sits below the prior peaks leading into each recession. Moreover, consider that the economy has grown significantly since those prior recessions. Accordingly, the ratio of temporary workers to total employees is now at the level of the prior recession troughs.
This raises a question worth pondering: are temporary workers not as vital to today’s economy, or is it sending a concerning signal that the labor market will soon falter? Before coming to any conclusions, realize that many old rules of thumb that helped forecast the economy have failed to work since COVID. For instance, the Conference Board’s Leading Economic Indicators have fallen steadily since 2022 and sit well below their 2020 trough.
What To Watch Today
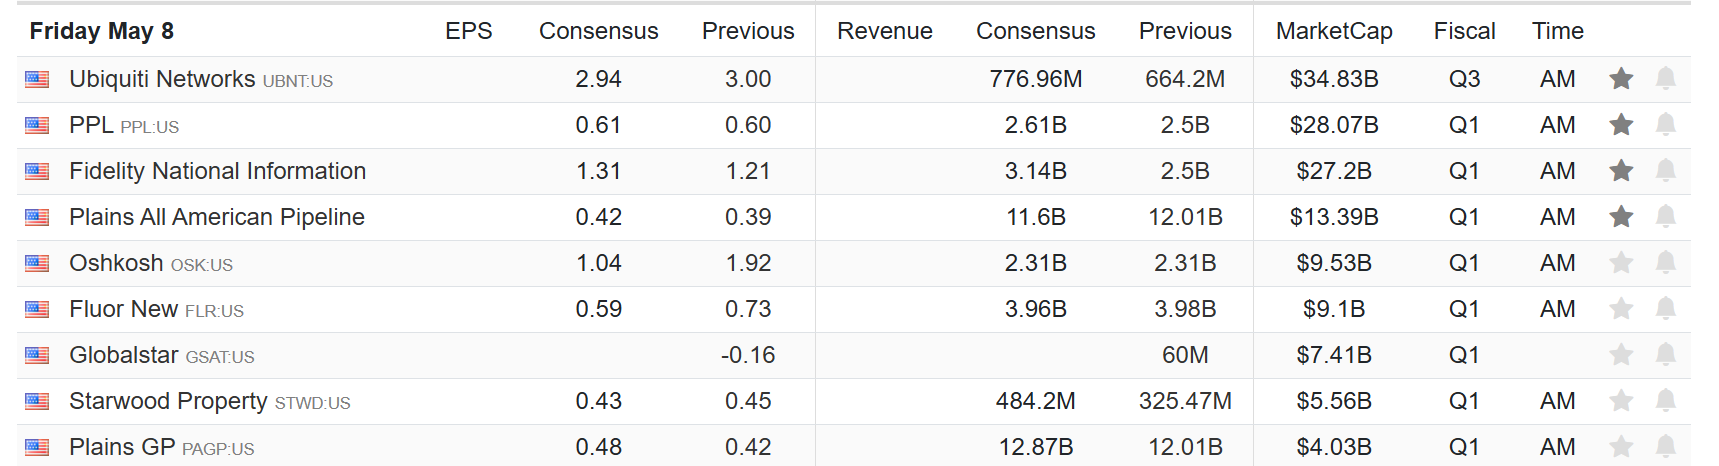
Earnings
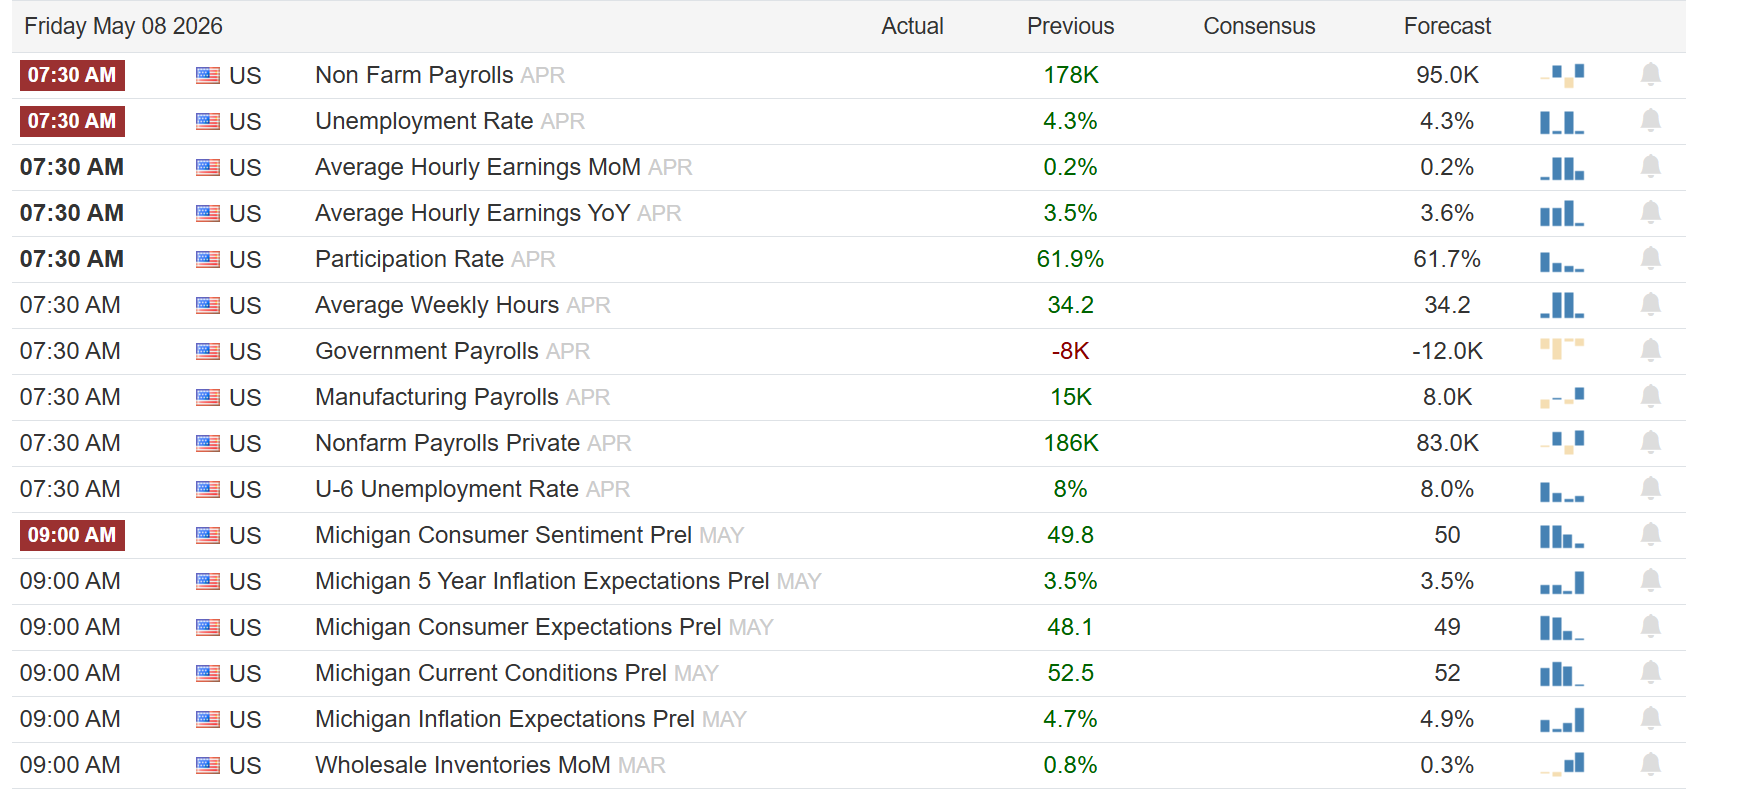
Economy
Market Trading Update
Yesterday, we discussed the issues with recent market breadth. Part of that breadth problem is due to the surge in Semiconductor stocks, which for a small sector, has made an significant impact on the broader S&P 500 index.
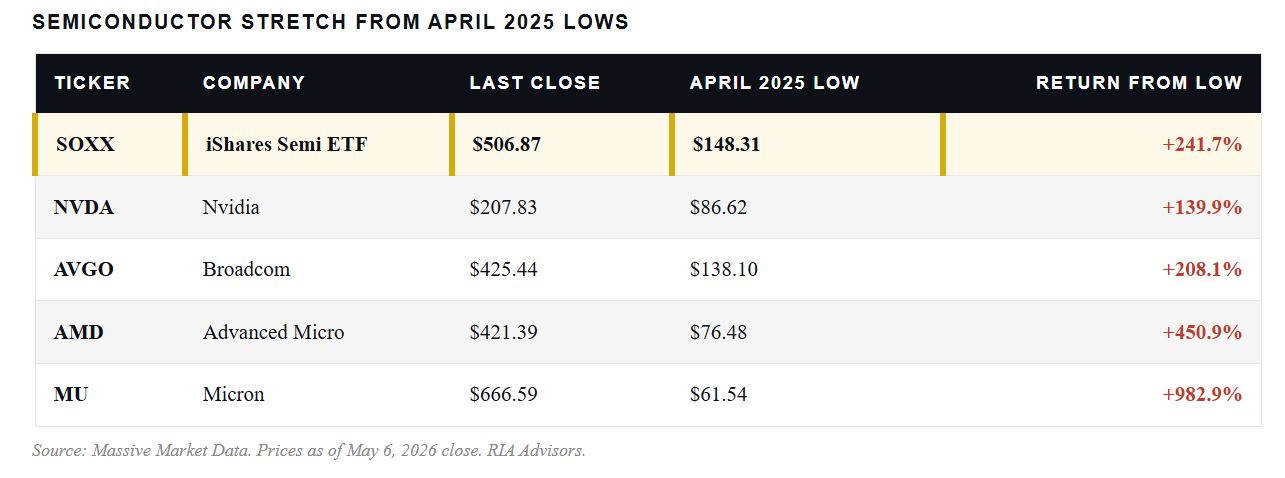
The semiconductor rally crossed a line this week. SOXX, the iShares Semiconductor ETF, closed Wednesday at $506.87, a gain of roughly 242% from the April 2025 low of $148.31. Most of that move has been compressed into the last two months. Since mid-March alone, SOXX has tacked on another 57%. The chart is now textbook parabolic, and parabolic charts almost never end politely.
I get the bull case. AI capex is real, hyperscaler orders are real, and foundry utilization is real. Nvidia, Broadcom, and TSMC are delivering numbers that justify premium multiples. So far, so good. However, here is the problem with the current setup. SOXX is trading 62% above its 200-day moving average and 34% above its 50-day. Readings that stretched are the back end of a move, not the middle.

Notice in the chart above how the slope of the advance has steepened in each successive month. That is the signature of a momentum trade pulling in late buyers, not of fundamentals catching up to price. Look across the complex and the dispersion is striking. Micron is up nearly 1,000% off its April 2025 low. AMD is up roughly 450%. Nvidia, the index’s anchor, is up “only” 140%. The stocks that crashed hardest a year ago have rallied the most in the recovery, which is exactly how late-cycle chase trades behave.
If you have ridden this rally, congratulations. Now take some chips off the table. Trim, raise stops to the 50-DMA at roughly $377, and rebalance back to your strategic weight. You don’t have to sell everything to manage risk. You just can’t let an oversized position carry you over the next cliff.
If you are chasing it now, don’t. Buying parabolic moves isn’t investing. It’s gambling on the greater fool. Wait for the inevitable test of the 50-DMA, which would deliver a 25% pullback from current levels, and consider scaling in there if the fundamentals still fit your thesis. Patience is free. Performance chasing is expensive.
The semiconductor rally has likely fully priced in 2026 earnings. From here, you are paying for 2027 and 2028 growth in a sector where the cycle has not been repealed. Make no mistake, the rally has been spectacular. The exit will be too.

JOLTs & ADP
Heading into today’s BLS employment report, it’s worth reviewing this week’s JOLTS and ADP employment reports as well as the ISM manufacturing and services employment surveys.
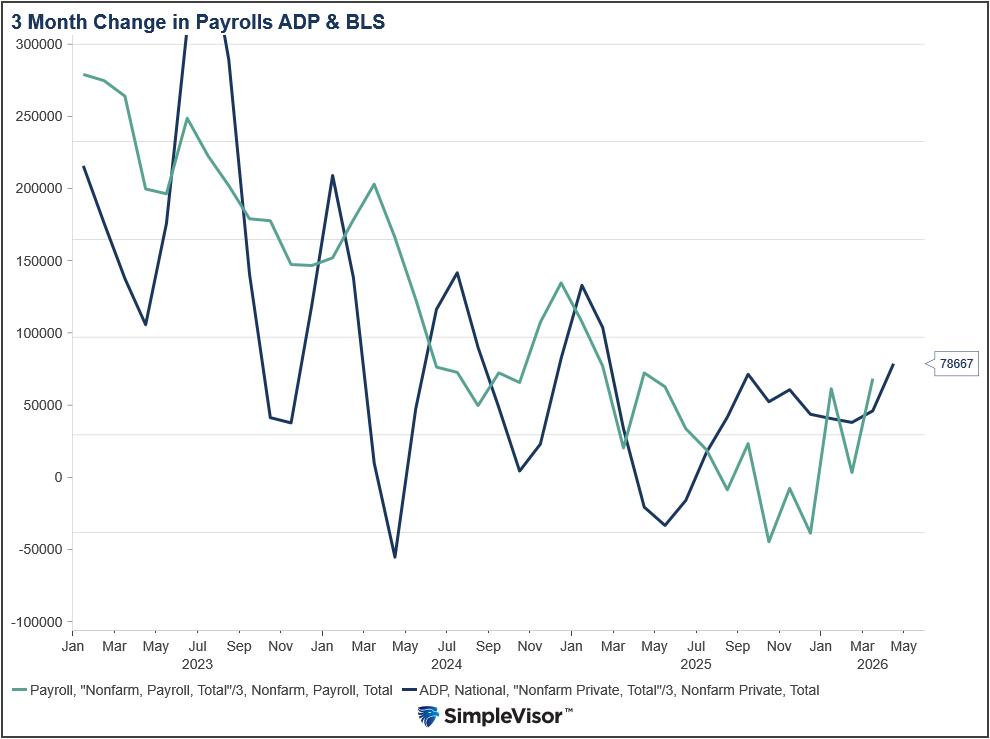
ADP: Private sector employment rose by 109,000 jobs in April, the largest increase since January 2025 and above market expectations of 97,000. While improving, the data still points to what Fed Chair Powell describes as a “low-hire, low-fire” labor market. Employers have largely avoided layoffs but have reduced hiring. As the graph below shows, both ADP and BLS payroll data have been improving recently but remain well below their levels in 2023 and 2024.
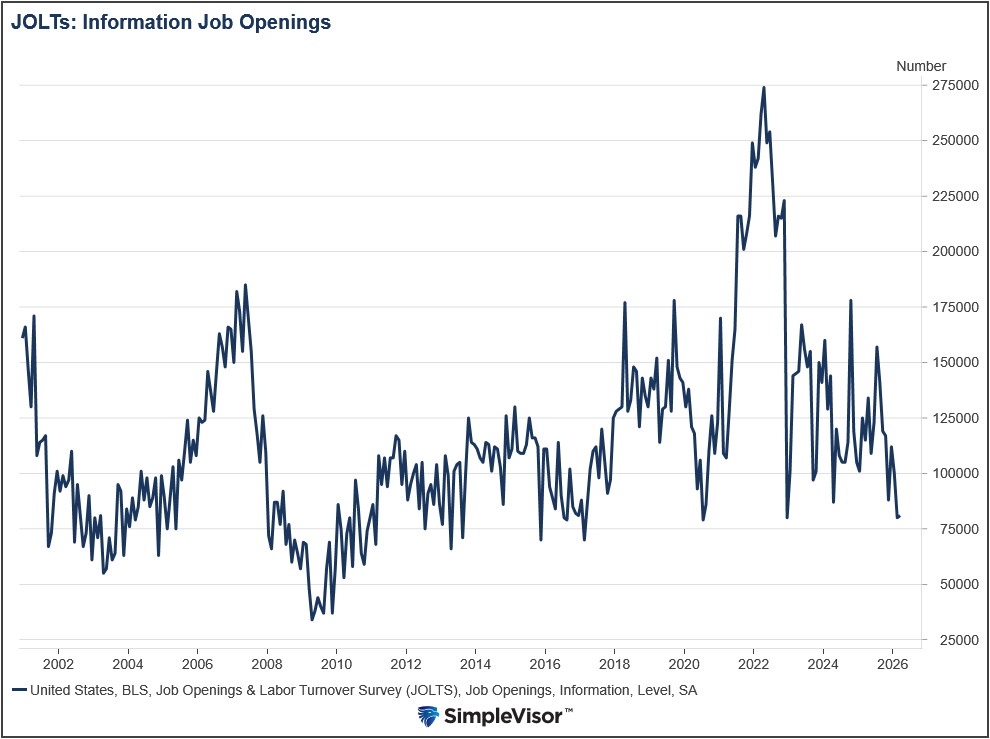
JOLTs: Job openings fell by 56,000 to 6.866 million, while hires rose to 5.6 million – the biggest increase since May 2024. Total separations were little changed at 5.4 million, with quits at 3.2 million and layoffs at 1.9 million. As shown in the second graph, information job openings, while volatile, are at the lower end of its 8 year range. This is the sector to watch for signs that AI-related layoffs in tech are beginning to appear in the data.
ISM: The ISM Services Employment Index contracted for the second consecutive month, reading 48.0%. That was up from March’s 45.2% but below the 50 expansion threshold. The ISM Manufacturing Employment Index fell to 46.4%, down 2.3 points from March’s 48.7% and also pointing to contraction in the labor market.
Tweet of the Day

“Want to achieve better long-term success in managing your portfolio? Here are our 15-trading rules for managing market risks.”
Please subscribe to the daily commentary to receive these updates every morning before the opening bell.
If you found this blog useful, please send it to someone else, share it on social media, or contact us to set up a meeting.

