
🔎 At a Glance
- Parabolic Semiconductor Rally: What Breaks The Trade?
- Market Brief & Technical Review
- From Lance’s Desk: Dollar Dominance Remains Alive And Well (Part 1) – RIA
- Market stats, screens, and risk indicators
🏛️ Market Brief – AI Validation Fuels A Ninth Weekly Advance
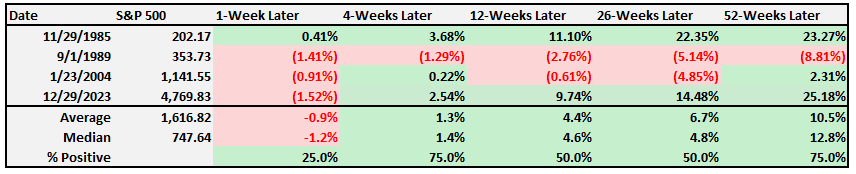
The headline tape made fresh history. The S&P 500 closed Friday at 7,580.06, finishing up 1.43% on the week and posting its ninth consecutive weekly gain. That’s the longest weekly winning streak since 2024, and only the 5th time since 1965 that has occurred. While markets previously saw weakness following such streaks, the 24- and 52-week outcomes were primarily positive, except in 1989.
However, the Russell 2000 actually fell 0.59% to 2,919, a reminder that the small-cap participation everyone hoped for in March still hasn’t shown up despite the megacap rip. Underneath the headline, the dispersion that’s defined this rally has only widened. Technology and financials carried Friday’s tape while energy lagged on falling crude.
Two macro stories collided midweek, and the market chose to celebrate one and shrug at the other. First, the April PCE inflation print landed Thursday morning with the highest headline reading in nearly three years at 3.8% year-over-year, with core PCE at 3.3%. However, the monthly core reading came in at 0.2%, below the 0.3% consensus, and that softer monthly tone gave the Fed-cut camp something to work with. Second, Axios reported Thursday that the US and Iran had reached a tentative 60-day Memorandum of Understanding to extend the ceasefire framework. Oil promptly slid to a six-week low near $89 WTI, the VIX collapsed to its lowest reading since January, ending the week at 15.32, and the rally accelerated. The combination of a softer core PCE and a reduced geopolitical premium handed equity bulls everything they wanted in two sessions.
The dominant micro story came after the bell on Thursday. Dell Technologies reported fiscal Q1 results that were, by any measure, extraordinary, with revenue hitting a record $43.8 billion, up 88% year-over-year, $24.4 billion in AI orders booked, and $16.1 billion in AI server revenue recognized. That is simply astonishing. However, what really drove the price on Friday was management raising the FY27 AI server revenue target to $60 billion, along with full-year revenue at the midpoint of $167 billion, a 50% annual increase. Dell’s report validated the AI capex thesis at exactly the moment the market was beginning to question how far the parabolic move could extend. The bull case strengthened alongside the asymmetry.
Cross-asset moves followed the same script. Treasury yields eased modestly on the cooler core PCE, the dollar softened slightly, and gold extended to roughly $4,576. Bitcoin remains in a bear market and has slid below $73,700. Beneath the AI exuberance, however, a separate undercurrent of institutional skepticism is building around AI infrastructure overcapacity. Several portfolio managers flagged commercial budget fatigue as a near-term risk, with reports surfacing that Microsoft trimmed its code license spending. The narrative isn’t unbroken, but it is being questioned.

📈Technical Backdrop – New Highs, Thinner Air
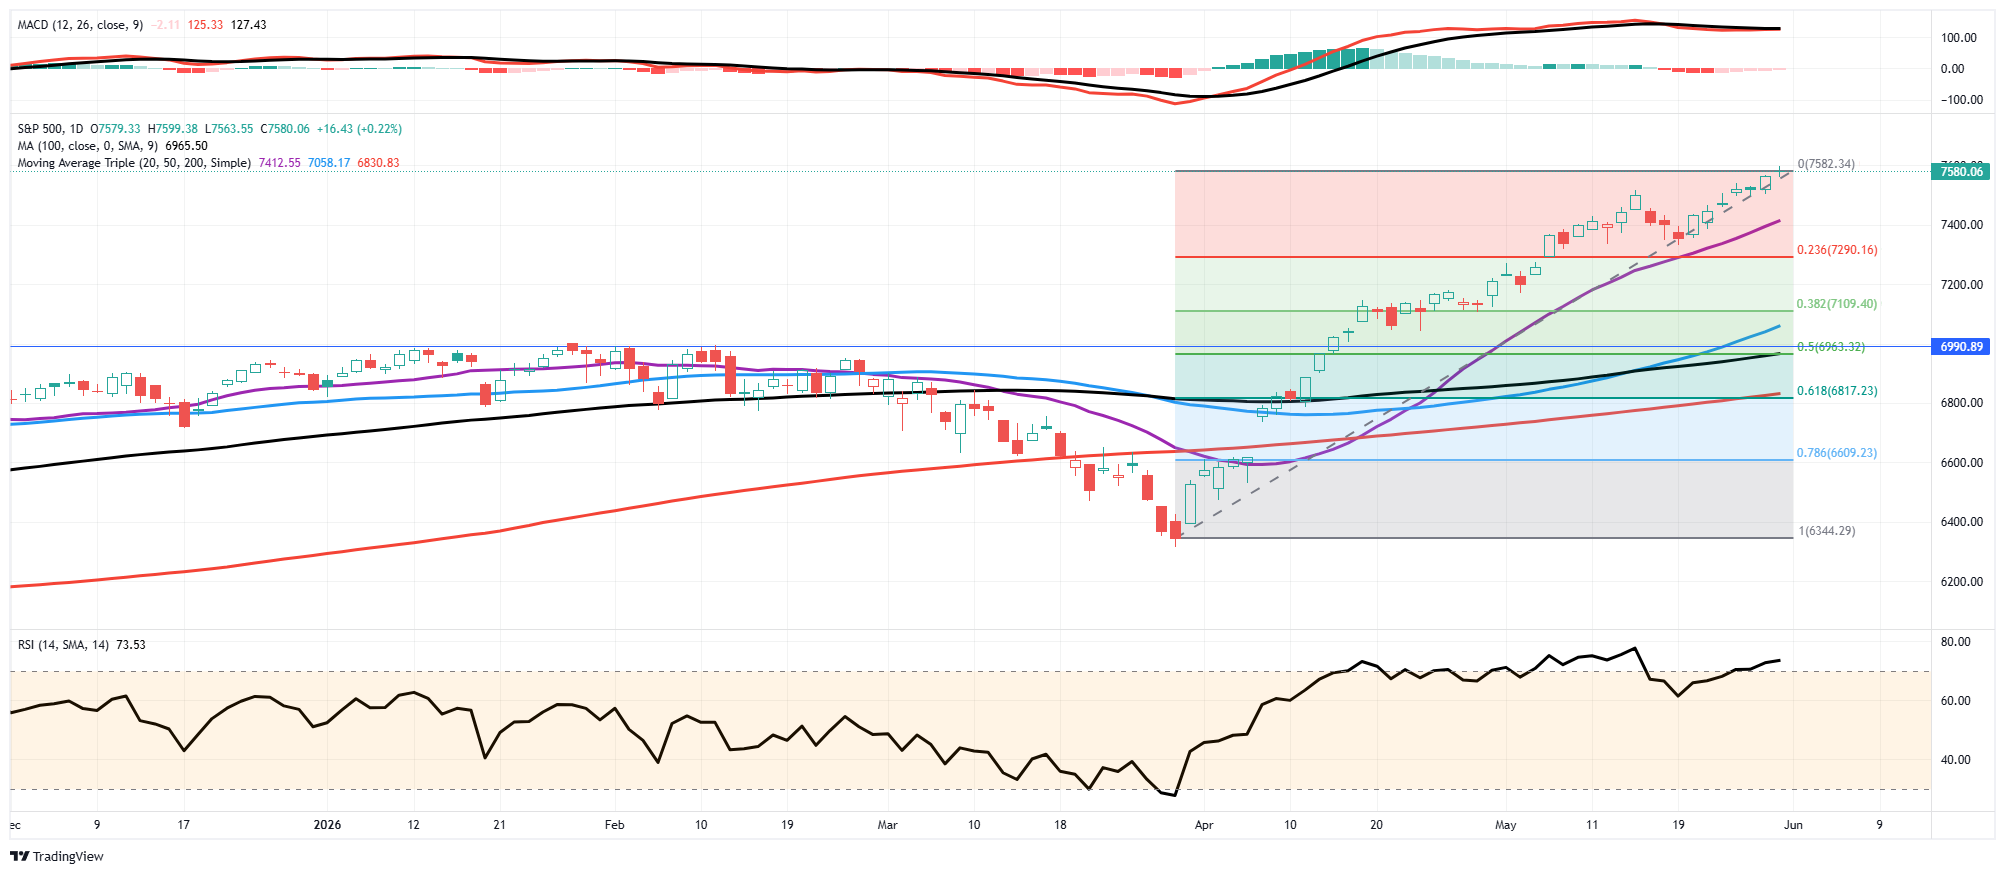
The trend is unambiguous. The S&P 500 closed Friday at 7,580.06, posting fresh all-time highs on three of the last five sessions and clearing the prior closing record by roughly 1.4% on the week. The index sits firmly above its 50-day moving average at 7,058 and 200-day moving average at 6,830, putting price roughly 7% above the 50-DMA and nearly 11% above the 200-DMA. On the momentum side, the 14-day RSI has climbed above 70 and is back in overbought territory. Additionally, the MACD has expanded with the new highs and is crossing back above its signal line.
By the standard measures, the bull trend that resumed after the April 7 Iran ceasefire is fully intact and accelerating. A retracement to the previous all-time highs, where the market broke out after the April correction is about 7.5% lower. While such a correction should be expected, givenj the high levels of complacency during the advance, such a decline will fell far worse that it actually is.
However, the warning signs underneath the surface are getting louder, not quieter. Breadth continues to deteriorate. The percentage of S&P 500 members trading above their 200-day moving average is still hovering near 57%, essentially unchanged from a week ago despite the index hitting new records. Equal-weight is now lagging cap-weight by a meaningful margin over the trailing month, and the cumulative advance-decline line has been making lower highs even as the index makes higher ones. Notably, that’s a textbook bearish divergence. The Nasdaq remains the standout, but the lift is being delivered by a handful of AI-linked mega-caps doing the heavy lifting.
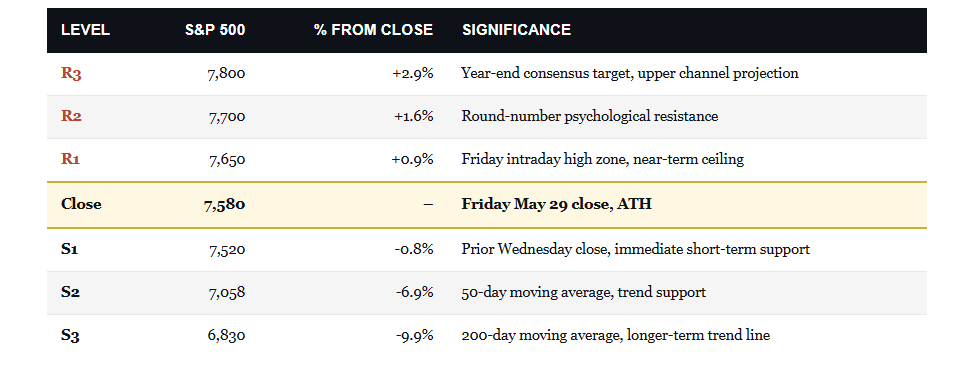
The technical setup for next week makes adding more to equity exposure at current levels uncomfortable. Above the close, resistance sits at the round-number psychological level of 7,700, followed by the consensus year-end target zone near 7,800. Below, the rapidly trailing 5-day moving average around 7,550 is now the first short-term floor, and the prior Wednesday close at 7,520 acts as immediate support. Importantly, a break of 7,520 opens significant room before the next major support. The upside to consensus year-end targets is 2% to 3%. The downside to a routine test of the 200-DMA is 10%.
For positioning, the indicated trade is to use these new highs to harvest gains, not to chase them. Specifically, we continue to suggest trimming positions that have run materially above target weight. Tighten trailing stops on the most extended names, semis especially. Hold new cash deployments back until breadth confirms or a technical break invalidates the trend. With the VIX at 15.32, near its lowest level since January, downside protection is unusually cheap right now.
🔑 Key Catalysts Next Week
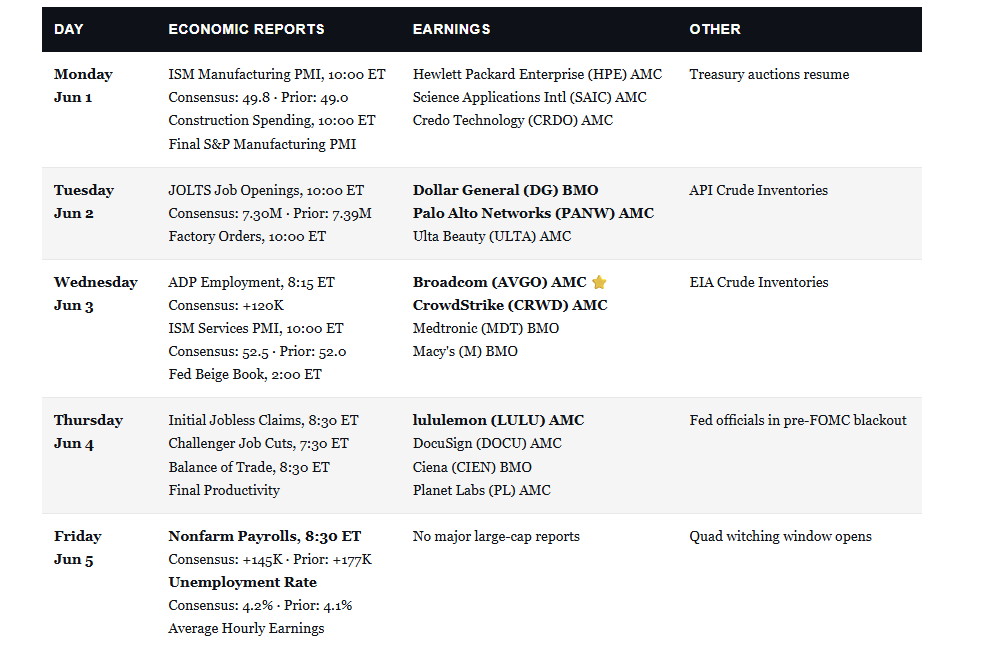
The week of June 1 is the heaviest catalyst calendar of the quarter with three threads colliding all at once. First, jobs and inflation data dominate the macro side, with ISM Manufacturing kicking off Monday and Nonfarm Payrolls closing Friday. Second, Broadcom (AVGO) reports Wednesday after the close. After Dell’s blowout Thursday night, the bar Hock Tan needs to clear has been raised significantly. Third, the Iran 60-day Memorandum of Understanding announced Thursday still needs formal ratification within the next two weeks, and any breakdown in those talks would reverse the volatility compression that fueled this past week’s rally.
On the macro side, the order matters. Monday’s ISM Manufacturing print will frame the week and the consensus expects 49.8, a hair below the expansion line. A surprise above 50 would confirm the manufacturing reset narrative and reinforce the bull case for industrials and cyclicals. Conversely, a miss below 49 would reawaken the late-cycle slowdown worry given that Q1 GDP was just revised down to 1.6%. Tuesday brings JOLTS plus Factory Orders, followed on Wednesday by ADP private payrolls and ISM Services, the more important of the two PMIs given that services dominate US output. Friday’s NFP is the data the Fed actually weighs and consensus sits at 145,000 with the unemployment rate at 4.2%. Notably, the asymmetry favors a downside surprise and a print below 100,000 would put September cuts squarely back on the table.
What investors should watch most is the Broadcom (AVGO) setup as mentioned above. The options markets are pricing an implied move of roughly 7% on the print, well above the historical average and the most asymmetric outcome would be a beat with cautious forward guidance. AVGO is priced for management to extend its “$100 billion in AI chip revenue by 2027” line of sight into a hard number, but anything short of that, combined with hyperscaler capex moderation in the commentary, would trigger the kind of broad semiconductor de-risking that the technicals already flag as overdue. The macro releases matter. However, Broadcom Wednesday is the trade the entire tape is built around right now.
Need Help With Your Investing Strategy?
Are you looking for comprehensive financial, insurance, and estate planning services? Need a risk-managed portfolio management strategy to grow and protect your savings? Whatever your needs are, we are here to help.

💰 The Parabolic Semiconductor Rally
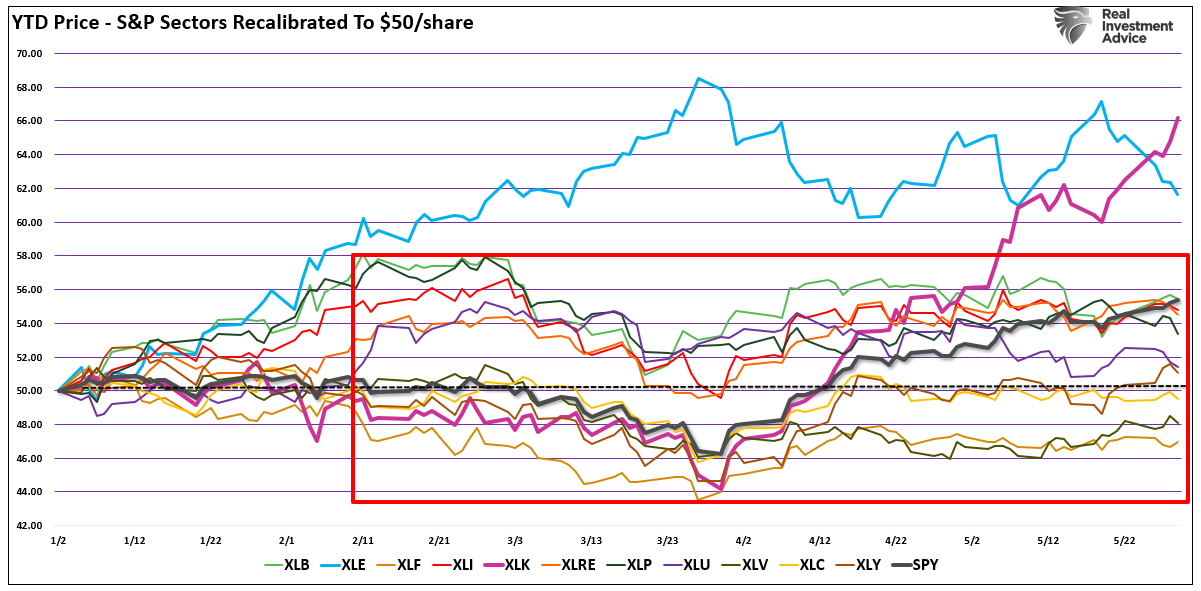
Previously, we laid out the case that market leadership is narrow, increasing summer risk. This week I want to focus the lens on Friday’s Daily Market Commentary topic: “The parabolic semiconductor rally.” That short commentary generated several questions that deserved a more complete response. So, I want to use today’s BullBearReport to expand on my thoughts on the trade: it’s not just leadership; it’s nearly the entire trade.
I mentioned last week that, across the market sectors, roughly $23 billion has flowed into technology ETFs since February; however, almost every other sector has been flat to down since prior to the Iran crisis. Most importantly, it is worth noting that even Energy has failed to rally despite the surge in oil prices and Technology has now surpassed its early year outperformance.
However, that is just the major sectors of the S&P 500. The sector we want to focus on today is the parabolic semiconductor sector, for which we will use the VanEck Semiconductor ETF (SMH), which closed Friday at $598, putting it 168% above its 50-month moving average. That is the most extreme deviation from trend in any major sector ETF on record. The setup is unique, and the asymmetry has turned against holders. Here’s why semis could break first, and how to position accordingly.
The standard measures of stretched are useful, but they understate what’s happening in semiconductors. Bank of America’s technical desk flagged the SMH weekly RSI above 80 for two consecutive weeks, an all-time high reading and only the fifth such instance since 2012. The fund trades roughly 150% above its 200-week moving average, exceeding the prior peaks of 100% to 108% set in 2021 and 2024. Both of those readings preceded drawdowns of more than 30%.
However, the cleanest single picture is the 50-month moving average. The 200-month MA at $88 is too far below the current price to be a useful mean reversion target. The 50-month MA at $224 is the actual trend that has tracked semis through every cycle since 2002.
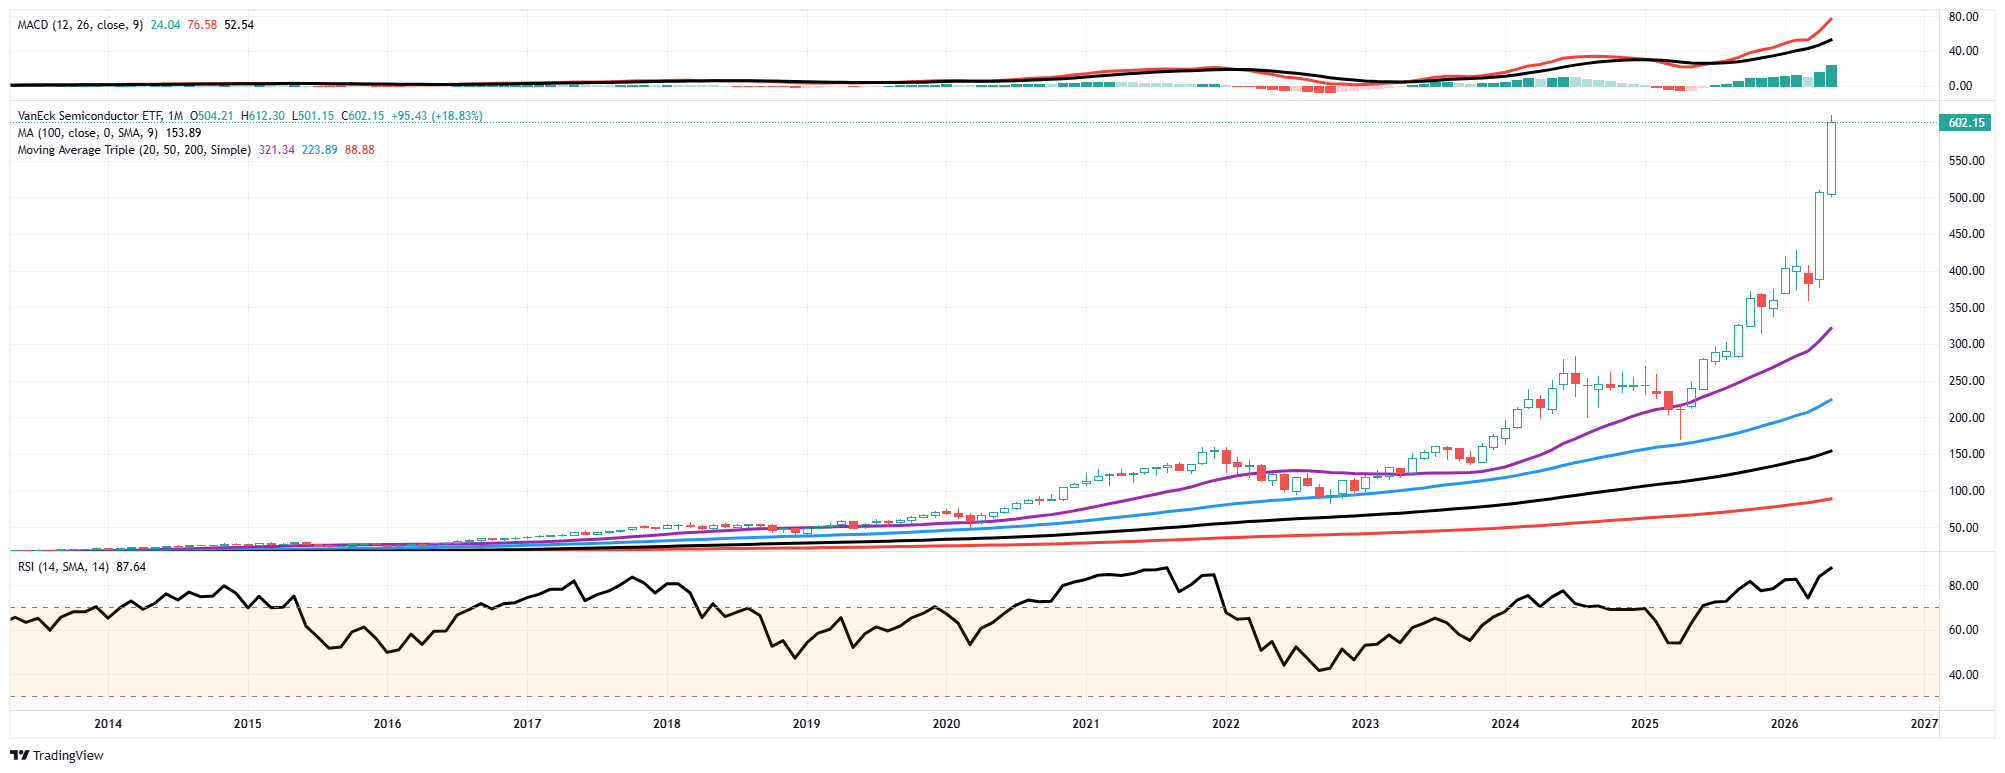
Today, SMH sits 168% above that line. The prior peak deviation was 95% when the same parabolic semiconductor surge occurred in 2021, and that move resolved in a 49% drawdown over the following twelve months. By comparison, today’s reading nearly doubles the prior record.

The picture is unambiguous. Today’s reading isn’t part of the historical range. It is the historical range plus an additional 70 percentage points of overshoot. Mean reversion to the 50-MMA from $598 to $224 implies a ~63% price decline. That’s not a forecast, just arithmetic.
The question is what would cause such a mean-reverting event?
The Customers Are Five Companies
Every parabolic move eventually runs into a customer concentration problem, and the semiconductor rally has the most extreme version I’ve seen in my career. The entire AI infrastructure thesis rests on five hyperscalers continuing to underwrite the buildout. Microsoft, Meta, Amazon, Google, and Oracle account for the overwhelming majority of demand for forward AI chips. Their combined 2026 capital expenditure is projected above $800 billion, and the SMH basket is priced for that number to keep accelerating into 2028.
Importantly, the dependency runs in only one direction. The hyperscalers can throttle capex at will. They have the cash flow, the balance sheet flexibility, and shareholder bases that increasingly want to see returns on the prior years’ spending. Semiconductor names cannot create demand in a reciprocal manner. They are at the mercy of the hyperscalers’ ongoing spending commitments. Therefore, the moment any single hyperscaler tempers forward capex guidance, the bid under Nvidia, Broadcom, AMD, and Micron evaporates instantly.

The customer dependency runs five-to-one, and the supplier dependency is even tighter. Notice in the diagram above that more than half of SMH is exposed to four names that all rely on the same five buyers. There is no diversification inside the basket. If hyperscalers throttle, the entire ETF moves together.
“When 73% of professional money managers sit on the same side of a trade, the marginal buyer is already in. There is no second leg of buyers waiting to bid the dip.” Bank of America’s May Fund Manager Survey identified long global semiconductors as the most crowded trade on Wall Street at a record 73% reading.
The answer to why the parabolic semiconductor move has been so sharp, and why fundamentals do not seem to matter, comes down to a single word: Gamma.
The Gamma Squeeze Is Doing The Work
The fundamental story explains why semis are extended. It doesn’t explain why the move went vertical over the last six weeks. That mechanical acceleration is a textbook gamma squeeze, and understanding the plumbing matters because the same mechanism that drove the move up is what makes the unwind violent on the way down.
The chain of events is straightforward. Retail and momentum traders pile into short-dated call options on Nvidia, Broadcom, and SMH. Dealers who sold those calls are short gamma and must buy the underlying stock to stay delta-neutral as the price rises. Their hedging buys push the stock higher, which forces more hedging, which pushes the stock higher still. The feedback loop runs until call buying stalls or expiration removes the options from the dealers’ books.
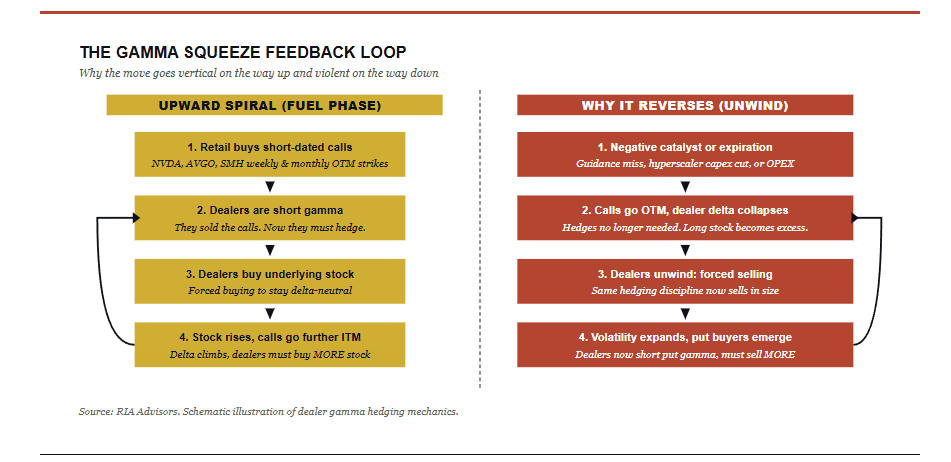
The mechanics of this particular parabolic semiconductor advance are symmetric, and that’s the danger. Every share that dealers were forced to buy on the way up becomes a share they’re forced to sell on the way down. The buying and selling aren’t driven by fundamentals. They’re driven by hedging discipline against a derivatives book. When the catalyst hits, whether it’s a guidance disappointment, a hyperscaler capex cut, or simply monthly options expiration removing the gamma support, the loop reverses.
An additional wrinkle makes the unwind worse than the rally. Once stocks start falling, put buying replaces call buying. Dealers are now short put gamma and must sell stock as prices fall to stay hedged. The selling begets more selling, just as the buying begets more buying. We saw this exact pattern in the August 2024 unwind, when SMH dropped 34% in roughly six weeks despite no change in the underlying AI demand thesis. The fundamentals weren’t worse. The gamma was gone.
For positioning, the gamma backdrop changes how you think about hedging. Buying puts after the move starts is expensive because implied volatility has already expanded. The cheap insurance is bought before the unwind. That window is open today, but there is a high probability it will close after Broadcom reports earnings on Thursday if their guidance disappoints.
History Doesn’t Repeat, But It Rhymes Loudly
Every prior parabolic semiconductor move resolved the same way. The 2000 dot-com peak gave back 82%. By 2008, the GFC drawdown cost another 52%. In 2018, the trade war pulled the index back 30%. Then the 2022 rate-shock cycle delivered a 49% peak-to-trough decline, followed by a 34% reset during the 2024 August unwind. None of these were forecast in advance. Each was justified by a “different this time” narrative right up until the moment it wasn’t.
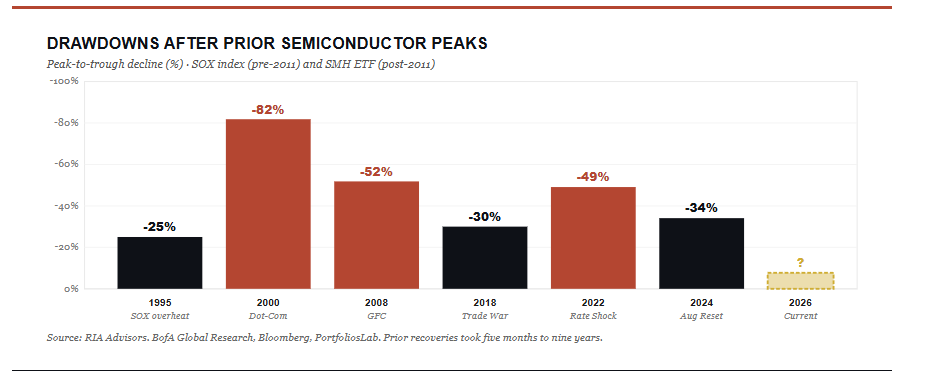
The 2000 entry on the chart matters most. That parabolic semiconductor move featured the same combination of features that defines today’s landscape: a “different this time” narrative built on a real technology transition, and a concentrated trade among professional investors. The post-peak drawdown was 82%, and SMH itself took roughly 9 years to recover to its prior high from the 2008 trough, which compounded the damage. The current setup doesn’t have to deliver that outcome. However, the prior parabolic peaks all delivered something materially worse than the typical correction. The current setup is more extreme than any of them, not less.
What Should Investors Do Now
Here’s the problem with selling a parabolic semiconductor move outright. Parabolic moves run further than anyone thinks possible before they break, and the final leg often delivers the largest gains of the entire move. Outright shorting is a way to get “carried out on a stretcher.” We saw it in 1999, and then the same trap caught short sellers in 2021, and again in early 2024. The discipline is to manage the asymmetry of the move, not to predict the top.
Specifically, here’s the playbook we’re applying in the model portfolios this week.
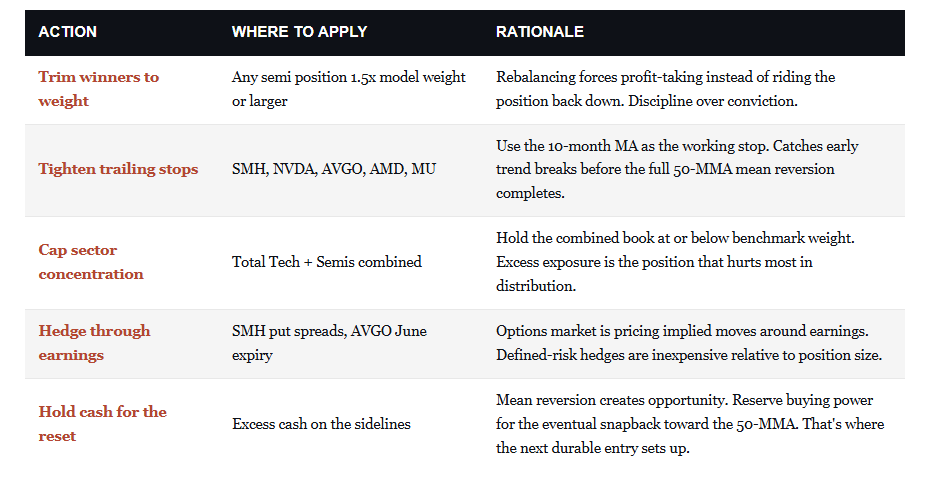
Make no mistake. This is not a “doom and gloom” analysis, and none of this is bearish on the secular AI thesis. The AI capex cycle is real, and the long-term demand for compute infrastructure is durable. However, secular themes regularly produce cyclical drawdowns of 30% to 50% on the way to their long-term payoff. Internet adoption was real in 2000, and the underlying secular story has played out across two decades. That truth didn’t save anyone who bought Cisco at the peak. Disciplined exposure management is how we participate in the secular story without owning the worst part of the cyclical drawdown.
Most crucially, trimming exposure is not a market call. It’s risk management at a point where the asymmetry no longer favors holders. The reward for staying long the last 10% of a parabolic semiconductor move is small. Round-tripping the previous 50% is permanent damage to capital. When leadership gets this narrow and this stretched, the rally and the risk are the same trade.
Position accordingly, and stay nimble through next week’s catalyst window.
🖊️ From Lance’s Desk
This week’s #MacroView blog discusses recent concerns about rising interest rates and why much of the fear is misplaced.

Also Posted This Week:
- AI Productivity And Innovation: Prosperity Or Engels Pause? – RIA – by Michael Lebowitz
- Corrections vs. Bear Markets: Why 20% Declines Are Obsolete – RIA – by Lance Roberts
📹 Watch & Listen
A review of what is driving the S&P 500 index and why the Technology sector may be the most “at-risk” trade.
Subscribe To Our YouTube Channel To Get Notified Of All Our Videos
📊 Market Statistics & Analysis
Weekly technical overview across key sectors, risk indicators, and market internals

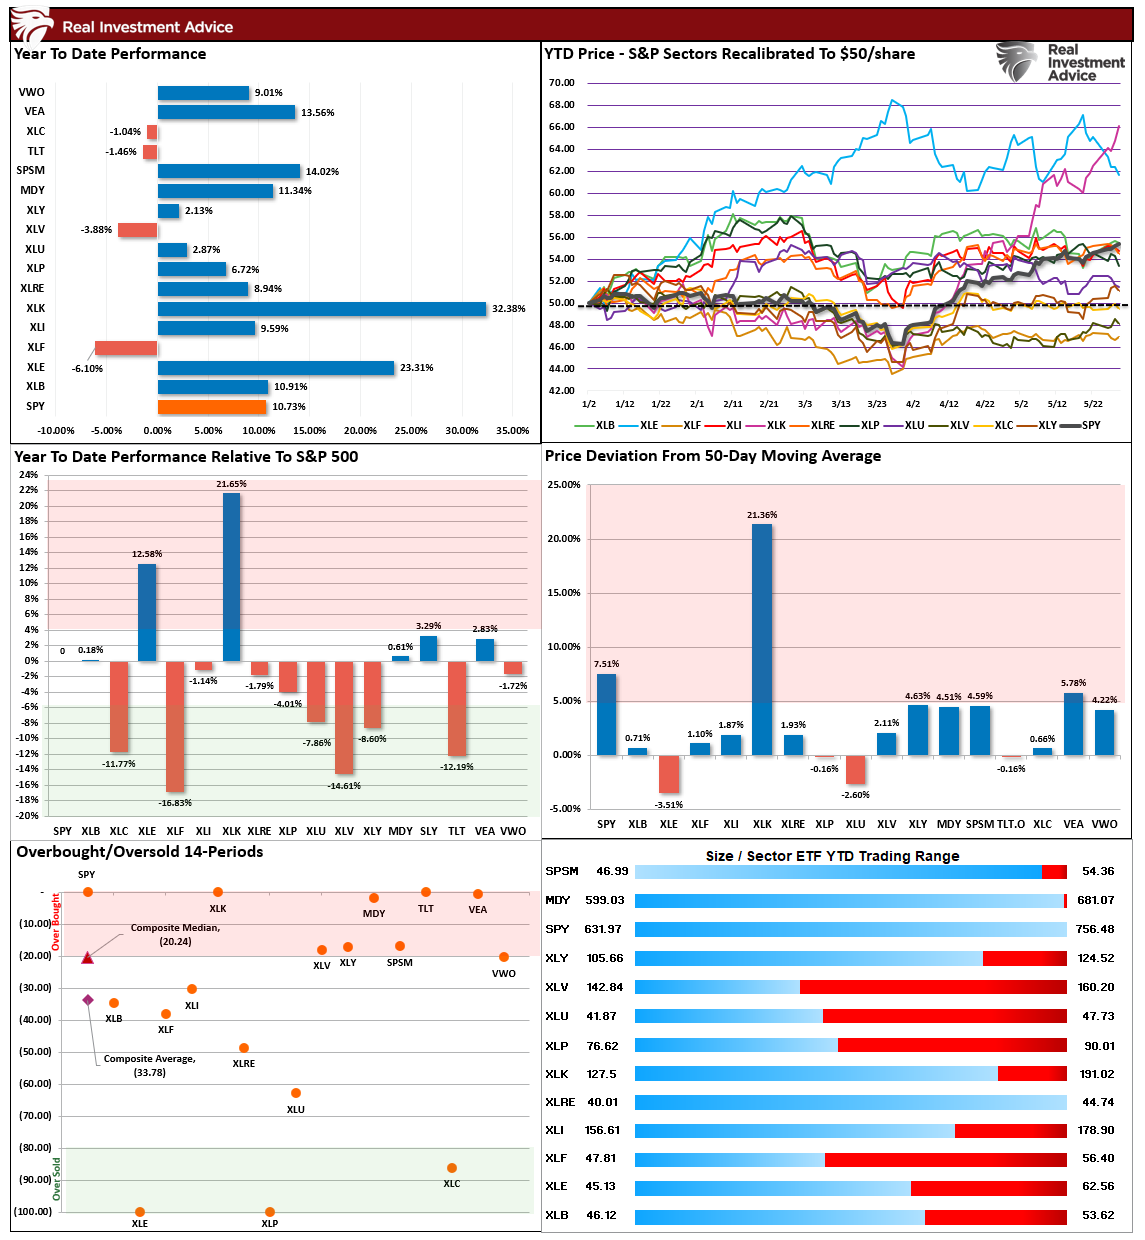
💸 Market & Sector X-Ray: Market Cracks Support
As we previously, the market remains very bifurcated, which historically suggests we could see a rather rapid internal market rotation (risk on to risk off). However, for now, the rather narrow technology trade continues to dominate, with that sector now surpassing Energy after its dramatic early-year surge. Notably, including Energy, the rest of the market has been mostly flat since early March.
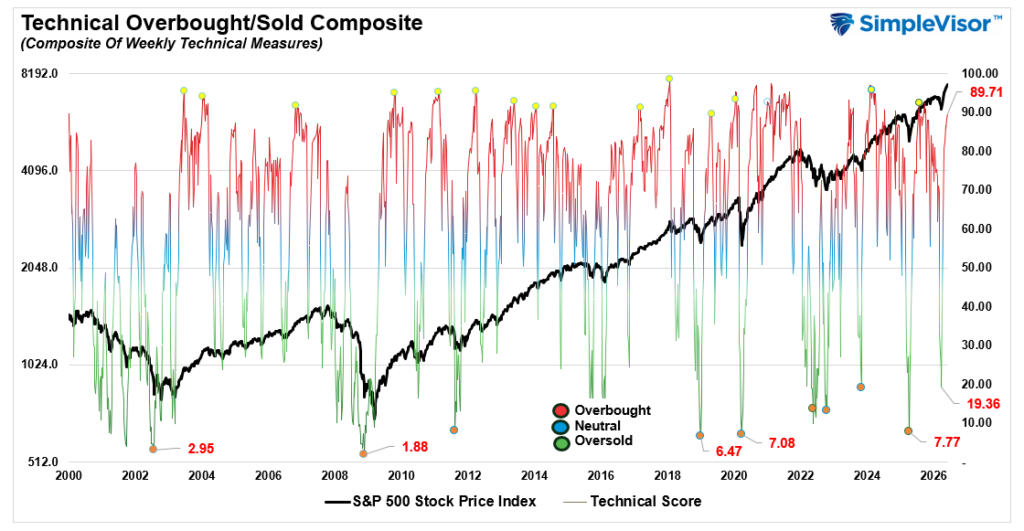
📐 Technical Composite: 89.71 – Market At Extreme Overbought
The market continued its near vertical advance and completed its 9th consecutive week of advances from the April “panic lows” following the onset of the Iran crisis. The bull market is very much alive and well, with momentum chasing in full swing. However, the markets remain extended which continues to suggest monitoring risk exposures.
🤑 Fear/Greed Index: 83.66 – Greed Ticks Up With The Market
Investor sentiment and positioning were rather sharp this past week after a brief decline, as investors chased stocks higher amid hopes of a resolution to the Iran crisis. Markets remain bullish, but while increasing, is not at levels that we normally see near more meaningful market tops.

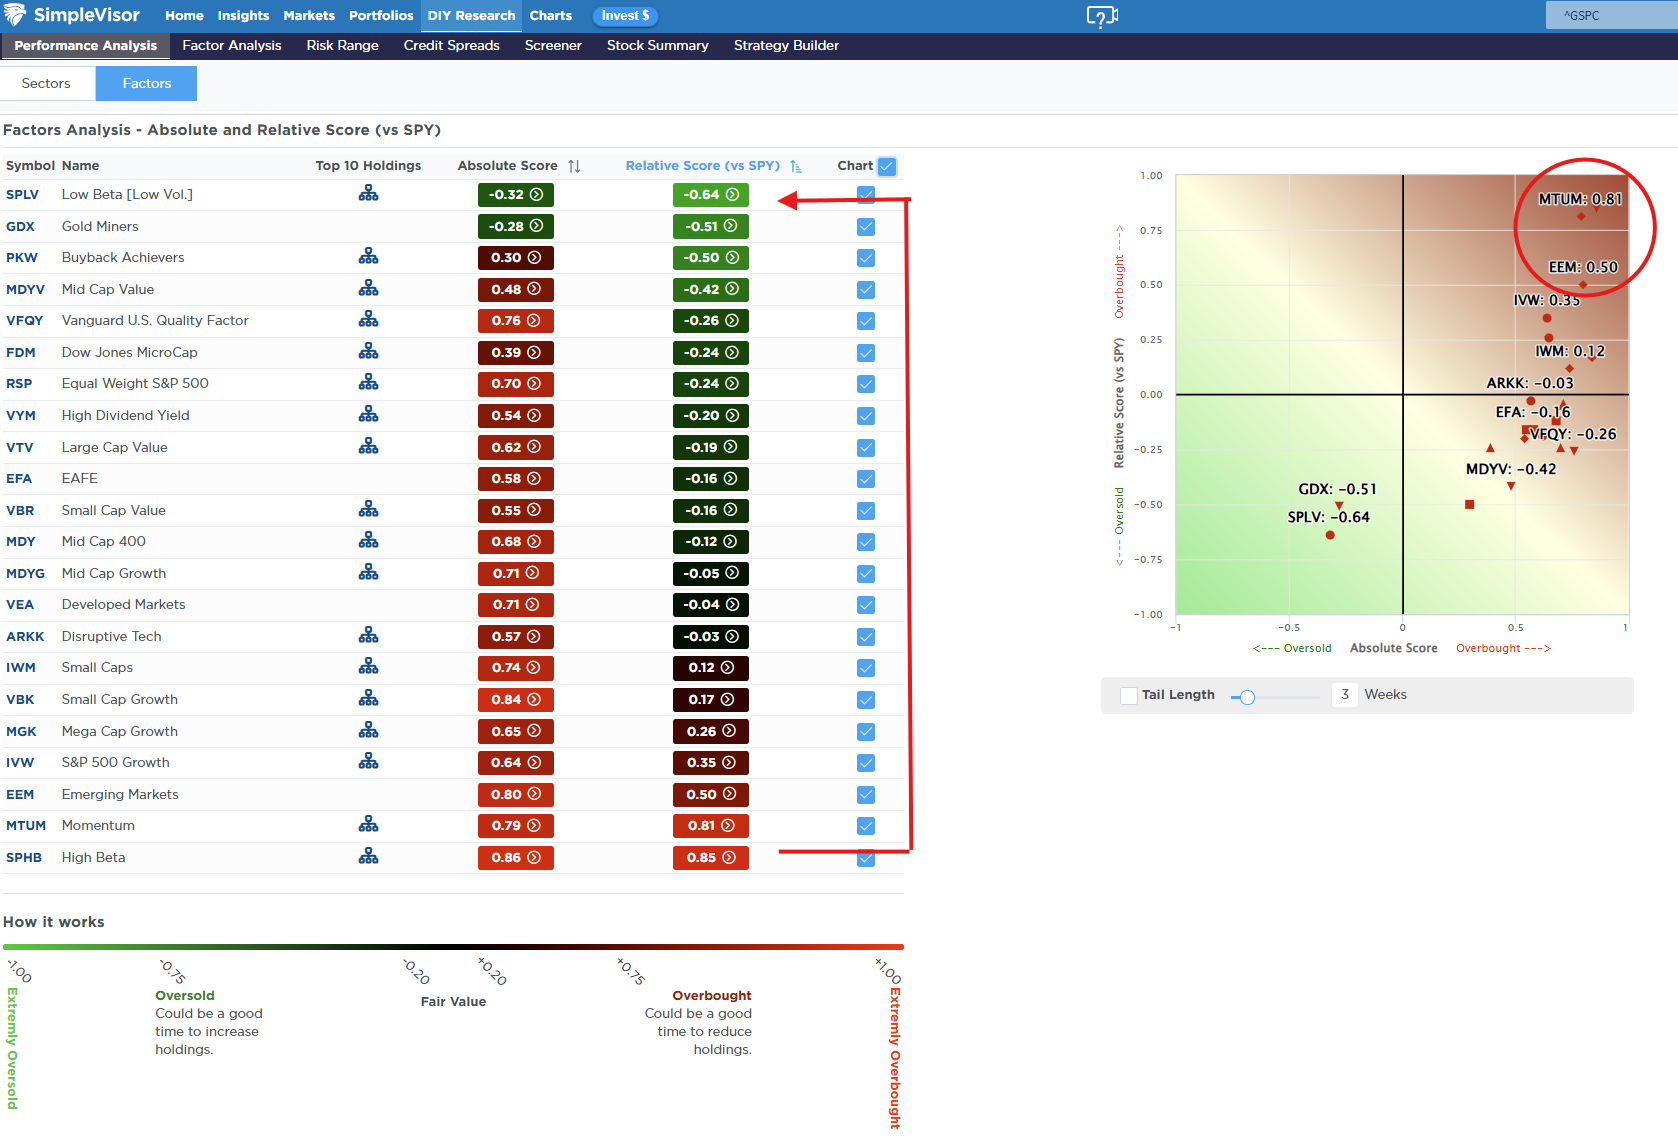
🔁 Relative Factor Performance
Since last week, Momentum accelerated along with S&P High Beta stocks to more extreme overbought conditions as money continues to chase just a handful of names. It remains the most overbought factor while the most oversold factors are Gold Miners, which we warned in January were due for a more significant “risk off” rotation which has now occurred, along with Low Beta (defensive) names. In fact, most of the early-year “reflation trade factors are now the largest laggards of the market.
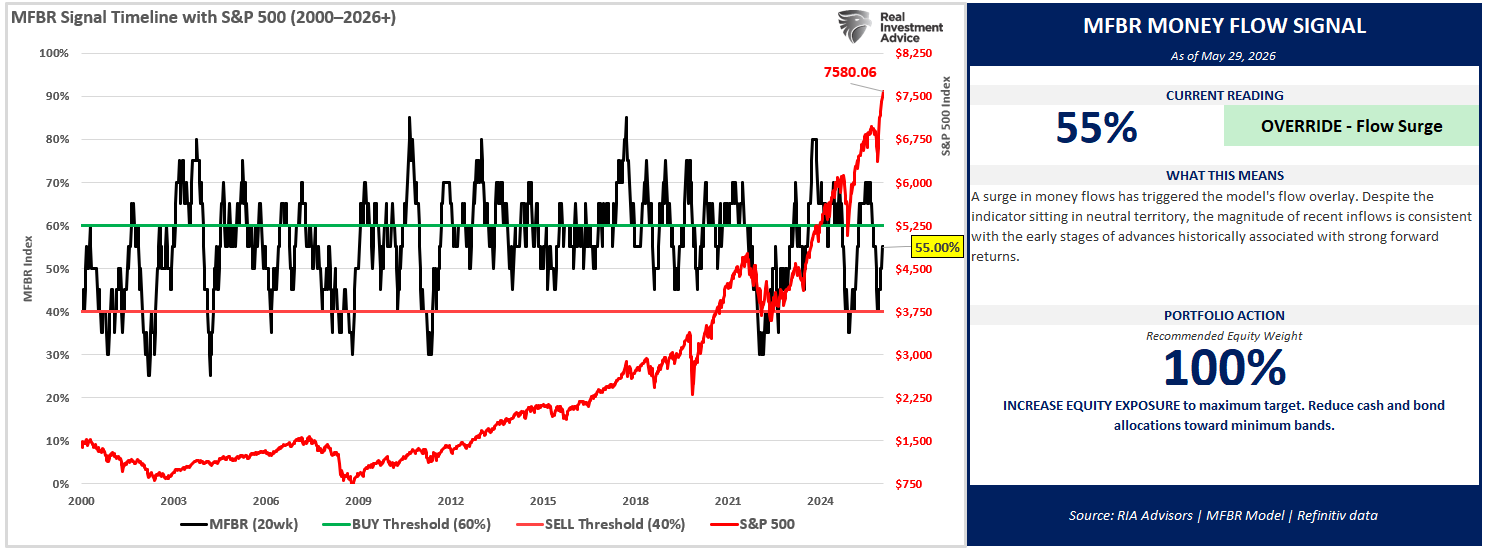
📊 MFBR Index (Money Flow/Breadth Ratio Indicator): 55% = Bullish
NEW! MFBR Index: The Money Flow Breadth Ratio (MFBR) model is a rules-based equity allocation framework that uses weekly S&P 500 money flow data to generate buy, sell, and neutral signals. The MFBR systematically adjusts portfolio equity exposure in response to the direction and persistence of institutional capital flows. It aims to reduce drawdowns while capturing the majority of market upside.
“As of May 29, 2026, with the S&P 500 at 7,580.06, the Money Flow Breadth Ratio (MFBR) stands at 55% and rising. This places the indicator in the 50-60% range, triggering a OVERRIDE – Flow Surge signal. The prior week reading was 55%, representing a 5% decline over the trailing four weeks. The model currently recommends HOLDING exposure at 100%, a level that has remained since April 17, 2026 (6 weeks). This reflects a FLOW-OVERLAY OVERRIDE: the trailing 4-week net dollar flow has swung sharply positive (>$300B) after a deeply negative prior 4 weeks, a historically strong contrarian buy signal.
📊 Sector Model & Risk Ranges
Overall, the broad market is very overbought and trading well above its normal monthly range, along with Technology, which has been responsible for the majority of the market’s recent advance. Technology is increasingly deviating from its short- and long-term means, and a reversal is becoming much more likely. Along with Technology, Energy, Transportation, Small Caps and Emerging Markets are also very deviated from the means, and the risk of a rotation remains elevated. Take profits and rebalance risk accordingly.

Have a great week.
Lance Roberts, CIO, RIA Advisors

