
🔎 At a Glance
- Short Covering Rally Or Is The Bull Market Back
- Market Brief & Technical Review
- From Lance’s Desk: BLS Jobs Report Is Broken. Is There A Better Measure? – RIA
- Market stats, screens, and risk indicators
🏛️ Market Brief – Stocks Surge On Opening Of Strait
The market didn’t just recover this week. It made new history.
Monday opened with the S&P 500 erasing all losses since the Iran war began. The market rose 1% to its highest close since late February. Driving that rally were reports that Iran had reached out to the Trump administration despite a U.S. naval blockade of the Strait of Hormuz. The buying accelerated from there. By Wednesday, both the S&P 500 and the Nasdaq Composite closed at fresh all-time highs. With investors pricing in an increasingly credible path to a permanent peace deal, the bulls regained control.
The week’s dominant technical story was institutional mechanics, not just sentiment. Commodity trading advisors, systematic trend-followers that had aggressively shorted into the March 29 lows, reversed violently. Those managers purchased an estimated $86 billion in equities last week alone. According to positioning data, CTAs have an additional $70 billion of programmatic buying to deploy over the next five sessions. That is not discretionary optimism. It is forced covering and momentum-chasing at scale. It also provides a meaningful mechanical tailwind into next week, even if geopolitics stalls.

Earnings added fundamental credibility to the move. JPMorgan Chase beat on every line, $5.94 EPS vs. the $5.45 estimate, on revenue of $50.54 billion. However, CEO Jamie Dimon tempered the celebration by cutting net interest income guidance and warning of an “increasingly complex set of risks.” Citigroup and BlackRock also topped estimates, but Goldman Sachs disappointed on FICC revenue despite record equities trading. That sent Goldman’s stock down nearly 2%, while Wells Fargo fell more than 5% on a weak print. Outside of banking, Netflix beat on revenue and earnings. That wasn’t good enough, as guidance fell short of expectations. So far, 80% of S&P 500 reporters have topped EPS estimates by an average of 15.7%. That is a strong beat rate, and consistent with FactSet’s call for a sixth consecutive quarter of double-digit earnings growth.
Friday’s session provided the week’s most consequential development. Axios reported that the U.S. and Iran are negotiating a three-page memorandum of understanding. That framework would release $20 billion in frozen Iranian funds. In exchange, Tehran surrenders its enriched uranium stockpile and agrees to a moratorium on nuclear enrichment. Hours later, Iran’s foreign minister posted on X that the Strait of Hormuz was open. That news sent WTI crude plunging by more than 11%.
Most crucially, the inflation math is changing in real time. A durable Hormuz reopening removes the primary driver of stagflation risk that has pressured markets since late February. If the MOU holds and tanker traffic normalizes, the March CPI will be the last truly ugly energy-driven print. If oil prices decline to more productive ranges, the Fed’s path back to rate cuts reopens. With earnings tracking ahead of estimates, CTAs still buying, and geopolitical risk fading, the bull case is more constructive than it has been in months. The key risk remains deal fragility; a single violation or rhetorical escalation could unwind fast what took weeks to build.
In other words, it is not the time to remove risk management entirely.
📈Technical Backdrop – Pullback Likely
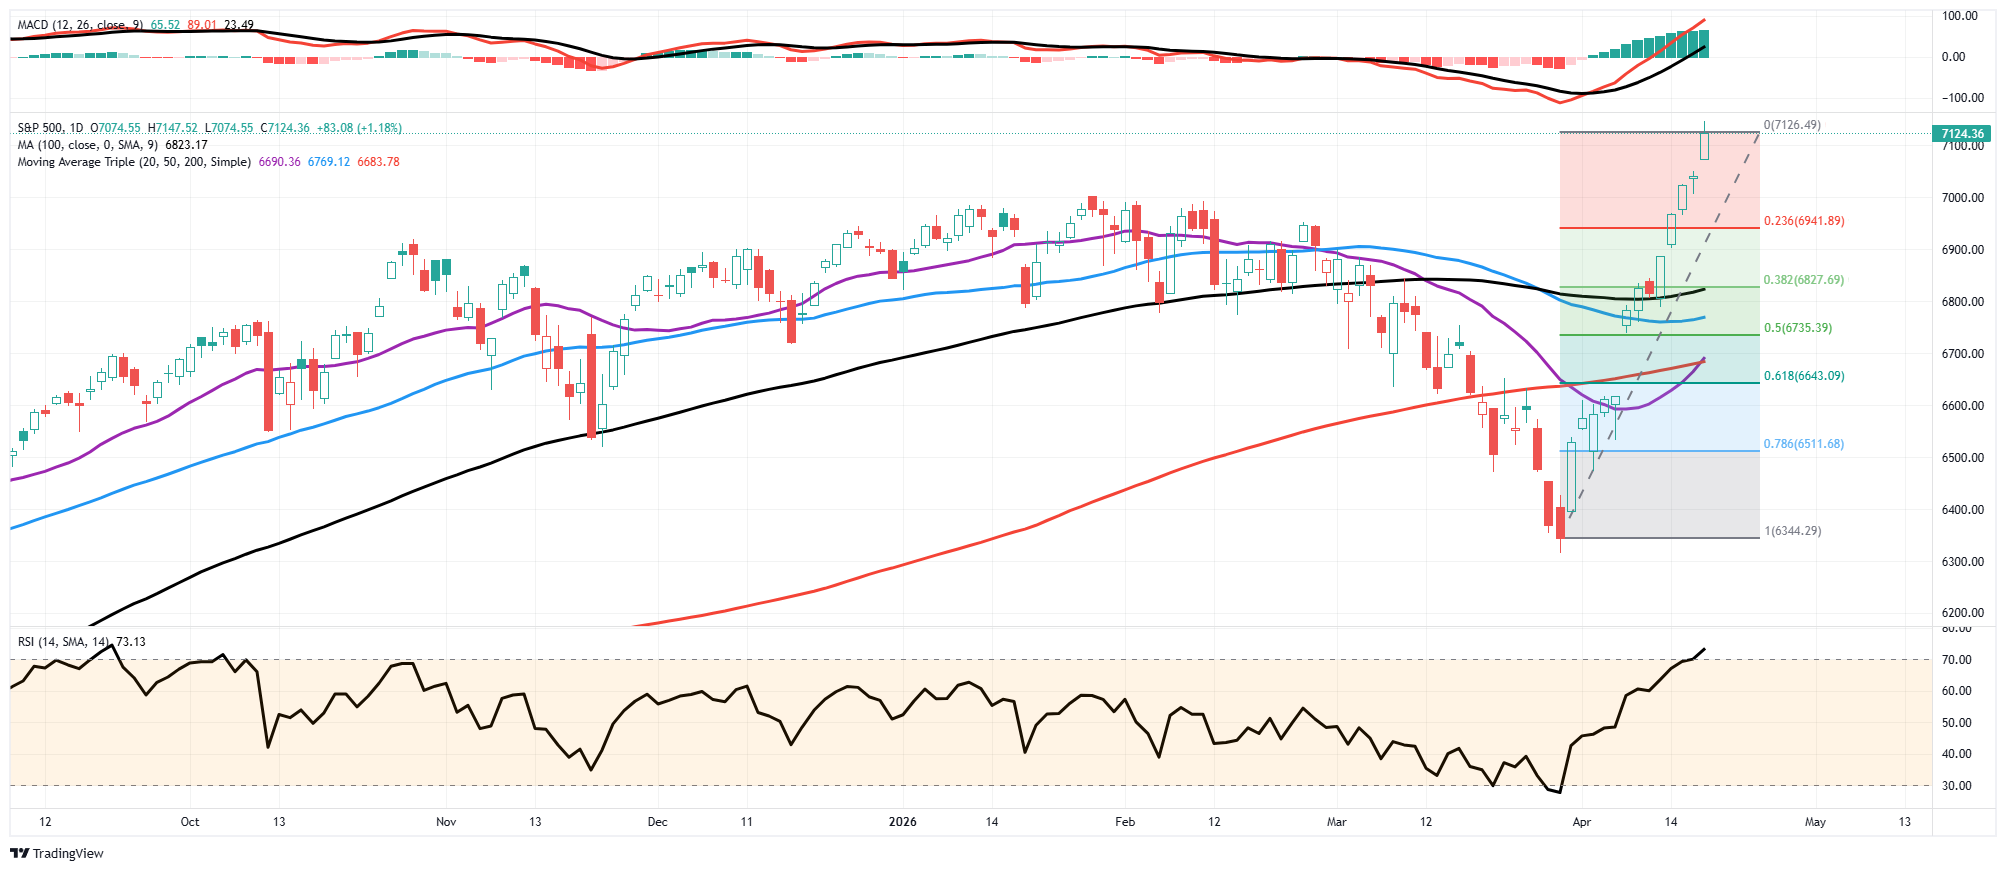
The S&P 500 closed Friday at a new all-time high of 7,125. That is 13.1% rally from the March low in under three weeks. This is one of the sharpest V-shaped recoveries in the post-GFC era. The Nasdaq posted its 13th consecutive gain (its longest winning streak since 2009). Inside the market, internals were strong. The VIX collapsed from 31 to 17. Oil pulled back below $90 before closing at $94, with ships beginning to transit the Strait of Hormuz. This is exactly the durable-bottom signal we identified weeks ago. A rapid recovery above the 200-day moving average, improving breadth, and oil declining with the VIX below 20.
However, is this just a short-covering rally or the resumption of the bullish trend? The answer is that this is most likely the resumption of the bullish trend.
Two weeks ago, just 27.6% of S&P 500 constituents traded above their 50-DMA (12th percentile). That number has surged to roughly 71%, well above the 50% confirmation threshold. That was the dividing line between a reflexive bounce and a genuine trend reversal. The Russell 2000’s move to all-time highs is the single most bullish breadth signal. Small caps confirm this is not merely a Mag 7 short-squeeze. Lastly, JPMorgan’s flow data shows retail participation rising from the 10th to the 55th percentile. When breadth and flows confirm the move, the rally has a structural foundation that pure short-covering does not.
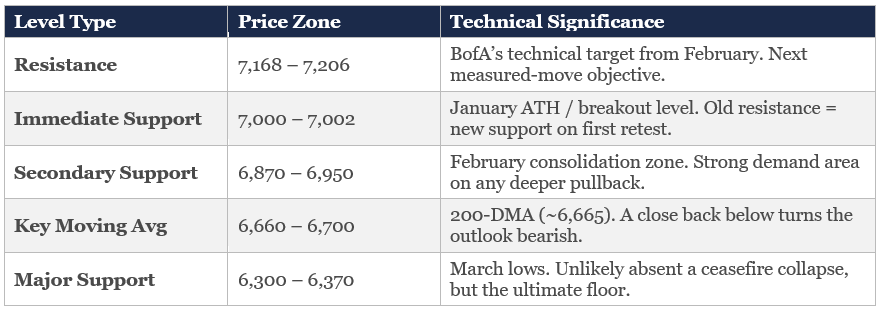
None of this means you should chase here. After a 13% move in three weeks, the market is stretched on every short-term measure. The RSI is pushing overbought above 70. Furthermore, the price is extended 7% above the 200-DMA, and the Nasdaq’s 13-day streak has historically preceded 2–5% pullbacks within two weeks. Retail’s return is a yellow flag of sentiment as the “easy money” phase is behind us. Any pullback to the 7,000 level will become the first support under the classic “old resistance becomes new support” principle. Below that, the 6,870–6,950 zone (February’s consolidation range) should attract strong buying. The 200-DMA (~6,683) remains the line in the sand. A healthy 2–3% pullback to the 7,000–6,950 zone is the spot to add exposure. Not up here at fresh highs.
This rally is the real thing, but treat it with caution. Reversals can be swift, particularly if the narrative supporting the rally fails. For now, stay long, stay patient, and let the market come to you.
Trade accordingly.
🔑 Key Catalysts Next Week
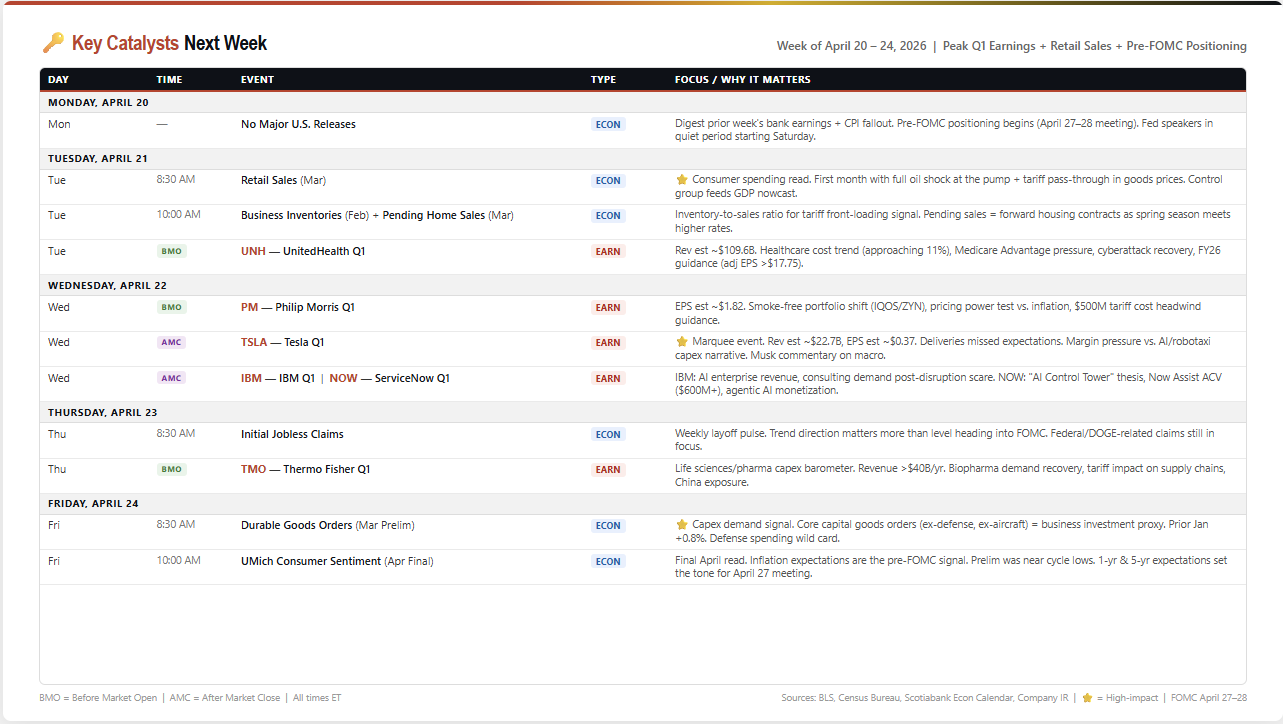
The calendar pivots from bank earnings to the consumer and Big Tech, with March Retail Sales, Tesla, and the final pre-FOMC sentiment read all compressed into five sessions. The April 27–28 FOMC meeting looms, with the Fed in its quiet period. That means every data point this week will be interpreted through the lens of what it means for rate policy under new Chair Kevin Warsh (assuming confirmation by then) or lame-duck Powell.
Tuesday’s March Retail Sales is the week’s economic anchor and the first consumer spending report to fully capture the oil price spike at the pump and the tariff pass-through into goods prices. February’s report was already soft. If the control group, which feeds directly into the GDP nowcast, contracts, the slowdown narrative hardens further heading into the FOMC. Pending Home Sales will also tell us whether buyers are pulling back as mortgage rates reverse higher. UnitedHealth reports that morning as well, and with the healthcare cost trend approaching 11% and Medicare Advantage pressure weighing on the managed care sector, a read on both healthcare inflation and corporate margins will be important.
Wednesday is the marquee earnings day. Tesla after the close is the event: Q1 deliveries already missed expectations, margins are under pressure, and the street is trying to price a company that’s spending aggressively on AI and robotaxi infrastructure while the core auto business decelerates. Musk’s macro commentary will move futures. IBM (IBM) reports the same evening that the AI enterprise revenue trajectory is critical following February’s 13% single-day plunge amid fears of disruption from Anthropic. ServiceNow (NOW) is also the SaaS bellwether, with its “Now Assist” agentic AI product now past $600 million in ACV. Philip Morris (PM) that morning tests consumer pricing power with $500 million in guided tariff headwinds.
Friday closes with a one-two punch: Durable Goods Orders for the capex demand signal, and the final UMich Consumer Sentiment reading for April. The inflation expectations embedded in UMich are the last data point the Fed will see before convening. A spike in five-year expectations above 3% would all but guarantee a hawkish hold, while a decline would crack the door for dovish language.
In a nutshell, Retail Sales will tell us if the consumer is breaking. Tesla will tell us whether the growth premium is justified, and UMich will signal the Fed’s next move. All with the FOMC one week away. Position defensively into Wednesday’s close.
Need Help With Your Investing Strategy?
Are you looking for comprehensive financial, insurance, and estate planning services? Need a risk-managed portfolio management strategy to grow and protect your savings? Whatever your needs are, we are here to help.

💰 Short Covering Rally?
▶ WEEK CLOSE: S&P 500 7,126.06 (+1.2%) | Nasdaq 13-Day Win Streak (longest since 1992) | Russell 2000 New ATH | Brent Crude -9.1% | VIX 17.42
What began as a short-covering rally on April 7th has spent the last two weeks proving the bears wrong. Friday’s close at 7,126, the first finish above 7,100 in the index’s history, up 13.1% from the March lows, arrived alongside one of the most consequential single-session catalysts of the year. Iran declared the Strait of Hormuz “completely open.” Brent crude collapsed 9.1%. The Russell 2000 logged a new all-time high. The short-covering rally that skeptics said would exhaust itself in days has now run for three weeks and taken every major index to record territory.
The question every investor is asking right now isn’t whether to believe in the rally. The price action is undeniable, but the question is what kind of rally this actually is, and what investors who missed the initial short-covering rally should do about it.
The answer, as of Friday’s close, has shifted meaningfully. This no longer looks like a purely mechanical short-covering rally. The data is starting to point to something more durable. Here’s why that distinction matters, and what it means for your portfolio.
As we discussed in the #DailyMarketCommentary this past week, the recent price action felt like a release valve being pulled. Goldman’s prime brokerage flows guru, Lee Coppersmith, described a clear pivot toward risk-on, noting that sentiment has shifted toward FOMO among investors who dumped positions amid peak AI disruption fears and rising Middle East tensions.

That pivot makes sense from a mechanics standpoint. Short exposure across U.S. macro products, index futures, and ETFs had climbed to the 93rd percentile over the past five years, with hedge fund gross exposure near an all-time high of 307%. When the Iran ceasefire headlines crossed, that positioning became a coiled spring. Shorts covered, hedges unwound, and global equities were net bought for the first time in eight weeks, with Goldman’s Equity Fundamental Long/Short Performance Estimate rising 4.01%, the best weekly reading since February 2021.

That’s the good news, and we’ve seen this movie before. The build-up of stress in the market gets investors overly bearish, and then “hope” arrives, relieving the pressure. The “hope” causes a rush to gain positioning, short positions unwind sharply, and the headline indices surge.
The trap, however, is confusing the “market squeeze” with a new bull leg higher. Understanding which dynamic is actually driving this market right now is the most important analytical question any investor can ask.
A Review
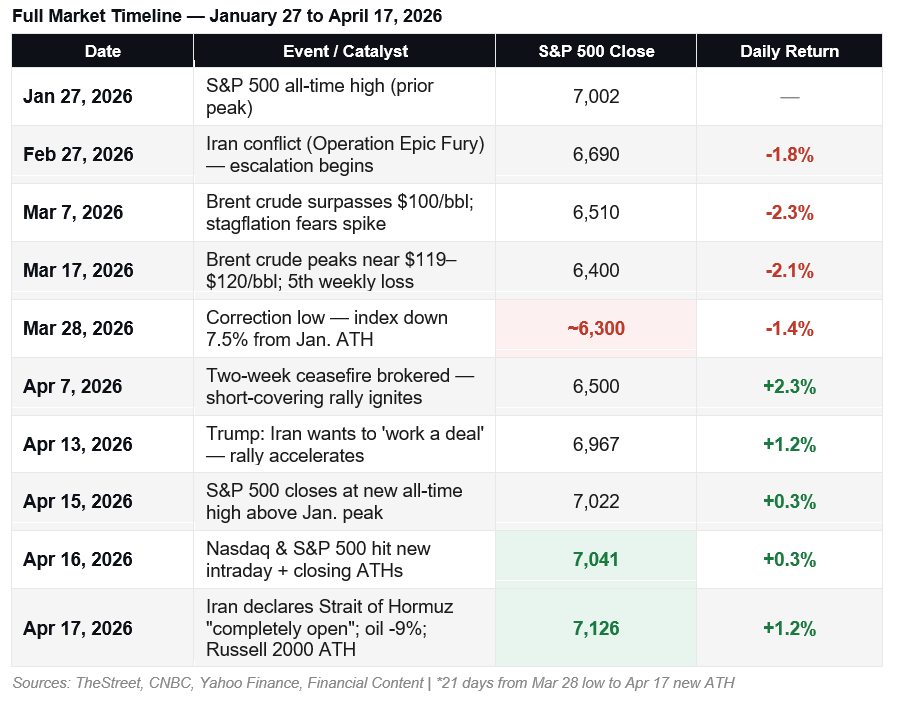
The S&P 500 peaked at 7,002 on January 27th and spent the next eight weeks coming apart at the seams. The trigger wasn’t an earnings collapse or a credit event. It was a geopolitical shock that repriced three variables simultaneously: oil, inflation expectations, and the Federal Reserve’s flexibility.
When U.S. forces launched Operation Epic Fury in late February, Brent crude surged from roughly $72 per barrel toward a peak of $119–$120 by mid-March. The stagflation trade that the market had been dismissing suddenly had a fundamental basis. JPMorgan cut its year-end price target. Recession probability estimates at the major banks rose from 25% toward 50%. Five consecutive weekly losses followed, with the index falling 7.5% from the January peak to lows near 6,300 by late March. Short interest built to multi-year highs as institutional investors layered on hedges through ETFs. The market was coiled.
What followed was initially a textbook short-covering rally. The ceasefire on April 7th lit the fuse. Trump’s April 13th comment that Iran wants to ‘work a deal’ accelerated it. And Friday’s Strait of Hormuz announcement — combined with oil’s single biggest drop of 2026 — may have completed the transition from short-covering rally to genuine bull market resumption.
The initial move off the lows was textbook, short-covering rally mechanics. Short interest at multi-year highs, extreme bearish sentiment, and oversold technicals created the conditions. All that was needed was a catalyst, and Trump’s April 13th comment that Iran wants to “work a deal” provided exactly that. Now, we have all three pillars in place to determine, potentially, what happens next.
- Pillar One: The short-covering rally ignites. According to AInvest analysis, total S&P 500 component short interest was at elevated levels as the index traded near its lows, creating a concentrated pool of traders who must eventually buy back shares. When the ceasefire news broke on April 7th, the buying cascade began. What followed was a short-covering rally that sent the Nasdaq to its best multi-session run on record. The velocity was characteristic of forced covering rather than fresh conviction buying, which is precisely why the bears initially dismissed it.
- Pillar Two: Geopolitical de-escalation extends the move. A pure short-covering rally typically exhausts itself within a few sessions once the most exposed shorts are covered. What extended this one was sustained improvement in the Iran narrative. Ships began clearing the Strait of Hormuz blockade. The Islamabad negotiations shifted tone from bellicose to cautiously optimistic. Vice President Vance noted the “diplomatic off-ramp is wider than it was a month ago.” That war premium embedded in equity valuations began to dissolve, giving the short-covering rally a fundamental tailwind.
- Pillar Three: Earnings season anchors the move. Goldman Sachs posted EPS of $17.55 against expectations of $16.47. Morgan Stanley beat with $3.43 versus a forecast of $3.02. JPMorgan cleared the bar on nearly every metric. The financials sector handed the market a fundamental anchor at exactly the moment it needed one. As TheStreet contributor James ‘Rev Shark’ DePorre observed: “Investors are betting on the long-term strength of the U.S. economy, with AI as the primary driver. The Iran situation is being treated as a temporary distraction.”
So, who is likely right: the bulls or the bears?
Short-Covering Rally or Something More?
Every investor right now is trying to answer that question.
If there is a single dataset that most clearly distinguishes a short-covering rally from a genuine bull-market resumption, it’s sector rotation. Short-covering rallies tend to be narrow; they lift the most-shorted names while leaving cyclical and economically sensitive sectors behind. Genuine recoveries broaden. The sector data from the wartime selloff (February 27 to March 30) compared to the recovery (April 7 to April 17) tells a very clear story.

Breadth has also improved sharply, but there is certainly more room to broaden.

However, that rotation is exactly what you want to see following a geopolitical shock. Energy, the wartime beneficiary, has given back its gains. Technology has led the recovery. Consumer discretionary has followed, with Friday’s cruise sector surge (Royal Caribbean, Norwegian, Carnival all up 9%+) signaling consumers are betting on normalcy. Industrials and financials have contributed. And the Russell 2000 has outperformed the S&P 500 by a margin that argues for something well beyond a short-covering rally. That’s five of eleven sectors posting meaningful gains with genuine fundamental drivers behind each.
Another important factor right now is earnings. As we noted earlier this week, Goldman Sachs is maintaining its year-end S&P 500 target of 7,600. That target is premised on $309 per share in 2026 earnings and 12% growth, which they describe as “a fundamental floor.” In their view, this is more supportive of a bull market.
“The bull market is maturing, not ending. With 12% earnings growth acting as a safety net, the transition offers a more sustainable path.“
On the other hand, we must also consider the bears’ argument. The argument that this is “just a short-covering rally” with no staying power may be true, but it gets harder to sustain when you study the historical record for geopolitical shocks of comparable magnitude. Across more than 20 major events since World War II, the pattern is consistent: markets recover faster than most investors expect, and the investors who stay disciplined through the short-covering rally phase and into the recovery tend to come out ahead.
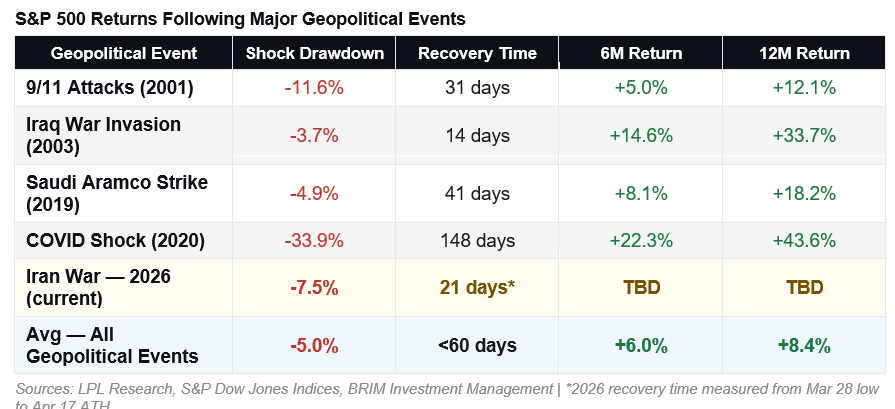
The current episode has already outpaced the average recovery time of under 60 days, completing its round-trip to new highs in just 21 days. The speed is notable, comparable to the post-Iraq War recovery of 2003, which went on to produce a 33.7% 12-month return. The COVID comparison (148 days to recover, then +43.6% over six months) is also instructive. What initially looked like a mechanical short-covering rally in April 2020 turned out to be the opening act of one of the most powerful bull markets of the modern era. The key distinction in all these cases is what’s happening beneath the surface, and in 2026, that’s increasingly constructive.

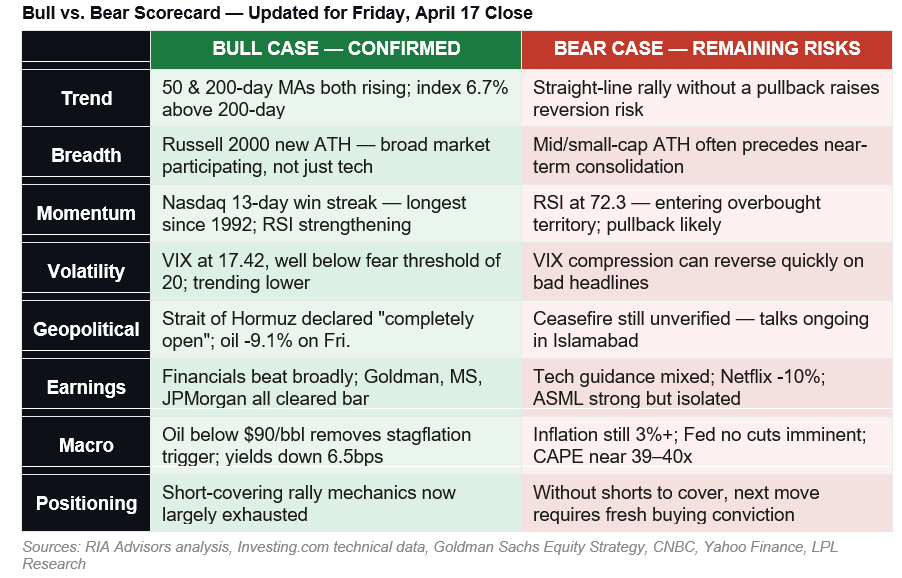
The weight of evidence has shifted. At the start of this week, our scorecard was roughly balanced — three confirmed bull signals against three legitimate bear concerns. As of Friday’s close, the bull case has added three material confirmations: Russell 2000 at a new ATH (breadth), oil’s single-session collapse (geopolitical resolution), and sector rotation into cyclicals (genuine buying, not short-covering alone). The bear case retains one critical point: RSI at 72.3 argues for near-term patience on new entries, not a reversal of the trend.
The verdict: This is no longer a short-covering rally. It was one when it started. It isn’t one anymore. The transition from a mechanical short-covering rally to a fundamental bull market resumption typically happens when:
- The shorts have been largely covered,
- Breadth expands,
- Sector rotation confirms the recovery is economic rather than positioning-driven, and
- A fundamental catalyst removes the original trigger for the selloff.
As of Friday, all four conditions have been met.
What To Do If You Missed The Rally
This is the most emotionally loaded question in the room. If you have been listening to the “Perpetual Purveyors Of Doom,” you watched a short-covering rally turn into an 11% surge and a new all-time high, and now you’re wondering whether to chase it. The instinct is understandable. The discipline required to resist the “negative commentary” is what separates good investors from the rest.
Here’s what history consistently shows: most breakouts that begin as a short-covering rally, and then sustain above key moving averages, offer a secondary entry point within 4 to 6 weeks of the initial move. Markets rarely transition from correction lows to sustained new highs in a straight line. The more common path involves:
- An initial surge (the short-covering rally phase),
- A consolidation or shallow retest of former resistance, and
- Then a continuation move. That retest is your entry.
Therefore, as shown below, depending on how you are currently invested, you can take actions to navigate whatever comes next.
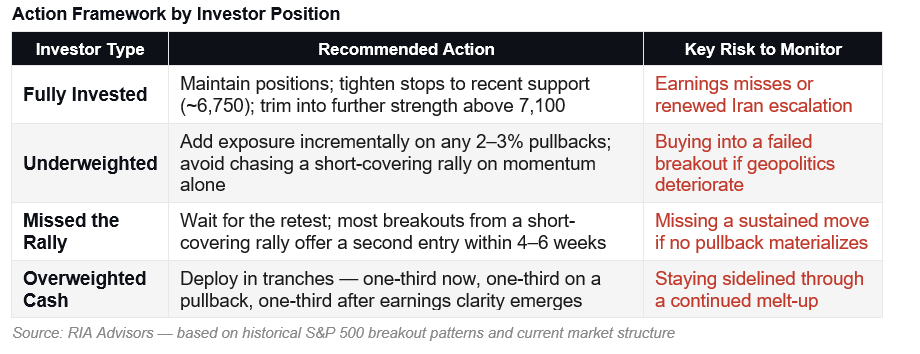
The macro backdrop hasn’t been cleared of all risk, as oil remains above $90 per barrel, inflation is sticky, and the Fed has no near-term rate cuts in the pipeline. The ceasefire is fragile, and the Islamabad negotiations haven’t yet produced a signature. Any deterioration on those fronts is a reason to reduce exposure, not add to it.
What we are watching most closely over the next two to three weeks isn’t the price level, it’s the breadth confirmation. We want to see the percentage of S&P 500 stocks above their 200-day moving average cross back above 60%, then 70%. We want to see volume improve on up-days and dry up on pullbacks. And we want to see earnings season deliver results that justify the multiple, not just the sentiment reset that a short-covering rally provides.
BOTTOM LINE: The S&P 500’s return to all-time highs is technically significant, but significance and sustainability are not the same thing. Yes, a short-covering rally lit the fuse, but the sustained move above the 200-day moving average, the improving VIX, and the early earnings beats suggest something more durable may be taking shape. History is clear that markets recover from geopolitical shocks faster than almost anyone expects. The investors who come out ahead aren’t the ones who chase; they’re the ones who use pullbacks to build positions in quality names, maintain discipline on stops, and resist the urge to mistake speed for safety. The next two to three weeks of earnings will tell us whether this is a new leg higher or the best exit ramp before a retest.
Trade accordingly.
🖊️ From Lance’s Desk
This week’s #MacroView blog examines the BLS employment report, its flaws, and a potential solution to improve its readings.
Also Posted This Week:
- Will Private Credit Cause The Next Financial Crisis? – RIA – by Michael Lebowitz
- S&P 500 Outlook: The 8.2% Rally & What Comes Next. – RIA – by Lance Roberts
📹 Watch & Listen
In this week’s video, we discuss the market as it breaks out to new highs in one of the sharpest rallies this century.
Subscribe To Our YouTube Channel To Get Notified Of All Our Videos
📊 Market Statistics & Analysis
Weekly technical overview across key sectors, risk indicators, and market internals

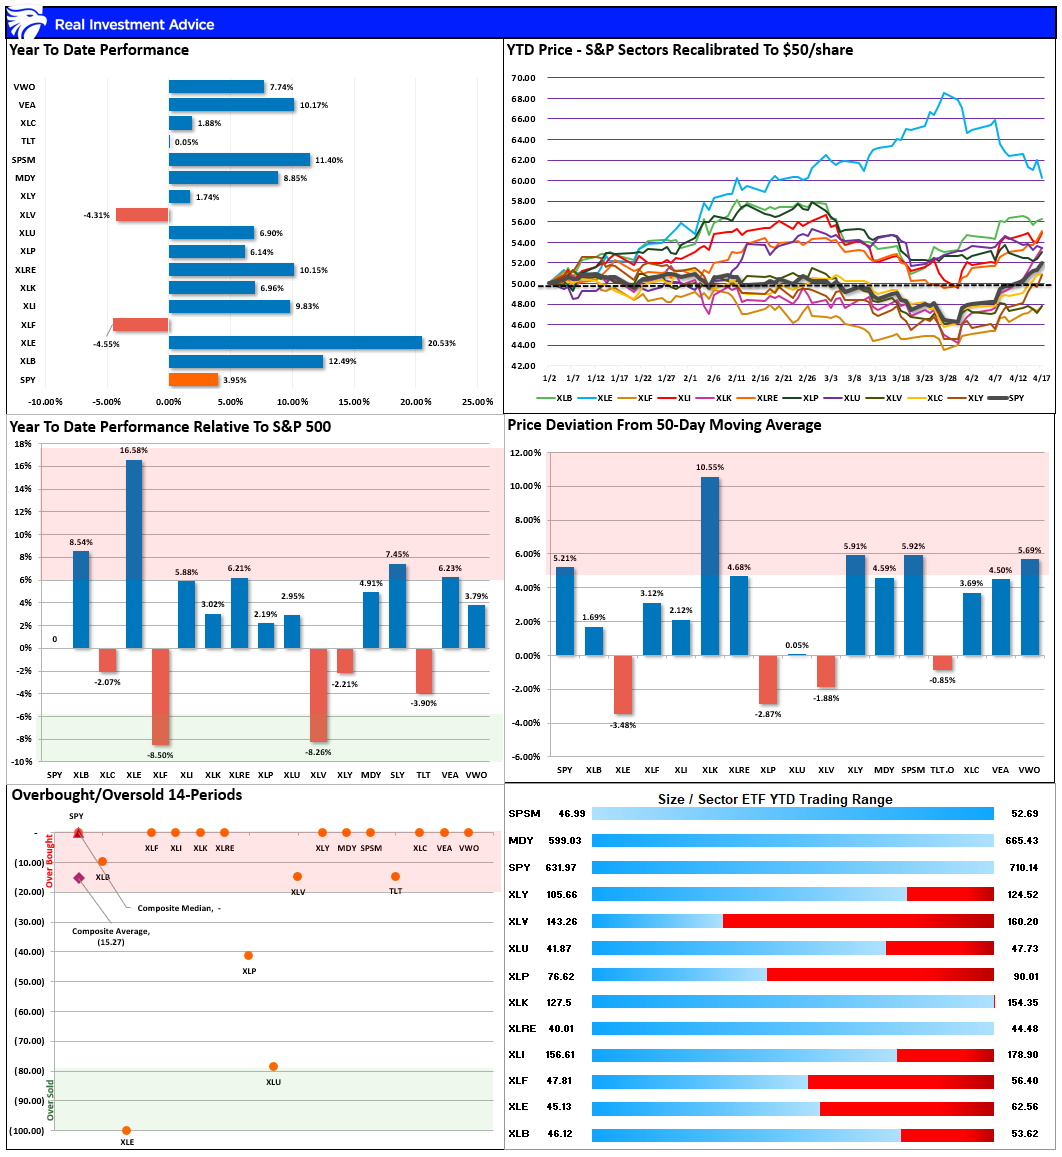
💸 Market & Sector X-Ray: Market Cracks Support
Previously, we noted that: “With every other sector extremely oversold, the logical setup now is for that rotation out of energy into other areas of the market to begin as soon as clarity on Iran emerges.” As shown in the upper-right box, that is what happened over the past two weeks, as the entire premium in the energy sector reversed and technology surged. With the market now rebalanced, we should see a broader advance next week. Markets are getting overbought, so rebalance risk as needed.
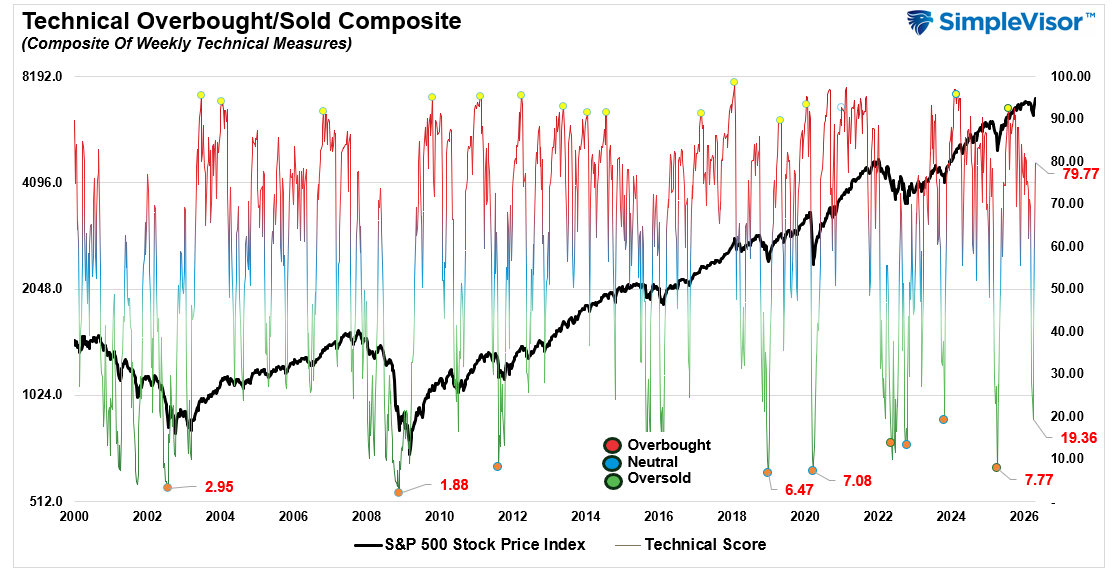
📐 Technical Composite: 79.77 – Market Surge Approaching Overbought
As noted previously, “The odds of a reflexive rally are increasing. We are currently at levels we haven’t seen since 2022.” That reflexive rally came hard, with the market posting its best performance since March 2022. We are approaching overbought levels, so use this rally to rebalance risk and exposures as needed.
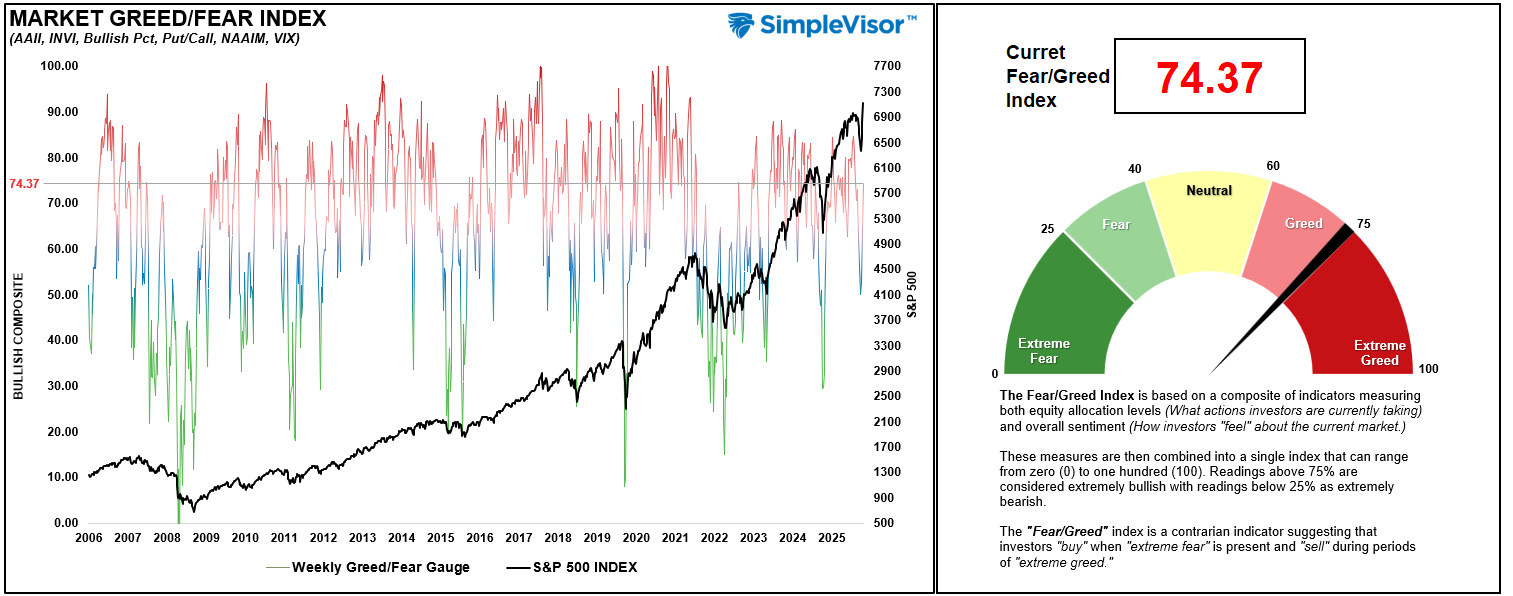
🤑 Fear/Greed Index: 74.37 – Investors Go All In
As we noted two weeks ago, “While not at ‘fear levels’ yet, the selloff has been rather sharp, so a reflexive rally.“ The reflexive rally came with a vengeance over the last two weeks, and investor sentiment and positioning went from “fear” to borderline “extreme greed” in just that time. There is now decent momentum behind the market, but if you didn’t like the recent selloff, this is a good time to rebalance risk and portfolio allocations.
🔁 Relative Sector Performance
In our last update, we stated: “Given the divergence between Energy and the rest of the market, profit-taking in Energy seems prudent.” This past week, energy sold off sharply while Technology staged a massive rally. Currently, Technology and Transportation are very overbought. Take profits and rebalance risk accordingly.

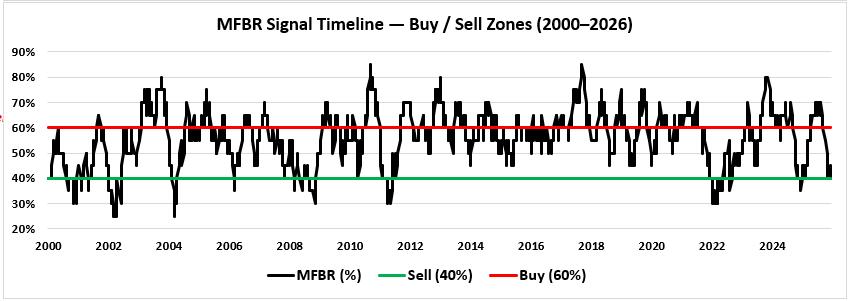
📊 MFBR Index (Money Flow/Breadth Ratio Indicator): 45% = Neutral/Bullish
NEW! MFBR Index: The Money Flow Breadth Ratio (MFBR) model is a rules-based equity allocation framework that uses weekly S&P 500 money flow data to generate buy, sell, and neutral signals. It is designed to systematically adjust portfolio equity exposure in response to the direction and persistence of institutional capital flows, aiming to reduce drawdowns while capturing the majority of market upside.
“As of April 17, 2026, with the S&P 500 at 7,126.06, the Money Flow Breadth Ratio (MFBR) stands at 45% and rising. This places the indicator in neutral territory (40-50%), triggering a NEUTRAL signal. The prior week’s reading was 40%, representing a 5% decline over the trailing four weeks. The increase in the MFBR suggests both money flows and breadth are improving, maintain current equity exposures, and rebalance risks as needed.”
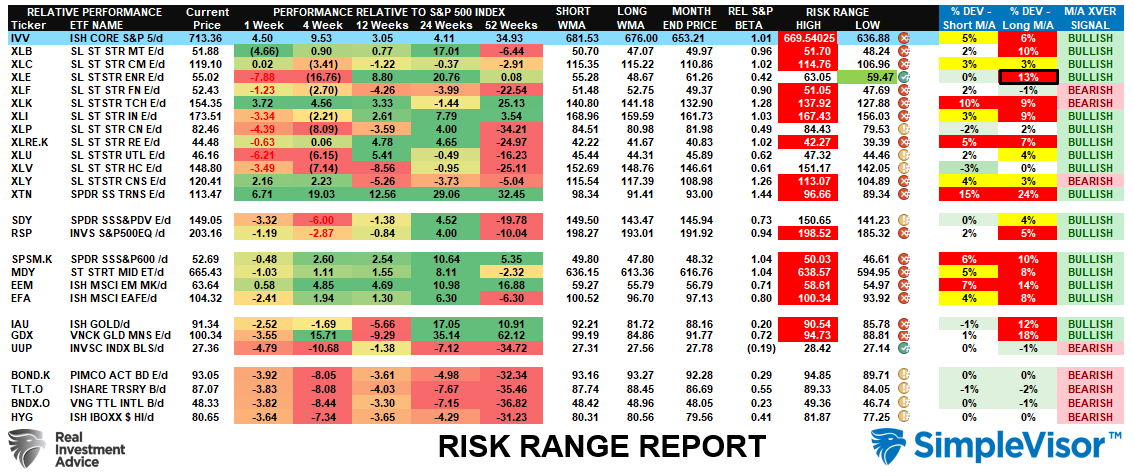
📊 Sector Model & Risk Ranges
What a difference two weeks can make. The sectors that were most aggressively extended, as we warned, reversed. The sectors that were most beaten up were aggressively bid. This is why we regularly recommend rebalancing when sector performance becomes too bifurcated. The good news is that the market has recovered and the bulls are back in control. The bad news is that there are an increasing number of bearish crossovers, which typically signal rougher times ahead. With most sectors and markets well outside their respective ranges, take profits and rebalance risk, a pullback is increasingly likely over the next two weeks.
Have a great week.
Lance Roberts, CIO, RIA Advisors

