
Art Berman wrote an excellent analysis describing the state of the oil market and two distinct messages being debated. The following commentary is from his article: Hormuz: A Logistics Crisis, Not Yet an Inventory Crisis.
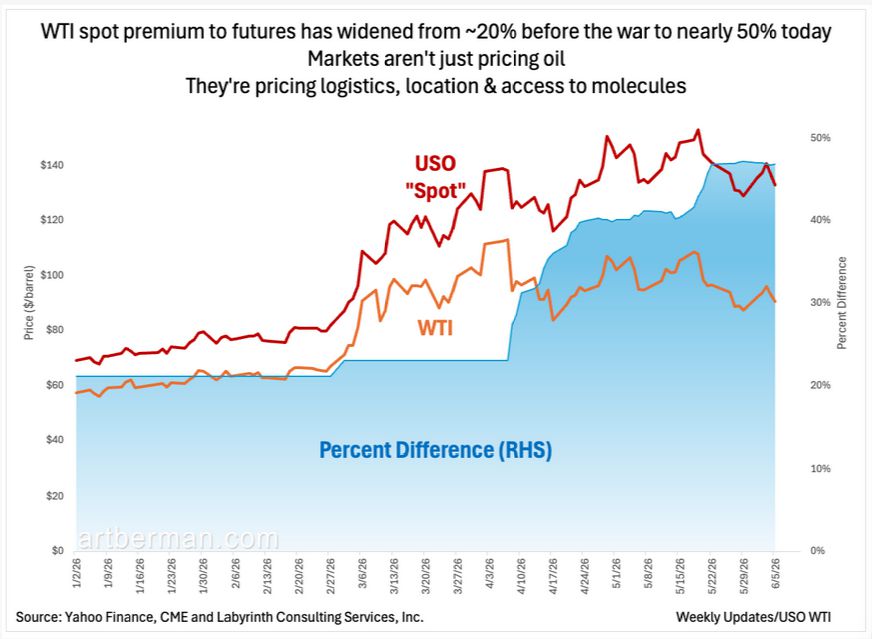
The debate over the oil market and its impact on prices has sharpened. On one side are analysts like Goldman Sachs strategist Jeff Currie. He argues the world is drifting toward “the largest commodity shock since COVID.” The market doesn’t agree with Currie, as crude oil futures under $100 per barrel suggest that traders still view the crisis as temporary rather than a structural disruption. The physical data tell a more alarming story. Tanker transits through the Strait of Hormuz have collapsed from a pre-war average of 49 per day to 2 per day. Currie argues that futures prices remain relatively low, while some non-US markets are pricing in reality “closer to $130.” The premium, as we share below, for oil available today has widened from roughly 20% before the war to nearly 50%, in what Berman describes as markets “pricing logistics, location, and access to molecules“.
Berman compares oil stocks to flows. Global inventories remain seasonally higher than any year since 2016, except the COVID collapse of 2020, suggesting the world is not running out of oil. However, there is a problem: the right types of oil are not necessarily in the right places or grades. What looks like a shortage in Singapore and Rotterdam, where prices are much higher than US futures markets, may reflect a “logistics crisis more than an inventory crisis.” Berman notes that duration is the key risk. The bypass pipelines, US. exports, and SPR releases that are making up for oil that can’t transit the Strait are limited in supply. If the disruption persists long enough, “the distinction between stocks and flows will eventually disappear,” and substantially higher prices become necessary to restore market balance.
Futures markets are betting on a near-term resolution. If that bet proves incorrect, the repricing of oil could be significant.
What To Watch Today
Earnings

Economy

Market Trading Update
A note before we start. I am out of the country this week, so I wrote this Tuesday, June 9, before the closing bell. Tuesday’s figures below are intraday, captured late morning Eastern. The relationships they describe do not change with the final tick.
Friday’s chip wreck left one question hanging over the tape all week. Was it the first real crack in a two-month melt-up, or just another dip the bulls were always going to buy? Monday answered for the bulls. The semiconductors that fell by more than 9% on Friday led the rebound, jumping 5% in a single session, and the buy-the-dip crowd declared the matter settled. Tuesday started unwinding that verdict before lunch.
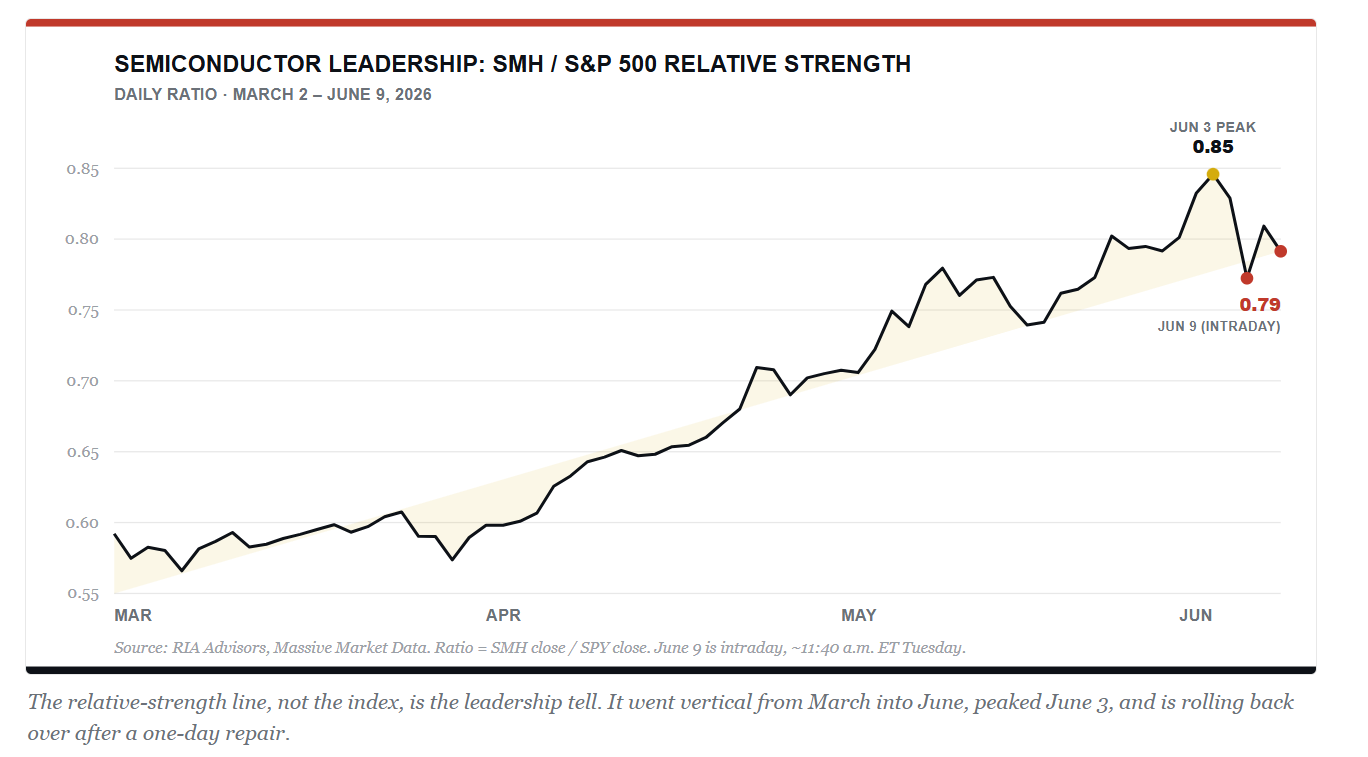
The cleanest way to see what is actually happening is to stop watching the index and start watching who is leading it. The chart below plots the relative strength of semiconductors against the broad market, the ratio of the VanEck Semiconductor ETF (SMH) to the S&P 500 (SPY). When that line rises, chips are carrying the tape. When it falls, leadership is leaking somewhere else. From early March into June it went nearly vertical, the signature of one sector doing the heavy lifting for the entire market. It peaked on June 3. Friday snapped it, Monday clawed back about half the damage, and by Tuesday morning it was rolling over again.
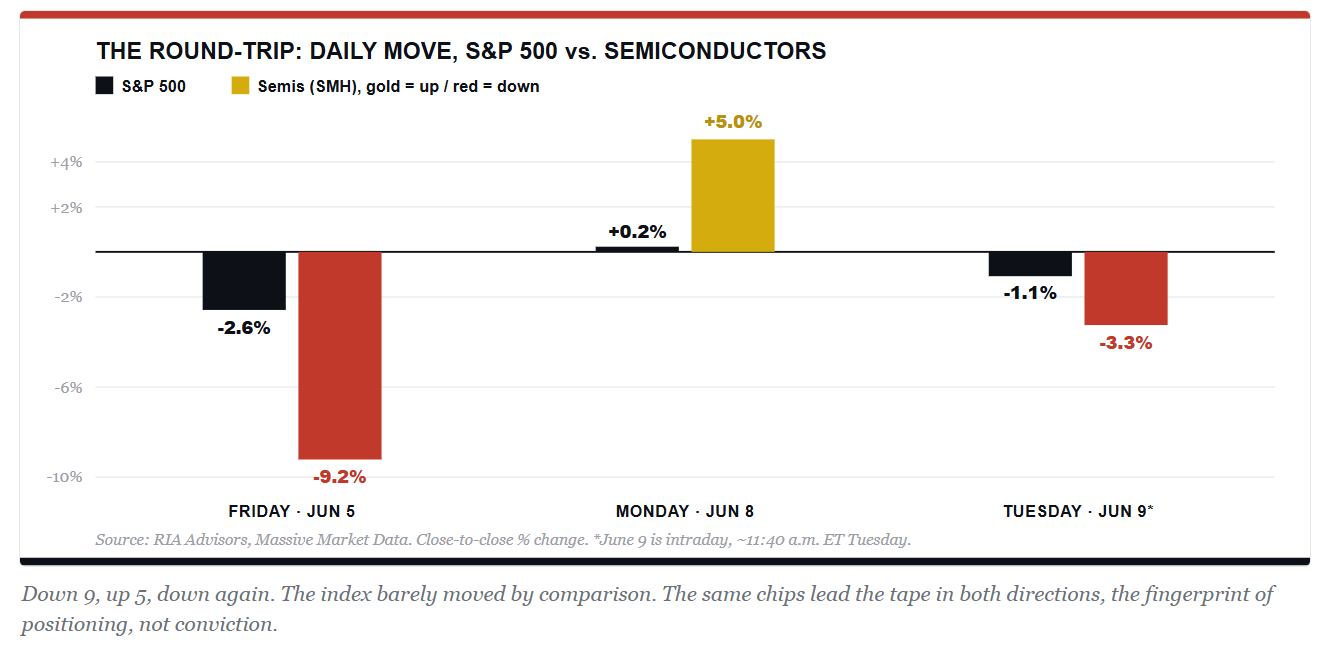
Now look at the round-trip up close. The next chart stacks the daily moves for the S&P 500 against the semis across the three sessions. The index bars are small. The semiconductor bars are violent. Down 9, up 5, and down again. That is not the rhythm of a healthy uptrend. It is the rhythm of a crowded trade being shaken out, with the same names leading the move in both directions.
Tuesday was the tell. Every major chip name gapped higher at the open, SMH opened up nearly 2%, and then sellers spent the morning unwinding it. By late morning SMH had given back 3.3%, Broadcom (AVGO) was down 3.8%, and AMD had shed close to 5%, while the S&P held a more orderly 1.1% decline. The bounce got bought at the open and sold into the day. When the snap-back leaders are the first names sold on the follow-through, the dip-buy reflex is being tested, not rewarded.
Here is what should keep you honest about the downside. Even after two rough sessions, SMH still sat about 12% above its 50-day moving average on Tuesday, against just 2% for the S&P. The chips have not gotten cheap. They have unwound a sliver of a very large overextension. If leadership is changing hands, there is a great deal of air beneath these prices.
None of this confirms a top, and the next test of the thesis lands tonight. Oracle (ORCL) reports after the close today, and it matters here for one reason. The AI trade has run on a drumbeat of upward revisions, and Broadcom’s guide last week was the first time that drumbeat skipped a beat. Oracle is the next read. It is not a chipmaker, but it is one of the largest buyers of the chips, and its capital-spending plans, set against a record $553 billion order backlog, are a direct demand signal for Nvidia, Broadcom, and AMD. Watch the capex line; it cuts both ways. For Oracle’s own shares, the worry is excessive spending and the resulting drag on cash flow. For the chips, the risk is the opposite, a guide-down that says the buildout is slowing. A confident spend hands leadership back to the semis. A trimmed forecast tells you Friday was a warning, not a one-off.

Novo Vs. Lilly: Divergent Stock Prices With Same Blockbuster Drug
Goldman Sachs recently released a research note in which it increased its forecast for GLP-1 weight-loss drug usage by nearly 15%. Per their analysis, the following are the primary reasons.
- Novo Nordisk’s Wegovy GLP-1 was the first to offer an oral formulation rather than an injectable. The oral now accounts for nearly 50% of sales. The oral version will be more viable for new and existing users.
- Goldman sharply increased sales projections from international markets, as current demand is consistently beating expectations.
- Medicare coverage expansion starting on July 1 could add 17 million patients in the US, per Goldman.
- Price declines for GLP-1s are making it more accessible.
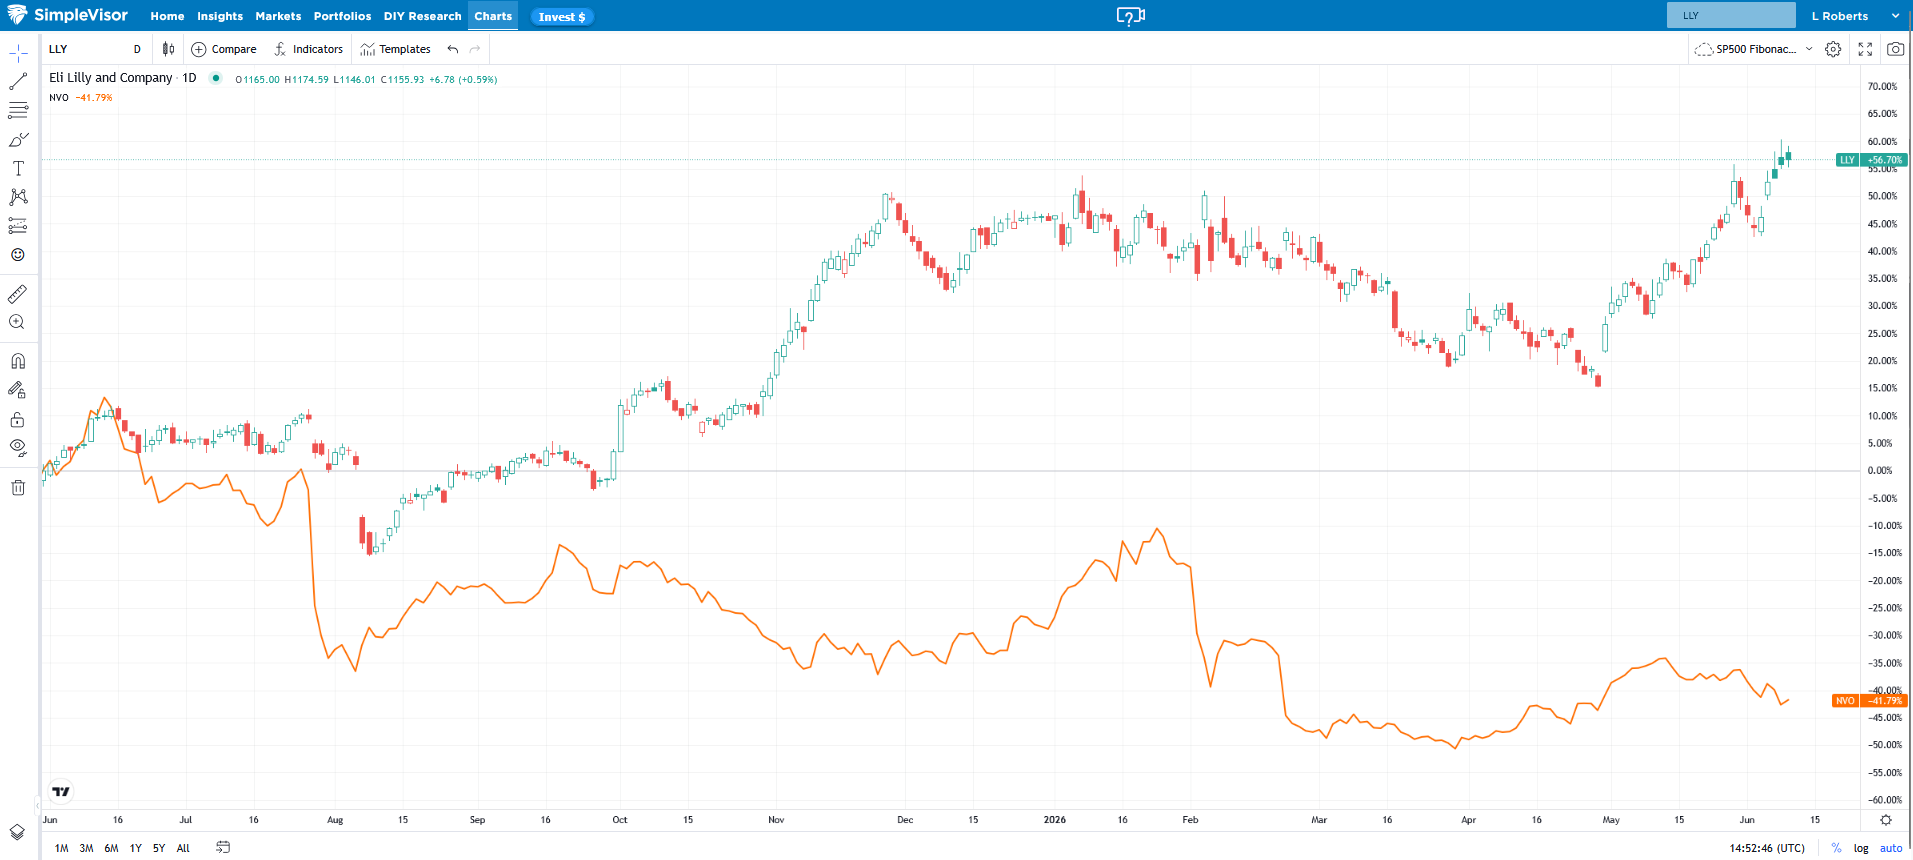
Given the optimistic outlook for GLP-1 drugs, why have the stocks of the two predominant players, which account for over 80% of sales, behaved differently, as we share below? Eli Lilly and Novo Nordisk are competing for the same $114 billion market, but investors are treating them very differently. For starters, Eli Lilly holds a projected 48% share of the oral market, versus Novo’s 38%. Further, Lilly’s Mounjaro is driving the international growth surprise that prompted Goldman’s upgrade. Novo faces a double headwind as its oral Wegovy launch, while strong, is tracking below Lilly’s figures. As a result of sales trends, the market is beginning to price in a structural shift in competitive positioning. Simply put, the stock has underperformed Lilly as investors rotate toward Lilly’s broader pipeline and stronger international execution.

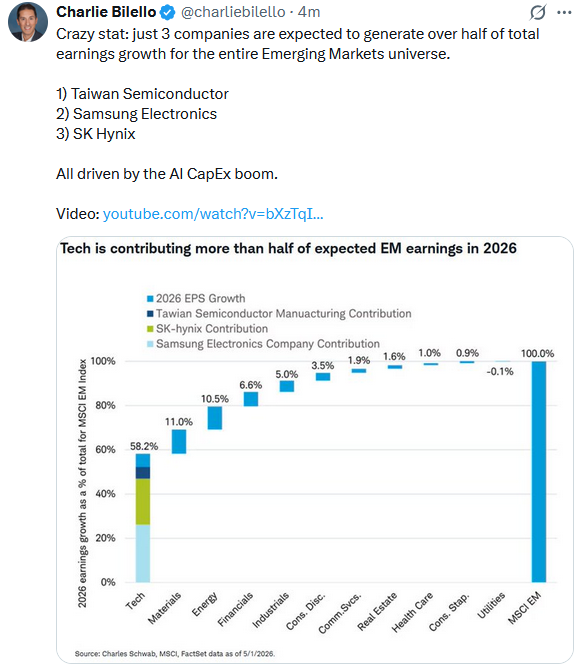
Tweet of the Day
New UPDATED Trading Rules With Desktop Printout
“Want to achieve better long-term success in managing your portfolio? Here are our 15-trading rules for managing market risks.”
Please subscribe to the daily commentary to receive these updates every morning before the opening bell.
If you found this blog useful, please send it to someone else, share it on social media, or contact us to set up a meeting.

