
🔎 At a Glance
- May Inflation Of 4.2%: Media Narrative Misses The Reality
- Market Brief & Technical Review
- From Lance’s Desk: The K-Shaped Economy: Why The Middle Class Moved Up. – RIA
- Market stats, screens, and risk indicators
🏛️ Market Brief – SpaceX Debuts And Elon Is A Trillionaire
What a week. A rocket company became the largest public offering in history. The May inflation print landed mid-week as the hottest reading in three years. And the whole tape spent five sessions hostage to a single question about the Persian Gulf. When the dust settled, the S&P 500 closed Friday at 7,431.46, up 0.65% on the week. That rally clawed back roughly a quarter of the prior Friday’s brutal 2.64% plunge to 7,383.74. The Nasdaq added 0.70%, and the Dow gained 0.66%. Small caps kept doing their 2026 thing, with the Russell 2000 leading on the upside again.
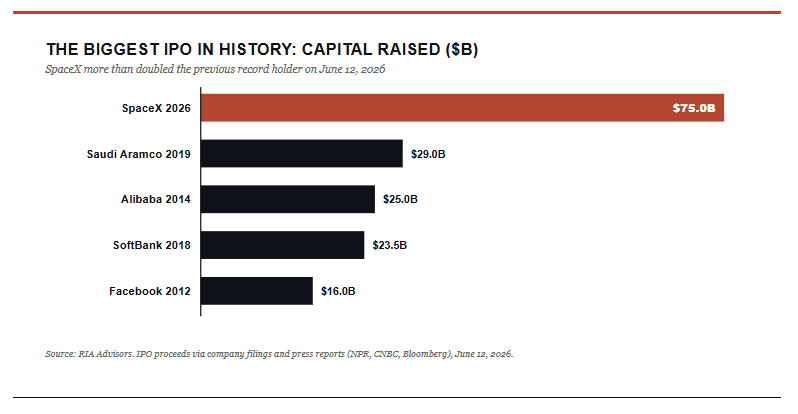
The headline event was SpaceX’s (SPCX) Friday debut. The stock priced at $135, opened at $150, and closed its first session at $160.95, a 19% pop. That surge briefly pushed the company’s value above $2.2 trillion, making Elon Musk, on paper, the world’s first trillionaire. The offering raised about $75 billion. That isn’t a record. That is more than double Saudi Aramco’s prior record, the $29 billion deal in 2019.
So what did the action actually tell us? Three things.
First, the appetite for the AI story has not died; it has simply moved venues. Money that fled semiconductors during the prior week’s chip wreck found a fresh, even bigger AI vehicle to chase. With SpaceX now housing the former xAI unit and pitching data centers in orbit, the enthusiasm was unsurprising.
Second, the broad index barely budged on the spectacle. The S&P added only half a percent Friday, even as a $2 trillion company traded at record volume, which suggests the enthusiasm is concentrated, not contagious. Of the 550 million shares issued for the IPO, 517 million changed hands on the first day. In other words, almost every share that was allocated in the IPO was sold.
Third, and most important for the weeks ahead, a flood of supply is on the way. As discussed in that article, the well-received SpaceX clears the runway for the rest of the queue, and OpenAI and Anthropic are reportedly next. When the most prized private names all rush the exit at once, history says pay attention to who is selling.
Underneath that headline, the macro week was a tug-of-war. Wednesday’s May inflation print showed headline inflation reaccelerating to 4.2% year over year, the fastest since April 2023, while crude oil and the Iran conflict drove the entire week’s risk tone. Stocks sank Tuesday when President Trump teased fresh strikes, then ripped higher Thursday when he called them off, then drifted up Friday on reports of a near-term truce that would reopen the Strait of Hormuz. Oil fell from roughly $91 early in the week to $84.29 by Friday. The 10-year Treasury yield, rather than spiking on the hot CPI, actually eased to 4.45% from 4.55%, and the VIX collapsed to 17.68 as the war premium drained out.
The thread to carry into next week is simple. This tape is not trading on earnings or valuation right now. It is trading on oil and on the headline it feeds, and that single variable will set the table for the Fed meeting on Wednesday.
📈Technical Backdrop – Held The 50-DMA, Now What
We have previously discussed the risk of a pullback following a prolonged stretch of weekly advances. While the bulls can take the week, the 3-5% correction we discussed is now complete. The market hit support at the 50-day moving average and registered a 4.5% peak-to-trough decline. Notably, the “buy the dip” crowd showed up exactly where they were expected to.
“A normal 5% to 8% pause here only takes us back to the 50-day. That’s the level trend-followers add to, not abandon.“
The S&P probed the mid-7,200s intraday around Tuesday and Wednesday. Held, and then rallied hard Thursday and Friday to close the week at 7,431.46. That is textbook support behavior, and it keeps the larger uptrend intact above the April 2025 lows. The quality of the bounce matters too. Thursday’s 1.75% surge came on broad participation rather than a narrow handful of megacaps. That is the kind of thrust that tends to mark a low rather than a dead-cat bounce.
Momentum tells the more interesting story. The 14-day RSI sat above 70 in late May when the index printed its all-time high near 7,621. By the depths of this month’s pullback, it had fallen to roughly 41, and it closed the week back at 52.73, just above the neutral 50 line. In plain terms, the market burned off its overbought condition without breaking trend. Momentum has now turned back up, which is the healthiest way for a market to digest. MACD remains above its zero line, but the histogram rolled over during the selloff. Therefore, upside momentum is positive but no longer accelerating. Breadth is the soft spot. As of mid-week, only about 51% of S&P members traded above their own 50-day average. As has been the case, it remains a thin majority for an index sitting 2.5% below its high.
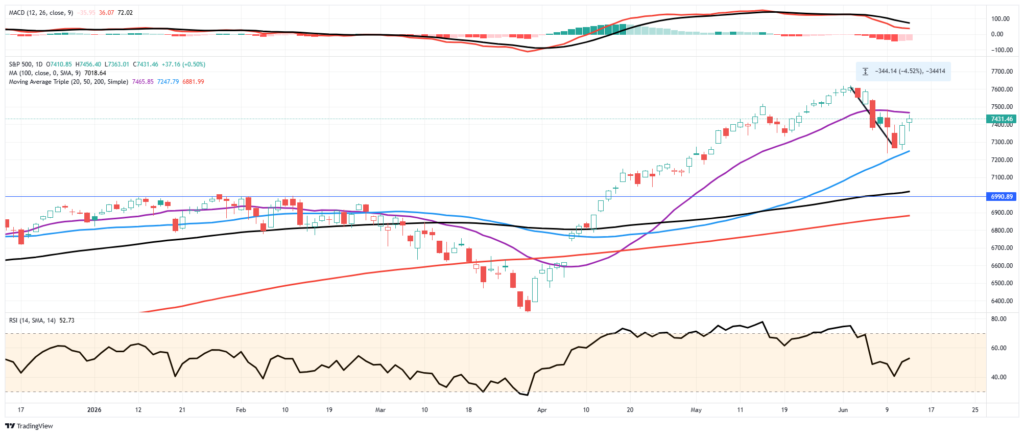
Here is the trader’s map for the week. The first hurdle overhead is the 20-DMA at 7,466, which the index is pressing right up against, then the round 7,500 level, then the prior all-time high at 7,621. Support is the line in the sand. The 50-DMA at 7,248 just proved itself, below that sits the 38.2% retracement of the March-through-June rally at 7,118, and below that the rising 200-DMA at 6,882.
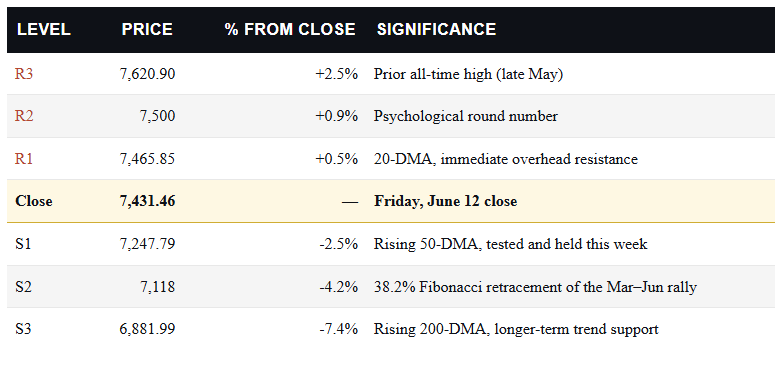
The single level I’m watching into next week is 7,248. Hold the 50-DMA through the Fed meeting and this looks like a routine shakeout inside an uptrend, the kind of healthy pullback that resets sentiment without doing structural damage. Lose it on a hawkish surprise and the 7,118 Fib line becomes the real test, with the 200-DMA at 6,882 as the last line of defense for the bull case. Keep trailing stops disciplined and resist the urge to chase the SpaceX-fueled enthusiasm at the highs..
🔑 Key Catalysts Next Week
Everything funnels into Wednesday. The Federal Reserve concludes a two-day meeting on June 17 with a rate decision, an updated dot plot, and a press conference, and this one carries an extra layer of intrigue because it’s the first meeting chaired by Kevin Warsh. Markets are pricing a near-certain hold, with the CME FedWatch tool putting the odds of no change above 96% and, tellingly, now leaning toward a hike rather than a cut as the next move. So the rate itself is a non-event.
The real signal sits in the Summary of Economic Projections, where a single shifted dot or a hawkish tweak to the inflation forecast would tell us how the new chair plans to treat an energy-driven price spike. The question is not what the Fed does on Wednesday. It’s how a hard-money chair frames a 4.2% May inflation print he can’t control.
The same morning brings May retail sales, which matter more than usual. If the consumer is rolling over while inflation runs hot, the stagflation whispers get louder, and that combination is the one scenario that genuinely complicates the look-through case I make below. If spending holds, it hands the hawks more cover to keep policy tight.
Monday’s industrial production and Tuesday’s housing starts fill in the growth picture, and the Bank of Japan delivers its own rate decision Tuesday, a reminder that the yen carry trade is never far from the conversation whenever global liquidity gets repriced. Thursday is light on data but heavy on read-through, with Accenture reporting. Watch its commentary on AI consulting demand closely, because it’s one of the cleanest tells on whether corporate AI spending is still accelerating or starting to cool.
Notably, this is also a holiday-shortened trading week with the markets closed on Friday, June 19, for Juneteenth. With all the weight stacked on Wednesday, the risk of holding stocks over a long weekend rises.

Need Help With Your Investing Strategy?
Are you looking for comprehensive financial, insurance, and estate planning services? Need a risk-managed portfolio management strategy to grow and protect your savings? Whatever your needs are, we are here to help.

💰 May Inflation of 4.2%: Media Narrative Misses Reality
The May inflation print landed on Wednesday, and the doom crowd pounced. Headline CPI reaccelerated to 4.2% year over year, the hottest reading since April 2023, and the “inflation is back” choir was in full voice within the hour. I want to push back on that, because two weeks ago I made exactly this argument in “Why The Doom Crowd Is Watching The Wrong Indicator,” and this May inflation print is the clearest confirmation yet. The scary headline is not a broad inflation breakout. It’s an oil bill.
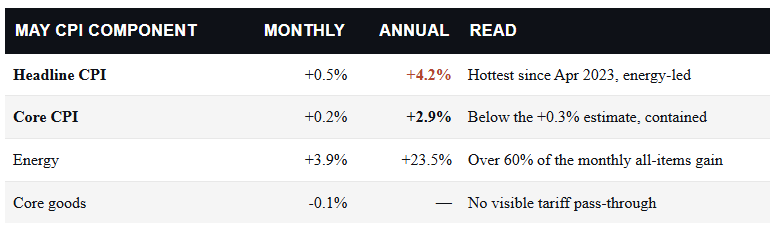
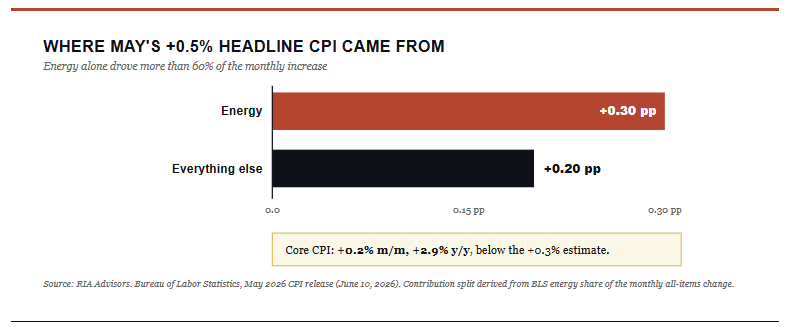
Strip the May inflation print open, and the story falls apart on the first page. Energy prices jumped 3.9% in May alone and are up 23.5% over the past year, and that single category accounted for more than 60% of the entire monthly increase in the all-items index. The high correlation between oil prices and the May inflation print is unsurprising, given the pass-through of rising energy prices into the underlying products and services it touches.

This is why the “Core CPI” is more important to watch, particularly from a market and monetary policy view. The core reading removes food and energy precisely because they’re volatile and supply-driven, rose just 0.2% on the month. That was below the 0.3% economists expected. Core goods prices actually fell 0.1%, which tells you the tariff pass-through everyone feared all spring simply isn’t showing up in the data.
This is why paying attention to real wages is the most important point.
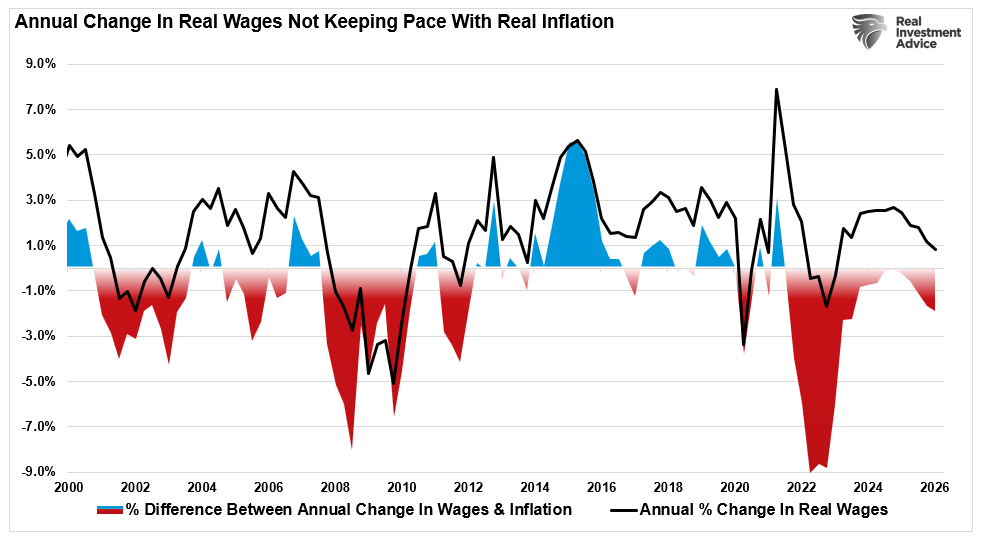
A 4.2% headline that is three-fifths gasoline is not the same animal as a 4.2% headline driven by wages, rents, and services broadening out across the economy. That is what real wages are telling us. The first is a tax on consumers that demand will eventually crush. The second is the kind of self-reinforcing spiral the Fed actually fears.
This report is emphatically the first kind.
Core Inflation Is Doing Exactly What the Fed Wants
Here’s the part of the May inflation print that got buried under the headline. At a 0.2% monthly pace, core inflation is running right around the Fed’s target on an annualized basis, and the year-over-year core rate of 2.9% is the number that actually drives policy. The chart below shows the sources of May’s headline increase. When 60% of a monthly print is one volatile category that swings on a Persian Gulf headline, you don’t have an inflation problem. You have an oil problem wearing an inflation costume.
This matters because the Fed under Kevin Warsh has to decide what to react to. A hard-money chair has every temperamental reason to lean against a 4-handle headline. But the mandate is built on core and on expectations, and both are behaving. The Fed will look THROUGH an oil spike it cannot control, because hiking into an energy shock would only deepen the demand destruction that’s already pulling the headline back down on its own.
Don’t believe me? The bond market is already telling you the same thing.
The Bond Market Already Looked Through the Headline
The smartest, deepest pool of capital on the planet already told you the same thing about the May inflation print. If the bond market believed 4.2% was a real, sticky, broadening inflation problem, yields would have ripped higher and the curve would have repriced for tighter policy. The opposite happened.

The 10-year yield eased to 4.45% from 4.55% across the week, the 2-year dropped a full 12 basis points to 4.05%, and the rate market kept pricing a near-certain hold at Wednesday’s meeting. That’s not the signature of a bond market bracing for an inflation regime change. That’s a bond market that read the same energy carve-out I did and concluded the headline will fade as oil rolls over on Strait of Hormuz peace headlines.
Think about how unusual that is. The hottest inflation print in three years lands, and the asset most sensitive to inflation rallies. Bonds and stocks don’t always agree, but when they diverge this sharply on an inflation read, the bond market is usually pricing the more durable signal, because its participants get paid to be right about exactly this variable. When that happens, I’ll take the bond market’s verdict almost every time.
“Inflation isn’t a single number, it’s a regime. And regimes are set by the variables that lead, like wages, not the variables that follow, like a gasoline-driven CPI headline.”
What Should Investors Do Now
None of this means you ignore inflation or abandon discipline. It means you refuse to let one oil-soaked May inflation print stampede you out of a market that just held its 50-DMA and burned off an overbought condition. The risk into a Warsh-led Fed is real, and the right response is to manage exposure, not to panic-sell into a 0.65% up week.
Here is how we’re thinking about positioning.

While the doom crowd is frantically telling you that the May inflation print of 4.2% means the Fed is trapped and the bull market is over, look at the receipts. Core is at target, the bond market shrugged, oil is already falling on peace headlines, and the tariff pass-through everyone feared never showed up in core goods.
The honest risk isn’t runaway inflation. It’s a hawkish Fed reacting to the wrong number on Wednesday, and that’s a risk you manage with stops and cash, not by dumping good companies into a recovering tape. I’ve been through enough of these headline scares to know that the investors who get hurt are rarely the ones who stayed disciplined. They’re the ones who let a single scary number make the decision for them.
Watch 7,248, watch the dots, and watch the wages.
🖊️ From Lance’s Desk
This week’s #MacroView blog examines the “K-shaped” economy, which has become a media narrative suggesting the middle class is being left behind as the wealthy hoard all the money, but is that “true?”
Also Posted This Week:
- The IPO Boom: Where Will The Money Come From? – RIA – by Michael Lebowitz
- Equity Supply Surge: What Historically Comes Next – RIA – by Lance Roberts
📹 Watch & Listen
Is the U.S. Dollar really collapsing, or is the world still trapped in a dollar-based system with no true alternative? Brent Johnson and I break down the myths behind de-dollarization, why BRICS nations still face trust problems, and how the global monetary system depends on U.S. dollar liquidity, debt markets, and swap lines.
Subscribe To Our YouTube Channel To Get Notified Of All Our Videos
📊 Market Statistics & Analysis
Weekly technical overview across key sectors, risk indicators, and market internals

💸 Market & Sector X-Ray: Market Rebounds From 50-DMA
As noted last week, we expected the rotation to continue this week, which it did early as the market tested its 50-DMA. Defensive areas of the market offset some of that decline. Given the massive expansion across the Technology market, more derisking remains possible, so trade accordingly.

📐 Technical Composite: 80.62 – Correction From Overbought
As noted last week, “That correction process likely started this past week, and could have more to go before a more buyable entry point reveals itself.” That buy point appeared on Wednesday as investors started “buying the dip” near the 50-DMA. Technically, the market reset a small bit of its previously overbought condition, but remains stretched. Trade accordingly.

🤑 Fear/Greed Index: 74.15 – Greed Remains Stable Despite Early Week Selloff
After last week’s selloff, which sharply reduced investor sentiment from extreme greed to greed, the late-week rally kept sentiment in greed territory. We will see how markets respond into next week, but upside is likely limited at this juncture until a larger reduction in sentiment occurs.

🔁 Relative Factor Performance
Last week, we noted that “The correction that started last week, was inevitable and likely has more room to go as money rotates from risk-on to risk-off.” That happened early in the week pushing MegaCap stocks into more oversold territory while Momentum remains very overbought. Interestingly, a “risk off” rotation may find the MegaCap stocks a place of safety if any market correction resumes next week.

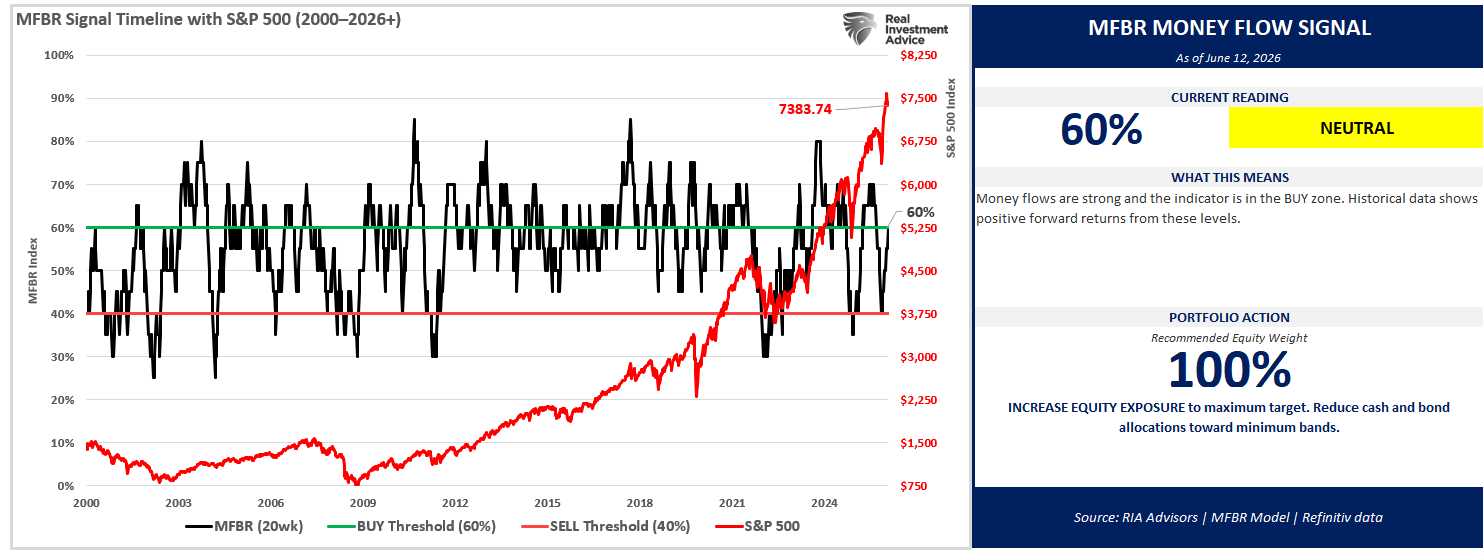
📊 MFBR Index (Money Flow/Breadth Ratio Indicator): 60% = Buy Zone
NEW! MFBR Index: The Money Flow Breadth Ratio (MFBR) model is a rules-based equity allocation framework that uses weekly S&P 500 money flow data to generate buy, sell, and neutral signals. The MFBR systematically adjusts portfolio equity exposure in response to the direction and persistence of institutional capital flows. It aims to reduce drawdowns while capturing the majority of market upside.
“As of June 12, 2026, with the S&P 500 at 7,431.46, the Money Flow Breadth Ratio (MFBR) stands at 60% and rising. This places the indicator in BUY territory (60-70%), triggering a NEUTRAL signal. The prior week reading was 55%, representing a 10% decline over the trailing four weeks. The model currently recommends HOLDING exposure at 100%, a level that has remained since April 17, 2026 (8 weeks). This reflects a FLOW-OVERLAY OVERRIDE: the trailing 4-week net dollar flow has swung sharply positive (>$300B) after a deeply negative prior 4 weeks, a historically strong contrarian buy signal.”
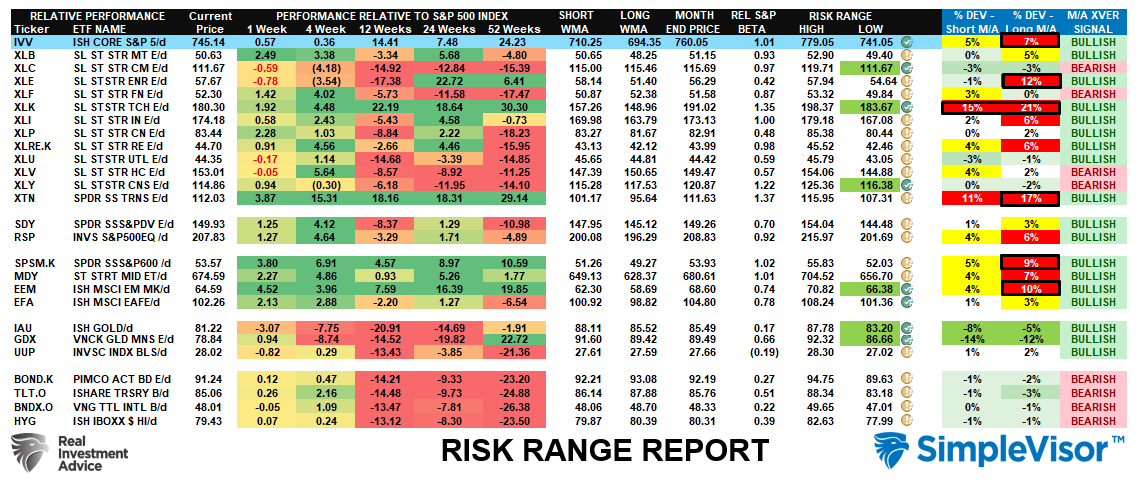
📊 Sector Model & Risk Ranges
As noted last week, “The broad market is very overbought and trading well above its normal monthly range, along with Technology, which has been responsible for the majority of the market’s recent advance. Technology is increasingly deviating from its short- and long-term means, and a reversal is becoming much more likely.” That correction came this past week, and the deviations started to reverse. Technology, Energy and Transportation are still well above long-term means, but those deviations are closing. As discussed previously, the risk of a rotation was elevated so the process of risk management paid dividends.
Have a great week.
Lance Roberts, CIO, RIA Advisors

