
🔎 At a Glance
- Kevin Warsh And The End Of The Fed’s “Forward Guidance”
- Market Brief & Technical Review
- From Lance’s Desk: The Consumer Sentiment Disconnect From Economic Reality – RIA
- Market stats, screens, and risk indicators
🏛️ Market Brief – Kevin Warsh Jolts A Resilient Tape
For a week that delivered a hawkish regime change at the Fed and the largest options expiration in history, the tape held up remarkably well. All four major indices finished green. The Nasdaq Composite led, up 2.43% to 26,517.93, with the Russell 2000 gaining 1.22% to 2,979.77, the S&P 500 adding 0.93% to 7,500.58, and the Dow rising 0.71% to 51,564.70. That is not what most desks would have drawn up after Wednesday.
The path mattered more than the destination. Stocks ripped on Monday after the US and Iran announced a deal to end hostilities, with the S&P jumping 1.65% and the Nasdaq surging by more than 3%. They handed much of it back on Wednesday when Kevin Warsh used his first meeting as Fed Chair to drop forward guidance and reveal a dot plot in which nine of eighteen officials now pencil in a rate hike this year. Then Thursday’s record quadruple-witching expiration cleared, chips and cyclicals firmed, and the indices closed the holiday-shortened week higher. Markets were dark on Friday for Juneteenth.
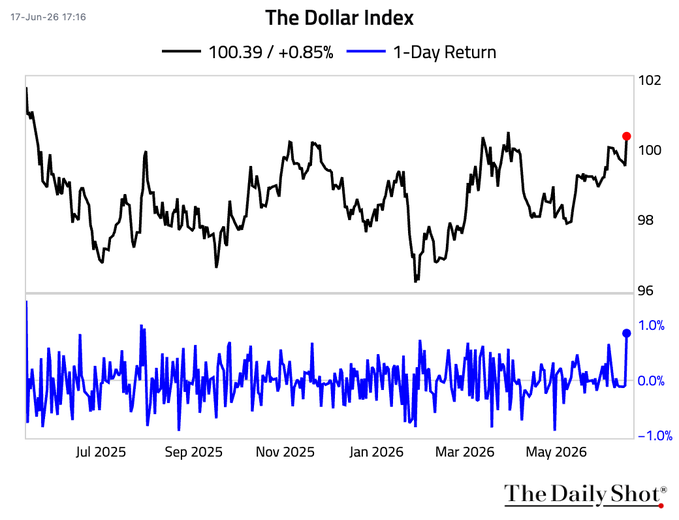
The cross-asset board did the explaining. The dollar was the standout. A hawkish Warsh and a market now pricing a rate hike by October lifted the dollar index to roughly 100.7, its highest since May 2025. Gold fell about 3.5% on the week to near $4,175 as the firmer dollar and higher real yields sapped the metal. Treasury yields jumped on Wednesday’s dots, with the 2-year ending at 4.19% and the 10-year at 4.46% after easing slightly on Thursday. Crude held its ground near $75.70, but energy equities lagged as the US-Iran memorandum drained the last of the geopolitical premium, and pump prices finally slipped below $4 a gallon for the first time since March.

The standout under the surface was what didn’t happen. The VIX actually fell on the week, easing from above 18 into the mid-16s. This happened despite the Fed turning hawkish, with only a brief pop to 17.2 on the decision. Energy was the clear sector laggard while technology, semiconductors, and small caps carried the load. A market that meets a hawkish regime change with falling volatility is a confident one. Notably, that confidence is precisely what gets repriced when the next surprise lands.
The thread to carry into next week is straightforward. With the Fed no longer telegraphing its hand, the incoming data sets the tone on its own. Thursday’s PCE inflation print is the first real test of that new world.
📈Technical Backdrop – Market Rally Following Kevin Warsh’s Hawkish Stance
The S&P 500 closed the holiday-shortened week at 7,500.58, up 0.93%. That is a number that looks almost dull until you trace the path that produced it. The index rose to 7,554 on Monday on the US-Iran ceasefire. It then handed most of it back into Wednesday’s 7,420 low as Kevin Warsh’s hawkish debut landed. But on Thursday, the market rallied through the largest options expiration on record. That was quite a week, and the market finished only 1.4% below the June 2 record of 7,609.78.

The trend structure is still constructive. Price sits just above a flattening 20-DMA at 7,487. It is also 2.4% above a rising 50-DMA at 7,329, and 8.4% above the 200-DMA at 6,917. That 50-DMA is the same line that absorbed the 4.5% dip we walked through in last week’s report. It has not been seriously tested since. RSI sits at 54.9, which is squarely neutral, with room to run in either direction. The lone caution flag is momentum. Notably, the MACD remains below its signal line, with a negative histogram. The leftover of an early-June pullback, the price has recovered, but momentum has not.
The mechanics are the story for the next two weeks. As Citadel Securities’ Scott Rubner notes, Thursday’s roughly $8.3 trillion quadruple-witching expiration, the largest in history, cleared a substantial block of gamma and leaves the tape more sensitive to flows into month- and quarter-end. Rubner’s read past the reset is constructive. There is record retail demand, a buy-the-dip reflex that holds while the VIX sits in the mid-teens. Moreover, one of the strongest seasonal windows of the year approaches as July’s allocation cycle begins.
“May shattered previous activity records in cash equities, surpassing the prior monthly high set in January 2021 by more than 10%. Retail cash equity volumes ran 60% above the 2025 average and more than twice the 2024 average. From this peak, activity has accelerated further in June, with volumes this month tracking 9% above May’s record. Nine of the ten largest retail trading days ever observed on our platform have occurred in just the last month, including seven during the first half of June alone. Friday (June 12) marked the largest single day of retail net buying in our dataset, surpassing the previous record by 50%.” – Citadel

We splice that flow tailwind against the main story below. The path of least resistance may well be higher. However, Warsh just pulled out the guidance cushion, and an OPEX-thinned tape reacts harder to surprises. Respect 7,329 and the 50-DMA as support. Investors should treat the 7,610 record as the level to clear. Remain attentive and let price, rather than the narrative, set your exposure.

Trade accordingly.
🔑 Key Catalysts Next Week
Next week is built around one number. With Kevin Warsh stripping out forward guidance, the market no longer has a Fed roadmap to lean on. That means the data has to do the talking. As noted above, the most important release lands on Thursday.
On Thursday, June 25, the Bureau of Economic Analysis releases the May PCE price index. That reading will be alongside the third and final estimate of first-quarter GDP. The PCE report is the Fed’s preferred inflation gauge, and the first to fall within Warsh’s new framework. April ran hot at 3.8% headline and 3.3% core. Wells Fargo looks for the May headline PCE to accelerate toward 4.1% on energy costs, with core near 3.4%. A hot print hardens the case for a rate hike, but the report is a relic of high oil prices. Core is the line that matters most here. Energy is the one part of inflation that the Fed admits it cannot fix with rate policy. However, given the decline in oil prices, the markets will likely “look through” the report.
The earnings calendar carries its own signal. FedEx reports on Tuesday and is the classic read on global shipping and trade volumes. Micron follows on Wednesday and is the cleanest signal for AI memory demand. Any cautious reading could undermine the parabolic rise in that sector leadership. Carnival, Paychex, and Jefferies fill in around them. Wednesday also brings May’s new home sales and the Federal Reserve’s annual bank stress-test results. The latter is worth watching for what it signals about capital returns across the financials.
One thing the calendar is light on is Fed-speak. Part of Warsh’s redesign is fewer public appearances, so there is no parade of governors to massage the message between meetings. That puts even more weight on the print itself.
Layered over all of it is the calendar itself. Next week runs into quarter-end, and the pension and index rebalancing flows we flagged in the technical section build through the week toward June 30. Any data-driven weakness will collide with mechanical month-end repositioning, which can amplify the move in either direction.

The one to circle is Thursday’s PCE. In a market that just lost its forward guidance, an upside surprise on the Fed’s preferred inflation gauge is the cleanest path to pricing that 2026 hike in full, and the dollar and the front end of the curve will move first.
Need Help With Your Investing Strategy?
Are you looking for comprehensive financial, insurance, and estate planning services? Need a risk-managed portfolio management strategy to grow and protect your savings? Whatever your needs are, we are here to help.

💰 Kevin Warsh And The End Of The Fed’s “Forward Guidance”
The Fed didn’t move rates this week. The target range held at 3.50% to 3.75% for a fourth straight meeting, exactly as priced. But underneath that non-event, Kevin Warsh did something far more consequential than any quarter-point decision. He changed how the Fed talks to you. Previously, in “Bull Market Pullback: Why The 4.5% Dip Held The 50-DMA,” we noted this bull rests on a narrow set of supports. Warsh just pulled one of them out.
As shown, the normal FOMC statement ran just 130 words, down from north of 300 in recent meetings. As we noted in the Daily Market Commentary:
“It’s the shortest since the Alan Greenspan era and contains no forward guidance. Also of note, there were no dissenting votes, which suggests the Fed’s posture is more hawkish. The statement “The Committee will deliver price stability,” together with the higher inflation forecasts, is definitely hawkish. That said, they also state, “its policy of maintaining ample reserves in the banking system.” This line may lead some to believe the Fed could do QE even if it hikes rates.”

The bottom line, and arguably the most crucial, is that forward guidance is gone. Warsh called the old language “not well suited for the current policy conjuncture.” He’s right and said the new version simply lays out the facts as best the committee can judge them. He declined to submit his own dot to the projection plot. However, most importantly, he rolled out five new task forces. Those task forces will review the Fed’s communications, its balance sheet, operations, data sources, and the drivers of inflation.

This is not cosmetic. For roughly fifteen years, the Fed has operated on a simple bargain. The Fed tells markets roughly what it intends to do. In exchange, markets price the path with far less drama. That process has worked. However, Kevin Warsh just tore up that bargain on day one for a good reason. We will discuss that more momentarily.
The real shock wasn’t the statement. It was the math underneath it. In March, the median FOMC member projected the funds rate would end 2026 at 3.4%, implying a cut. The projections Kevin Warsh’s committee released Wednesday put that median at 3.8%, a quarter point above today’s range. Nine of eighteen officials now pencil in at least one hike this year, and six of them see two. The committee also marked PCE inflation up to 3.6% from 2.7%, trimmed growth to 2.2%, and nudged unemployment down to 4.3%. The 2027 and 2028 dots still show one cut each, so the message isn’t permanent war on inflation. It’s higher for longer, starting now.

Read that again. The same body that opened the year telling you to expect cuts is now telling you to expect hikes, against 4.2% CPI, the hottest reading since April 2023. Goldman’s Kay Haigh said the bank’s base case is still that the Fed narrowly avoids hiking, but he called the path narrow and put a high premium on the incoming inflation data. As we argued earlier this year in “The Weak Dollar Narrative,” Warsh’s policy was always likely to run more hawkish and more dollar-friendly than the easing crowd wanted to believe. This week confirmed it, and the dollar had its sharpest rally in quite some time.
So, with that, I said I would get back to the “why” behind the Fed killing forward guidance.
Why Killing Guidance Kills The “Fed Put”
Forward guidance was never really about precision. It was about suppressing volatility. Bernanke institutionalized it after 2008, Yellen refined it, and Powell leaned on it hard through COVID and the subsequent hiking cycle. The promise buried inside every “data-dependent” caveat was that the Fed would telegraph its hand before it acted. That telegraph is what investors came to treat as the “Fed put.”
In other words, the market quit trading on fundamentals and just came to trade off the Fed’s guidance. The “Fed Put” is simply the inherent “belief” that, no matter what happens, the Fed will respond to save the markets. That belief is anchored in a statement made by Ben Bernanke in 2010, when the Fed launched its second round of Quantitative Easing.
“This approach eased financial conditions in the past and, so far, looks to be effective again. Stock prices rose and long-term interest rates fell when investors began to anticipate the most recent action. Easier financial conditions will promote economic growth. For example, lower mortgage rates will make housing more affordable and allow more homeowners to refinance. Lower corporate bond rates will encourage investment. And higher stock prices will boost consumer wealth and help increase confidence, which can also spur spending.” – Ben Bernanke
In hindsight, the problem with that approach is abundantly clear, as it created a market based on “moral hazard.”
“The Federal Reserve’s well-intentioned interventions have created one of modern finance’s most powerful behavioral distortions: the conviction that there is always a safety net. After the Global Financial Crisis, zero interest rates and repeated rounds of quantitative easing conditioned investors to expect that policy support would always return during volatility. Over time, that conditioning hardened into a reflex: buy every dip, because the Fed will not allow markets to fail.“
Kevin Warsh has argued for years that guidance ties the central bank’s hands, and at his June 17 press conference, he made the sharper point. The market itself is the signal a telegraphing Fed throws away.
“Financial market prices are probably the most important source of information to guide central bankers. But when all the financial markets are doing is reflecting back what we’ve said, we’re taking the most important source of information and we’re being blind to it.” — Kevin Warsh, June 17, 2026 FOMC press conference
He isn’t wrong on the theory. Removing the cushion still has a cost: uncertainty. Howard Marks has made the point for decades that you can’t eliminate uncertainty; you can only decide how to price it. A guidance-driven Fed priced it for you; however, a Kevin Warsh Fed hands that job back to the market. Markets hate that. When the central bank stops pre-committing, the range of plausible outcomes widens, risk premia have to rise to compensate, and an expensive market carrying a CAPE near 42 has very little margin to absorb that repricing without a drawdown.

None of this is an accident of personality. Citi noted that a new Chair’s first meeting tends to get used to establish hawkish bona fides, and that the two-year Treasury sells off far more than average on those debuts. The tape delivered on cue. On Wednesday, the S&P 500 fell 1.21% to 7,420.10, and the Nasdaq dropped 1.34%, which Charles Schwab flagged as the worst “Fed day” for a new Chair since 1994. The two-year yield jumped roughly 8 to 11 basis points toward 4.15% as traders stripped cut bets out of the front end. Less forward guidance is not the same thing as more discipline, but a transfer of risk, from the Fed’s balance sheet to your portfolio.
So, with that understanding, what should we be thinking about as investors?
What Should Investors Do Now
A Fed run by Kevin Warsh that refuses to pre-commit doesn’t mean you sell everything. It means you change how you operate. The old playbook was to forecast the Fed and position ahead of it. That playbook just lost its instruction manual. The new one is simpler and harder at the same time. You react to data instead of predicting policy, and you build a process that doesn’t depend on knowing what the Fed will do next, because the Fed has now told you plainly that it won’t say. Here are eight adjustments for a market without a guidance backstop.
- First, stop trading the dots and start trading the data. With guidance gone, the economic calendar replaces the press conference as the main event. Every CPI, PCE, payroll, and PPI print is now a standalone catalyst that can move the funds-rate odds on its own. Mark the dates, and size risk going into the big releases rather than carrying full exposure into a number that can swing the hike probability by twenty points in a single morning.
- Second, lift your cash and ballast modestly. This is not a call to go to cash. It’s a call to carry a little more dry powder than you did a month ago, so a guidance-driven air pocket becomes an opportunity instead of a problem. A few extra points in short-term Treasuries or money markets buys optionality you simply didn’t need when the Fed was telegraphing every move.
- Third, don’t bet on a known rate path. A Fed that won’t pre-commit can pivot faster in either direction than a guidance-bound one ever could. That cuts hard against concentrated long-duration positions that only pay off if the path matches your forecast. Keep duration deliberate, and size it to survive being wrong rather than to maximize being right.
- Fourth, respect the levels, not the narrative. We mapped the technical structure last week, and the 50-DMA remains the line that matters. In a no-guidance regime, price action is the cleanest real-time read on how the market is digesting policy, far cleaner than parsing a Fed speech that no longer tells you anything. Let the levels, not the headlines, trigger your exposure changes.
- Fifth, use volatility instead of fearing it. Wider two-way ranges are the direct, mechanical consequence of pulling out the guidance cushion. For an undisciplined investor, that reads as stress. For a disciplined one, it’s a gift, because it widens the gap between good entry points and good exit points and rewards a rules-based rebalancing process.
- Sixth, hedge while complacency is still cheap. The VIX stayed subdued even through Wednesday’s drop, which tells you the market has not yet repriced the uncertainty Kevin Warsh just injected into the system. That is precisely when protection is cheapest. Whether you use index puts, a collar on concentrated winners, or simply trim your most extended positions, the time to buy insurance is before the house is on fire.
- Seventh, watch the front end of the curve for your real signal. With the Fed silent, the two-year Treasury and fed-funds futures now carry the information that the dot plot and the guidance used to provide. If the two-year keeps climbing, the market is pricing a hike regardless of what anyone at the Fed says. That, not the next speech, is your tell.
- Eighth, don’t overreact in either direction. Selling everything because nine dots moved is a mistake, because the dots are projections, not commitments, and this same committee was dead wrong about cuts only six months ago. Dismissing the shift as noise is the opposite mistake. The regime changed this week, even though the rate did not, and the investors who keep operating as if a Fed put still backstops every dip will be the most surprised when it doesn’t.

The Fed put isn’t gone. It just got a lot more EXPENSIVE, and you’re the one paying the premium now. Kevin Warsh just told us, in about 130 words, that he isn’t going to hold the market’s hand on the way down. Position accordingly.
🖊️ From Lance’s Desk
This week’s #MacroView blog examines the University of Michigan consumer sentiment index, which continues to hover at levels not seen since the “Financial Crisis” even as the economy continues to grow. What is causing the disconnect, is there a better measure, and what should investors be paying attention to.

Also Posted This Week:
- Bull Market Pullback: Why The 4.5% Dip Held The 50-DMA – RIA – by Lance Roberts
- The K-Shaped Economy: Why The Middle Class Moved Up. – RIA – by Lance Roberts
📹 Watch & Listen
Markets pulled back on Wednesday as momentum continues to weaken and technical signals become more important. A developing pennant pattern is creating a pivotal setup, with rising support meeting lower overhead resistance. The next move could determine whether markets push to new highs or retest key support levels at the 50-DMA and potentially the 100-DMA.
Subscribe To Our YouTube Channel To Get Notified Of All Our Videos
📊 Market Statistics & Analysis
Weekly technical overview across key sectors, risk indicators, and market internals

💸 Market & Sector X-Ray: Market Rebounds From 50-DMA
As noted last week, the recent correction to the 50-DMA brought retail buyers back into the market. Technology remains the clear winner as Energy continues to give up most of its YTD gains following the resolution with Iran. That market is not broadly overbought, but certain sectors are. As such, manage your exposure risk accordingly and take profits as needed.

📐 Technical Composite: 85.15 – Still Overbought
As noted last week, “The buy point appeared on Wednesday as investors started ‘buying the dip’ near the 50-DMA. Technically, the market reset a small bit of its previously overbought condition, but remains stretched.” That risk on trade continued into the end of the week, pushing the weekly gauge higher. Trade accordingly.

🤑 Fear/Greed Index: 79.46 – Investors Rush Back Into Stocks
We noted that the recent selloff reduced investor sentiment from extreme greed to greed. However, following the SpaceX IPO, retail investors poured back into the markets, pushing stocks and the index higher toward more extreme greed levels.

🔁 Relative Factor Performance
Last week, we noted that “the correction happened early in the week pushing MegaCap stocks into more oversold territory while Momentum remains very overbought.” That remains the case this week although Megacap did see some buying last week. However, the “risk on” trade of high beta stocks, momentum and emerging markets continues and current hold at more extreme levels. Take profits in these areas accordingly before a rotation sets in.

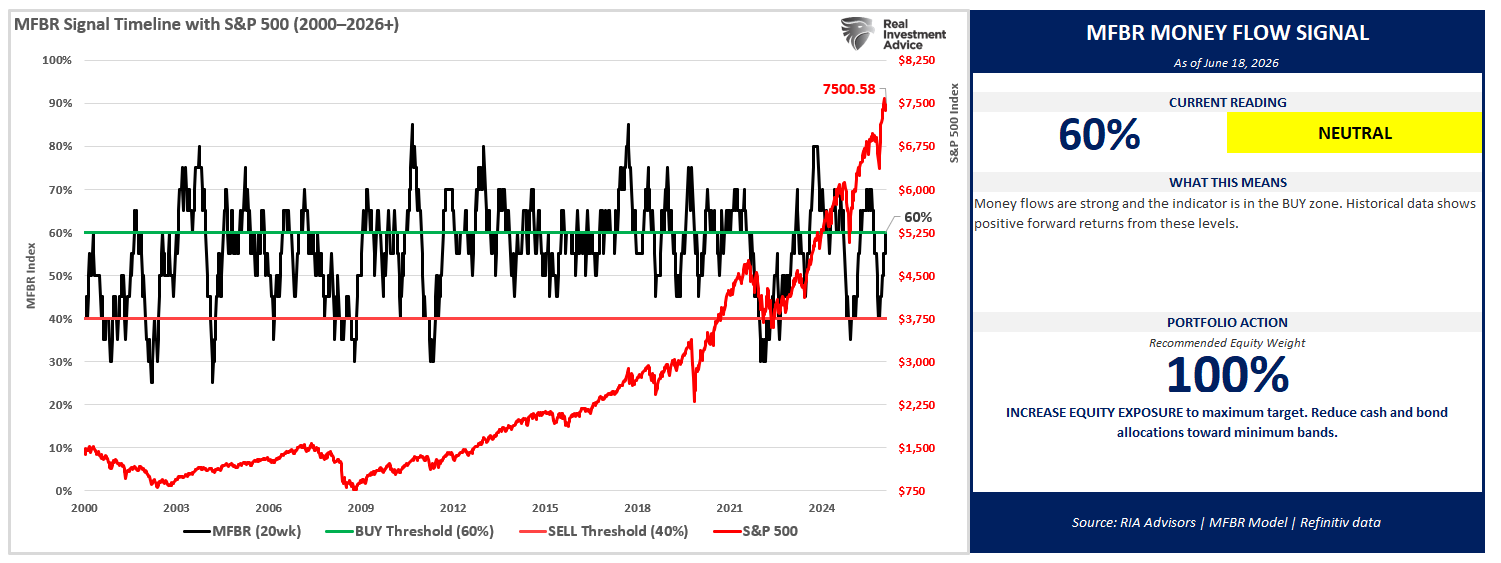
📊 MFBR Index (Money Flow/Breadth Ratio Indicator): 60% = Buy Zone
NEW! MFBR Index: The Money Flow Breadth Ratio (MFBR) model is a rules-based equity allocation framework that uses weekly S&P 500 money flow data to generate buy, sell, and neutral signals. The MFBR systematically adjusts portfolio equity exposure in response to the direction and persistence of institutional capital flows. It aims to reduce drawdowns while capturing the majority of market upside.
“”As of June 18, 2026, with the S&P 500 at 7,500.58, the Money Flow Breadth Ratio (MFBR) stands at 60% and rising. This places the indicator in BUY territory (60-70%), triggering a NEUTRAL signal. The prior week reading was 60%, representing a 5% decline over the trailing four weeks. The model currently recommends HOLDING exposure at 100%, a level that has remained since April 17, 2026 (9 weeks). This reflects a FLOW-OVERLAY OVERRIDE: the trailing 4-week net dollar flow has swung sharply positive (>$300B) after a deeply negative prior 4 weeks, a historically strong contrarian buy signal. The model’s 25-year backtest validates this signal across multiple market cycles.”
📊 Sector Model & Risk Ranges
As noted last week, “the correction came, and the deviations started to reverse. Technology, Energy and Transportation are still well above long-term means, but those deviations are closing. As discussed previously, the risk of a rotation was elevated so the process of risk management paid dividends.” That analysis remains the case this week, even as the market rallied from the recent correction lows, but the selloff in oil has taken Energy from very overbought to oversold. That rotation was always likely, and that is why risk management remains key to long-term success. Small cap stocks, and Emerging markets remain very deviated from long-term means so manage risk wisely.

Have a great week.
Lance Roberts, CIO, RIA Advisors

