
The doom feed says home affordability locked a generation out. The math on the payment you actually write says something the headlines won’t.

Here are the “facts” that the media tells you about home affordability.
Let’s start with a recent survey. Two out of three Americans now say it’s a bad time to buy a house, the most negative reading Gallup has ever recorded.1 Another study showed that a record 25.2 million adults under 35 are living with their parents.2 Scroll any feed, and you’ll hear that home affordability has priced an entire generation out for good. Those are the “facts” according to the media.

However, here’s the problem with that story. When you measure home affordability today against the metric that actually governs the check you write each month, the picture flips. By that measure, buying a home may be easier now than it was for the Boomers and Gen Xers who get blamed for everything.
Let me be clear about what’s real, because I won’t build an argument on a false floor. Since 2019, the median listing price has jumped about 34% to roughly $430,000.3 The payment on a median home went from near $1,700 in early 2020 to about $3,100 by late 2025.4 Rates tripled off the 2021 lows. That shock was real, and it landed in five short years.
So the frustration makes sense. What doesn’t hold up is taking a recent, regional price spike and turning it into a permanent law of physics that applies to every zip code and every buyer. The honest version of home affordability today is narrower, more local, and far more fixable than the headline suggests.
But let’s start with the narrative that the Boomer generation had it easy. As one individual posted on X:
“You boomers had it easy, you could buy a home for the price of bread and a gallon of milk.”
Boomers Did Not Have It Easy
Here’s the part the narrative skips. The Boomer who bought in 1980 financed at a 30-year fixed rate of 13.74%, watched it climb past 18% by October 1981, and had no way to know rates would ever come back down, which made every payment feel like a life sentence.5 Think about that. For a median home price of $64,600 with 20% down, that household sent roughly 39% of its income to the mortgage before property taxes.6 Add the taxes, and the typical 1980 family spent close to 47% of their income on housing.
Today’s buyer, financing about $417,000 near 6.5%, spends closer to 32% on the mortgage and about 43% all in.6,14 Two independent analyses ran this exact math and landed in the same place. On the payment that matters, 1980 was as hard as, or harder than, 2026. So home affordability today is mostly a payment story, and the payment math favors the present. Notice what the work did. It isn’t the price of the home, it’s the rate.


The Crisis Is Regional, Not National
Now look at where the “home affordability” pain actually sits. A typical home in Iowa costs about 3.7 years of household income, near where the national buyer stood in 2000.7 Ohio, Indiana, Illinois, and Kansas still sell near or below $300,000. Among large metros, Chicago, Houston, Dallas, Atlanta, and Philadelphia rank among the most affordable in the country.7 Home affordability today is a function of your zip code first, your generation second.
The expensive markets are real, but they’re specific. And here’s the twist most coverage misses. The old escape hatch of moving somewhere cheap is closing, because Montana now costs 8.7 years of income, worse than California or New York.7 The same regional pattern shows up in who’s living at home. In New Jersey it’s 44% of young adults. In South Dakota, 18%.8 The map of “kids who can’t move out” is mostly a map of expensive states.

That “one in three” figure above also deserves a second look. It counts everyone ages 18 to 34, which includes college kids, 22-year-olds in their first job, and people who’ve always lived at home for a stretch. If you narrow that gap to a more realistic home ownership range, ages 25 to 34, the share drops to about 18%.9 And roughly 70% of those 25-to-34-year-olds at home are employed.2 So this “home affordability” story isn’t about a lazy generation or a broken job market. It’s a story about down payments, rent, and a marriage age that has drifted six years later since 1980.
Where The Skeptics Are Right
I won’t pretend that nothing has changed. Two things genuinely got harder, and waving them away would insult the reader. First, the down payment. In 1980, 20% down ran about two-thirds of a year’s income. Today it runs a full year or more, which is why the median first-time buyer now puts down just 9% to get in the door, and why the first-time buyer’s median age has climbed from 29 to roughly 40.10 That capital wall is a real barrier.
Second, insurance. Premiums jumped 24% from 2021 to 2024 to an average of $3,303, twice the rate of inflation, rising in 95% of zip codes.11 In Utah, insurance premiums rose 59%. That cost isn’t your fault, and it won’t be fixed by skipping lattes, but notice what both problems have in common. They’re specific and addressable, not a sentence handed down to an entire generation. The home affordability debate today has two honest exceptions, and naming them is what separates analysis from a comment-section rant.
Where They Aren’t
Here’s the irony buried in the down payment story. The 1980 buyer didn’t just face a 20% norm; they put down even more, averaging about 28%.10 To skip mortgage insurance on a conventional loan, you needed the full 20% in cash, no exceptions. There were no mainstream 3% conventional programs, no piggyback structures in wide use, no stack of state assistance grants to pull from. You saved the lump sum, or you stayed a renter.
Today, the menu is wide open. A first-time buyer can go conventional with as little as 3% down, FHA with 3.5% down, or zero down with a VA or USDA loan if eligible, and can cover even that with gift funds, a 401 (k) withdrawal, or a state assistance grant.15 The 20% rule is dead. The median first-time buyer actually put down 10% last year, not 20.16 Less down means PMI and a bigger payment, of course. But the belief that you need 20% in cash just to walk in the door is the single most expensive myth keeping renters stuck, and it hasn’t been true for decades.


The Playbook: Home Affordability Today Is on You
So what’s the move? Stop reading a national headline as a verdict on your situation. The buyer who treats “homeownership is dead” as gospel, while sitting in a market where a solid house costs three or four times income, talks himself out of a purchase he could actually make. Bob Farrell’s ninth rule fits here. When every expert and forecast agrees, something else usually happens.12 Sentiment just hit a record low. That’s historically when the patient buyer gets paid.
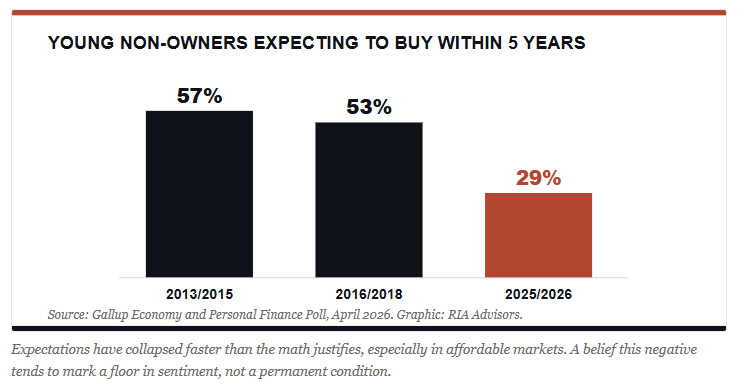
But mindset only gets you to the starting line. Here’s the part nobody wants to hear.
Working isn’t enough. Roughly 70% of the young adults living at home already have jobs, so a paycheck alone clearly doesn’t get you out of the basement.2 What gets you out is a set of decisions most people dodge because they sting. So let’s say them plainly.
- Run the number, then automate it. A 3.5% down payment on a $250,000 home is $8,750, about $730 a month for a year. If you can’t find $730, that’s a spending problem or an income problem, and both are yours. But here’s the part the pushback misses. The inability to save that money isn’t just a down payment problem. It’s a signal you can’t afford to own yet. The mortgage is only the floor. Property taxes, insurance that now averages $3,303 a year, the roughly 1% of a home’s value it consumes in annual upkeep, and HOA dues, if you have them, all add up to the monthly payment.11 Can’t bank $730 a month as a renter? You’ll drown in those carrying costs as an owner. The savings test isn’t the barrier. It’s the readiness check.
- Cut the big rocks, not the pebbles. The daily coffee isn’t what’s keeping you in your childhood bedroom, but the $650 truck payment, the $1,900 rent in a city you picked for the nightlife, and the lifestyle you finance to look successful on a phone screen absolutely are. Sell the financed truck. Get a roommate. Buy smaller, because the median new home is 38% larger than it was in 1980, making a 1,500-square-foot starter a choice rather than a hardship.13 Live below your means on purpose. Nobody is coming to subsidize your standard of living.
- Then move to the money. The good jobs and the cheap houses rarely sit in the same expensive zip code you grew up in. They sit in Columbus, Des Moines, Indianapolis, and Greenville, where a median income still buys a median home.7 Remote work made that move easier than it has ever been. If you won’t relocate for opportunity, fine, but then you’ve made unaffordability a choice, not a fate.
- Raise your income and your credit score at the same time. A side income of $1,000 a month is a full down payment in under a year. A credit jump from 580 to 620 can move you off a 3.5% FHA loan and onto a 3% conventional, saving you thousands up front and more over the life of the loan.15 And every year you stall has a price tag. The National Association of Realtors estimates that delaying a purchase from age 30 to 40 costs the typical buyer around $150,000 in lost equity.17
The market isn’t fair. It was never fair. The only question that matters is what you’re going to do about it.
The bottom line is this. Housing isn’t unaffordable everywhere, for everyone, forever. It’s expensive in specific places, for specific reasons, and most of all since 2020. The rest is geography, a savings problem, and a story people keep repeating until they believe it. After three decades of watching cycles, I’ve learned the worst financial decisions get made when people accept a narrative instead of running the numbers. Home affordability today is better than the Fed admits. Run your own numbers and see.
Sources
- Gallup Economy and Personal Finance Poll, April 2026. 67% of U.S. adults say it is a bad time to buy a home.
- Realtor.com analysis (Hannah Jones), 2025, via The Hill and TNND. A record 25.2 million adults under 35 living with parents; roughly 70% of those 25 to 34 are employed.
- Realtor.com, 2025 median list price near $430,000, up about 34% since 2019.
- Fox Business / Realtor.com, Q4 2025. Median home payment is near $3,100.That is up from about $1,700 in early 2020. Income needed climbed from roughly $66,000 to more than $120,000.
- Freddie Mac via Bankrate and Rocket Mortgage: 1980 30-year fixed averaged 13.74%, peaking above 18% in October 1981.
- Meredith Wealth and Landmark Wealth Management analyses of Census and FRED data. Mortgage as a share of income roughly 39% (1980) vs 32% (today); about 47% vs 43.5% all-in with property taxes.
- Best Interest Financial and Visual Capitalist. Using Realtor.com, Census ACS, and NAR data, 2025-26: Iowa 3.7x, U.S. national 5.08x, Montana 8.7x; metro affordability rankings.
- FinanceBuzz and Visual Capitalist, Census ACS 2024-25: New Jersey 44%, Connecticut 41%, South Dakota 18%.
- Pew Research Center, 2023: 18% of adults ages 25 to 34 live in a parent’s home.
- Landmark Wealth Management. 1980 average down payment ~28% vs ~9% median for first-time buyers today; first-time buyer median age 29 to about 40.
- Consumer Federation of America. “Overburdened,” April 2025: premiums up 24% (2021-2024) to an average of $3,303. Twice inflation, in 95% of zip codes; Utah +59%, Illinois +50%, Arizona +48%, Pennsylvania +44%.
- Bob Farrell’s 10 Rules, Rule #9: “When all the experts and forecasts agree, something else is going to happen.”
- U.S. Census Bureau / NAHB: median new single-family home 1,595 sq ft (1980) vs 2,205 sq ft (2024), a 38% increase.
- Freddie Mac Primary Mortgage Market Survey: 30-year fixed averaged about 6.49% for the week ending June 25, 2026.
- 2026 minimum down payments: conventional 3% (Fannie Mae HomeReady / Freddie Mac Home Possible, 620+ credit), FHA 3.5% (580+ credit; 10% for 500-579), VA, and USDA 0% for eligible buyers. PMI applies to conventional loans with less than 20% down (roughly $30 to $70 per month per $100,000 borrowed) and is canceled at 20% equity; an 80/10/10 piggyback avoids it. Sources: Bankrate, Rocket Mortgage, lender data, 2026.
- National Association of Realtors, 2025 Profile of Home Buyers and Sellers. Median first-time-buyer down payment of about 10%, the highest in nearly 40 years.
- The National Association of Realtors estimates. Delaying a home purchase from age 30 to 40 costs a typical buyer roughly $150,000 in lost equity.