
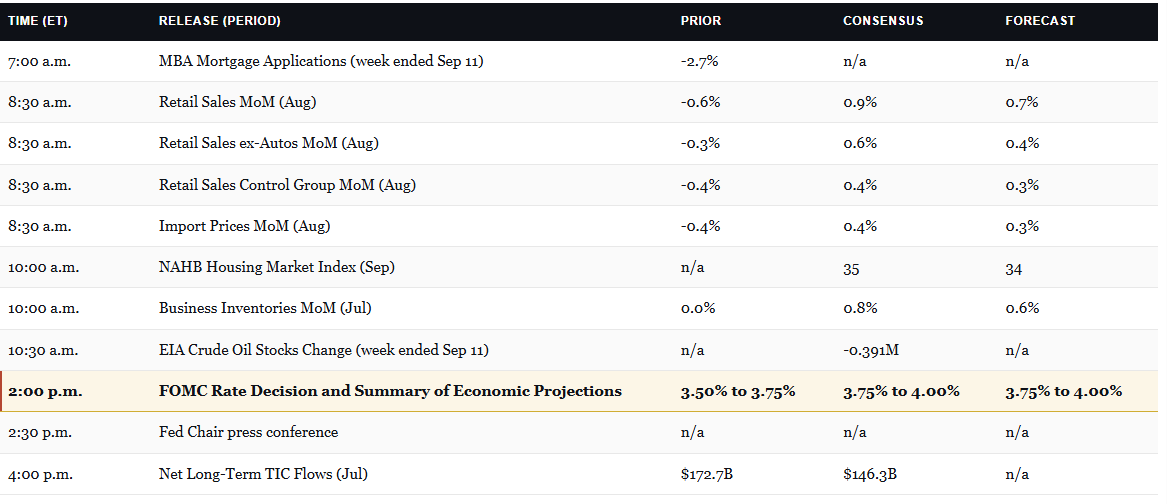
Our title, “Fed Hikes,” is a bit presumptuous, but with Fed Funds futures assigning a 90% chance of a hike this afternoon, it’s likely a done deal. Instead of debating whether the Fed hikes, the more useful question for investors is: what comes next? Three things from Wednesday’s FOMC meeting will likely put us in a better place to answer that.
Assuming the Fed releases its Summary of Economic Projections (SEP), aka dot plots, it will likely be the most important tell. Watch the median dots and outlying dots regarding 2026 projections on where Fed Funds will end the year. A tight cluster of dots signals conviction among the members, whereas a wide spread signals division. With only 2 meetings left, we suspect the median will be near one more hike, assuming they raise rates today.
Second, watch the FOMC statement’s balance of risk language. If the inflation tone softens, today’s expected hike could be a single defensive move rather than the start of a series of Fed hikes. Further, increased concerns about labor conditions could warrant caution from the Fed.
Third, listen for how Warsh frames the decision in his press conference. Instead of saying “one and done” or “the first of several,” we suspect he will say future policy decisions will be predicated on incoming economic data.
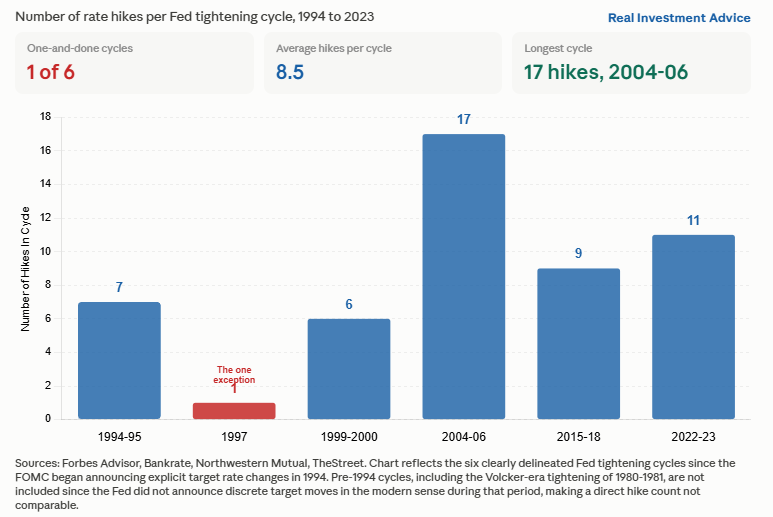
Since 1994, the Fed has conducted six hiking cycles, as we share below. Five of them ran for years and included six hikes or more. The exception is March 1997, when Greenspan hiked once, and then cut in 1998. Every other modern cycle kept going well beyond the first move. Despite history, given that real rates are starting from an historically high point, we suspect the number of hikes in this cycle will be limited.
What To Watch Today
Earnings

Economy
Market Trading Update
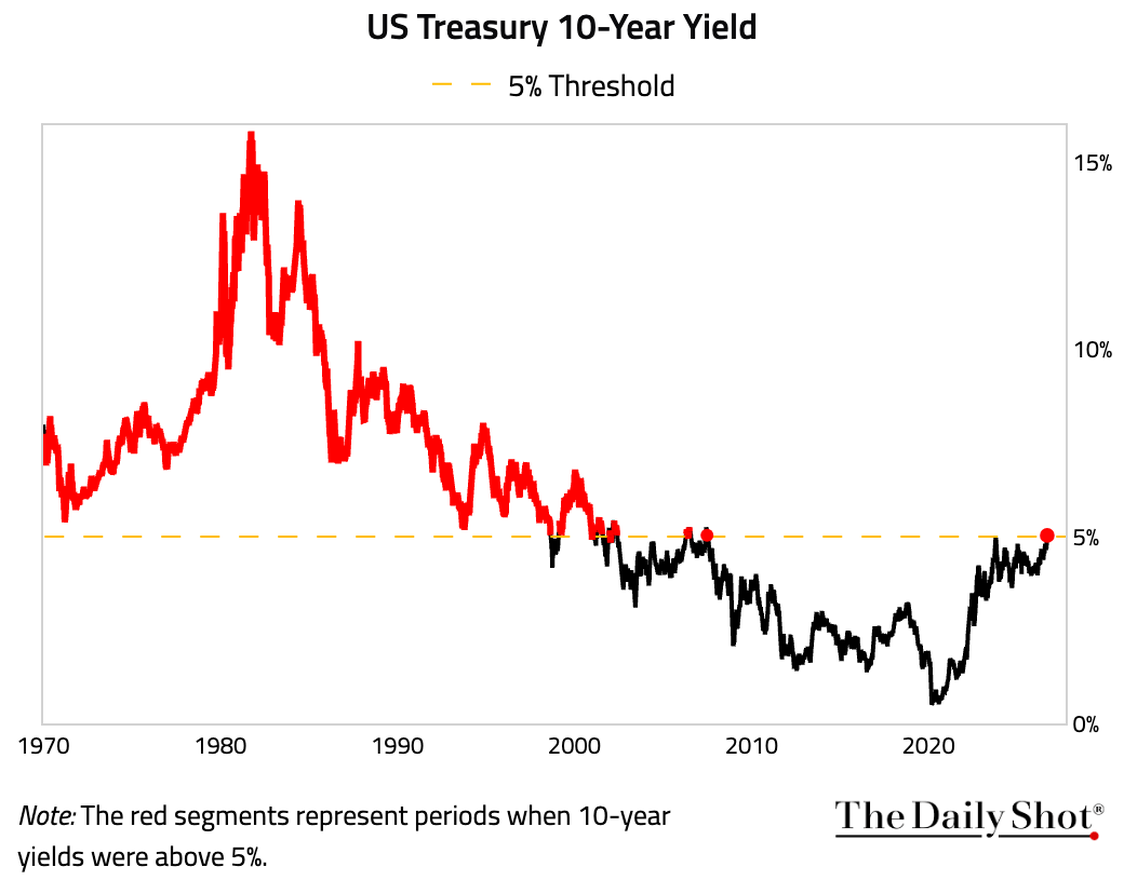
Yesterday, we worked through whether the AI capex backlog actually bends when the frontier labs start talking about slowing down. Today the tape handed us a cleaner question about rising yields and equity returns. The 10-year Treasury pushed through 5% on Monday and traded at 5.01% Tuesday morning, the highest level since July 2007.
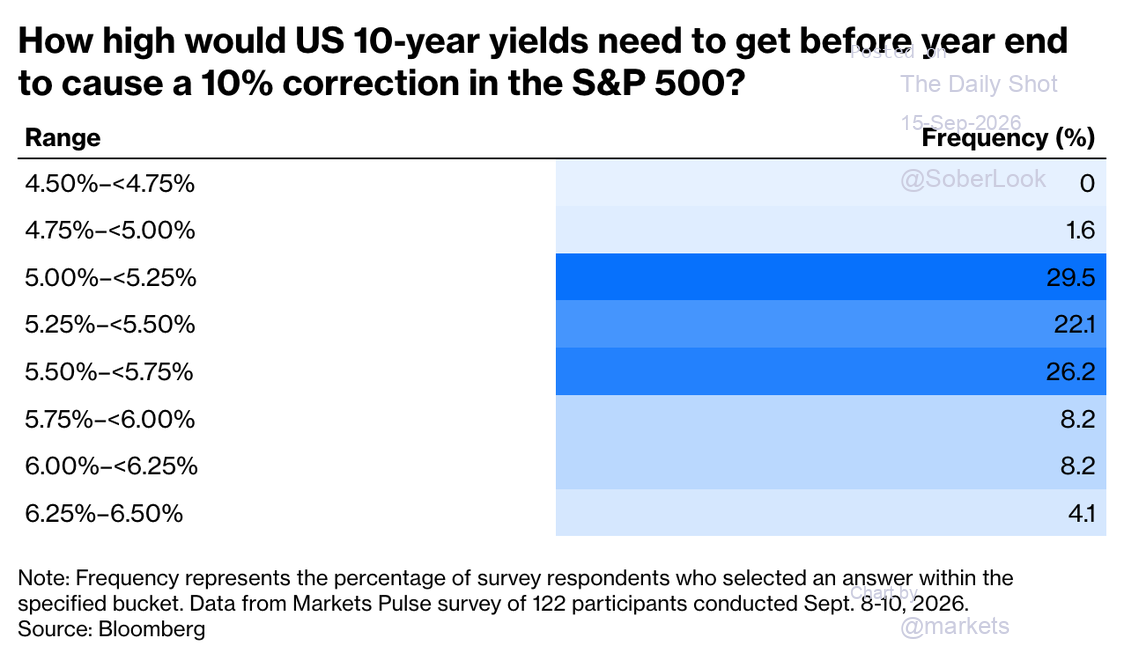
That number matters because Wall Street told us it would. Bloomberg’s Markets Pulse survey of 122 participants, conducted September 8th through the 10th, asked how high yields would need to go before year-end to trigger a 10% correction. Nearly 78% put the answer between 5.00% and 5.75%. Just 1.6% thought anything below 5% would do it.
Here’s what the consensus misses. Rising yields did punish stocks, but mostly in the first half of the sample. The relationship broke down right around the time the 10-year fell under 5% and stayed there. So the line everyone is watching marks where the modern data set begins, not where equities break. Such is the trouble with threshold thinking. It mistakes a historical coincidence for a law of markets.
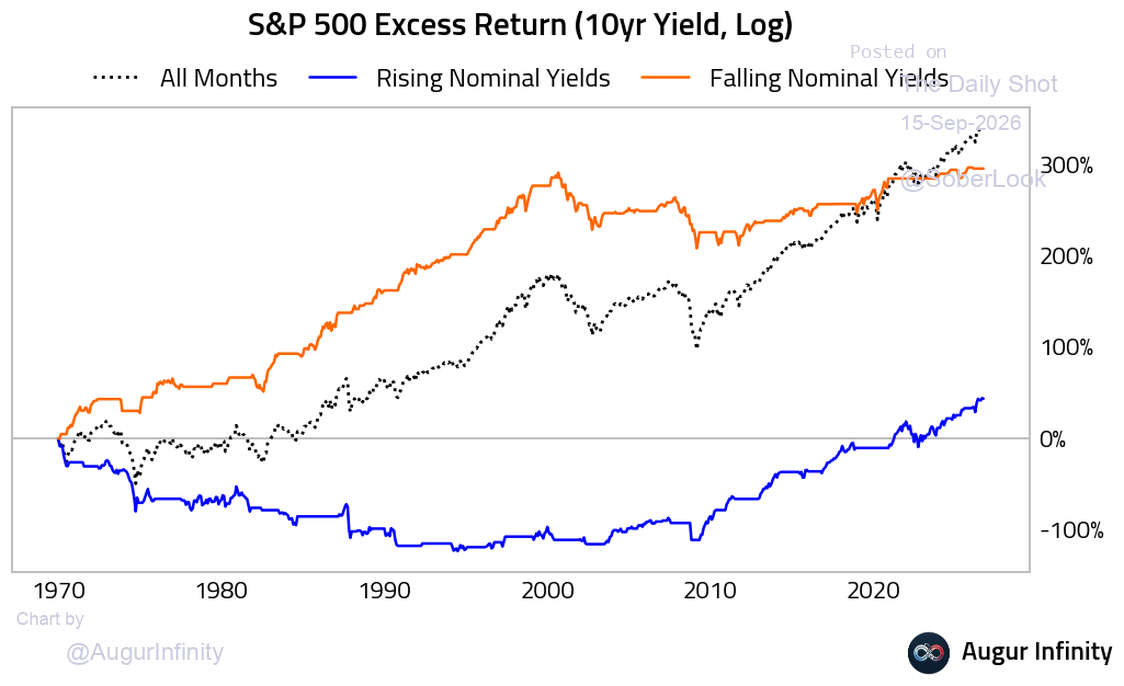
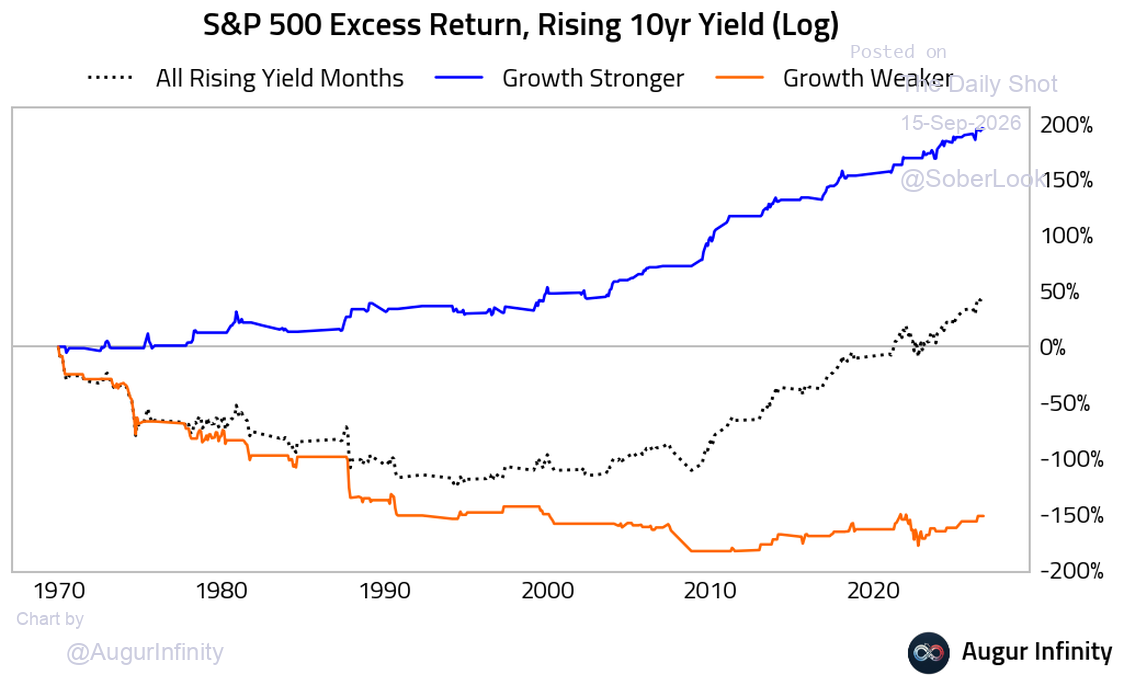
The real variable isn’t the rate. Its growth. Split the rising-yield months by whether growth was strengthening or weakening, and the outcomes separate violently. Stronger growth with rising yields delivered a large positive excess return over cash. Weaker growth with rising yields delivered a deeply negative one. Same rates. Opposite results.
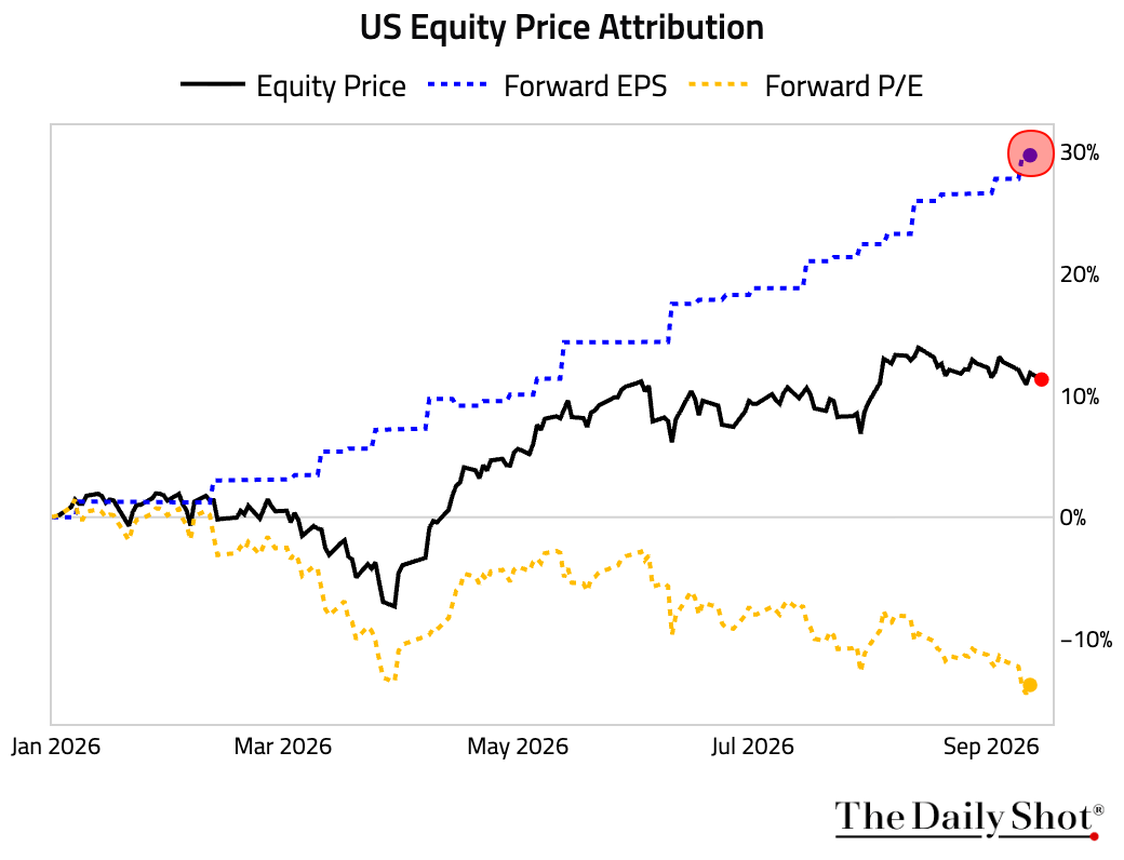
The multiple has already paid its toll. Forward earnings are up roughly 30% this year while the forward P/E compressed about 13.5%, from north of 23 down near 19. The index is up 11.6% year to date on EARNINGS, not on multiple expansion. The bond bears will tell me the deficit makes this cycle different. Maybe. But the de-rating they keep forecasting has largely already happened.
The sector tape mostly confirms the map. Since the 10-year bottomed at 3.97% on February 27th, energy has run 15.4% against the index’s 10.9%, while utilities lost 12.4% and staples 6.2%. Financials only matched the market, so the rate trade isn’t as clean as the textbook says.
The S&P closed below its 50-day moving average near 7,606 yesterday. That line is the trade into Wednesday’s Fed decision. If it holds, this stays a repricing. If markets fall further, the next add point is the 200-day near 7,163, not before.
Watch the growth data, not the yield print. Rates don’t end bull markets. Recessions do.

This Is Not 2022
With Fed hikes on the table, we hear some pundits harkening back to the last tightening cycle, which started in 2022. The setup then and now is nothing alike.
In 2022, the Fed was grossly offside. Inflation ran near 9%, and the real 10-year yield was negative when hikes began. The Fed was running extremely accommodative policy despite surging prices. They ultimately hiked 11 times in sixteen months, the most aggressive tightening since the 1980s. The bond market repriced violently because the Fed started so far behind the curve.
Today’s starting point is the opposite. The real 10-year real yield sits near 2.50%, the highest level in almost twenty years, and the yield curve has flattened meaningfully, both signals that financial conditions are already restrictive. This isn’t the Fed playing catch-up; it’s the Fed worried about its inflation-fighting credibility, much of which dates back to 2020-2022, when it botched monetary policy.
The inflation level and its drivers today versus 2022 are also vastly different. Today’s price pressures trace largely to the Iran conflict, oil, energy, and related goods. We are in a geopolitical supply shock, not the 2022 broad demand-supply mismatch born of pandemic stimulus and broken global supply chains. Geopolitical shocks reverse quickly once the underlying conflict de-escalates. Supply-demand mismatches take much longer.
Investors bracing for a prolonged 2022-like hiking cycle are fighting the last war.


Tweet of the Day

New UPDATED Trading Rules With Desktop Printout
“Want to achieve better long-term success in managing your portfolio? Here are our 15-trading rules for managing market risks.”
Please subscribe to the daily commentary to receive these updates every morning before the opening bell.
If you found this blog useful, please send it to someone else, share it on social media, or contact us to set up a meeting.