

James Thorne of Wellington Altus tweeted an important graph and commentary worth reviewing. The US 3-2-1 crack spread, which approximates what a refiner earns by turning three barrels of crude into two barrels of gasoline and one barrel of distillates, has fallen 36% in six weeks, from $65.56 on October 9 to $41.90 on November 17. As he puts it, “the glut has moved downstream.”
The evidence supports his view. Fat profit margins enticed refiners to run at maximum capacity and boost their profits as much as possible. As one would think, with falling crack spreads, gasoline and diesel prices are falling faster than crude as supply rises rapidly. AAA shows the national gasoline price average near $3.75, down roughly 13% in a month, and the gasoline ETF UGA has dropped about 21% month to date. Gasoline futures have fallen about 45% over the last two months from $3.63 on September 24 to its current level of $2.50. Because retail pump prices lag wholesale/futures by weeks, the AAA pump price should fall further.
Over the last four decades, the 3-2-1 spread averages roughly $12 a barrel with a median near $8. On an EIA spot basis, it averaged $68 in September, the richest month since 2006, and even after the sharp drop to the low $40s, it remains well above average. In other words, spreads have plenty of room to decline as refiners still have the financial incentive to produce as much gasoline and diesel as possible.
Gasoline remains more than a dollar above year-ago levels, so annual price comparisons will likely remain inflationary until spring. However, the Fed Funds futures markets are pricing roughly 75 basis points of further tightening. Hiking into falling energy prices looks to us like the Fed is fighting yesterday’s war.


Market Trading Update
Yesterday, we compared Nvidia’s earnings risk to the “safety” premium investors pay for Walmart. Today, I want to return to the Santa Claus rally we discussed in Tuesday’s commentary, but from a different angle. The question isn’t whether it shows up. It’s WHEN.
Goldman’s flow desk made a sharp point this week. Two-month seasonal averages are too blunt for this tape. Their S&P 500 path, going back to 1928, shows a Thanksgiving ramp, a stall in early December, and a second-leg higher. Read off their chart, roughly 80% of the average gain arrives after December 14. We ran the same test on S&P 500 total returns since 2003, and the shape holds.

The sequence makes sense once you look at who is trading. Retail buying and corporate buybacks typically carry stocks into early December. Then the plumbing gets in the way. Many mutual funds set capital gains distribution record dates around the second week of December, and some taxable investors sell ahead of them to dodge the bill. Tax-loss selling peaks. Goldman expects the buyback window to close around December 13, the Fed meets December 8 and 9, and December 18 brings quarterly options expiration. Once that pile-up clears, managers dress up their books for year-end reporting, and the Santa Claus rally gets its second wind.

Here’s where it gets interesting. Since 2010, the December 5 to 14 window has lost 0.27% on average and finished higher in only 7 of 16 years. In most years, it’s a pause. In 2011, 2014, 2015, and 2018, it was a 3%-3.6% hit.
Goldman’s base rates for years like this one, when the VIX starts mid-November at 18 or higher, deserve respect. The median drawdown inside the window was 3%, and the year-end gain averaged just 1.34%. With the S&P 500 closing Wednesday near 7,318, about 6% below its October 6 record, we’re already living part of that script.
We should not dismiss that hedge funds and CTAs are very underweight technology stocks, which does provide a potential tailwind. However, there is always the risk that they choose to remain sidelined through year-end.
Here is how to play the next few weeks.
- First, don’t chase the Thanksgiving pop. If the ramp shows up, use strength into early December to trim winners back to target weight and rebuild cash.
- Secondly, put that cash to work into mid-December weakness, ahead of the stretch that historically does the heavy lifting.
That’s the playbook in our Equity Conservative Growth and Equity Aggressive Growth models. The calendar rewards patience, not urgency. Such is the nature of seasonal trading.
Santa usually shows up, but if you lose too much before then, the gift of Christmas doesn’t really matter.

Fed Worries About AI Financing Web
The October FOMC minutes, released yesterday, contain a passage worth focusing on. Per the minutes, most participants “observed that AI-related debt had grown rapidly,” and much of that growth “had taken place through complex and opaque financing structures.”
A few participants noted that AI exposures were “becoming increasingly concentrated among a small number of firms.” They also flagged off-balance-sheet leasing commitments and circular financing among AI firms as potential loss amplifiers.
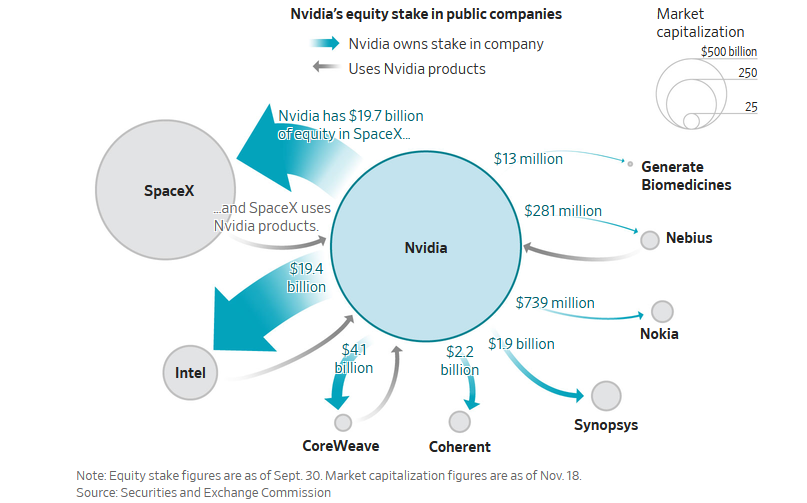
We wrote about this last week in Nvidia Circular Financing: Who Is At Risk?, where we traced the guarantees, residual value support, and off-balance-sheet lease backstops that Nvidia was providing to support the AI buildout and, in turn, chip purchases. Our conclusion was that the companies most at risk were those like CoreWeave, with high interest rates and seemingly losing access to the capital markets. The Fed agrees.
Here is why this mention in the minutes is important. The Fed does not casually put a sector’s financing structure into its minutes. Describing AI debt as opaque and concentrated moves it from market chatter to a documented financial stability concern, and that may be the first step toward supervisory attention.
The tension between Fed policy and the AI debt is worth appreciating. In the minutes, almost all participants judged that “further action to raise the target range” would “likely be appropriate,” and two members suggested, “an increase of more than 25 basis points could warrant consideration at the next meeting.” The Fed is now identifying a leveraged, opaque, and concentrated credit structure while preparing to raise its cost of funding. We will watch credit spreads, not equity prices, for any potential fallout. The graphic below is courtesy of The Wall Street Journal.

Tweet of the Day

Trading Rules With Desktop Printout
“Want to achieve better long-term success in managing your portfolio? Here are our 15-trading rules for managing market risks.”
Please subscribe to the daily commentary to receive these updates every morning before the opening bell.
If you found this blog useful, please send it to someone else, share it on social media, or contact us to set up a meeting.