

Today we discuss another angle on the fallout from Nvidia CEO Jensen Huang’s resignation, focusing on companies that could be negatively impacted by the leadership change. Nvidia has provided significant debt and equity financing to purchasers of its chips, enabling larger data center buildouts. We must now ask if financing under an interim CEO, former CFO Colette Kress, will become more conservative. If she slows the check writing, new risks sit with borrowers who used Nvidia’s balance sheet as credit support, and with the suppliers Nvidia was quietly funding.
Nvidia was not simply investing in customers. Bloomberg reported it had disclosed over $540 billion of financing arrangements this year. In August, it proposed a $500 billion chip securitization program in which it would provide residual value support covering up to a quarter of the deal. That is credit enhancement, not venture capital.
CoreWeave is one of the most impacted companies. Nvidia carries a $6.3 billion backstop running through April 2032, obligating it to purchase unsold capacity. CoreWeave has $24.9 billion of debt and negative free cash flow of about $4.7 billion last quarter. Its bonds yield about 16% and its credit default swaps trade near 1300 basis points. The situation leaves the credit markets anxious about Nvidia backing away from new financing agreements.
The overlooked exposure also impacts their suppliers. Nvidia invested roughly $2 billion each in Marvell, Synopsys, Coherent and Lumentum, and up to $3.2 billion in Corning. Think of these arrangements as vendor financing in reverse, paying your suppliers to build the capacity you intend to buy. Optical components and design software are not sub-industries investors associate with Nvidia’s balance sheet, but they should be.
The warning we share is conditional, as there is a lot the public may not know, for better or worse. Nvidia has announced no policy changes so far, but Tuesday’s earnings call may be revealing.

What To Watch Today
Earnings

Economy
Market Trading Update
The S&P 500 finished last week at 7,561.67, up 2.5% and 3.3% below the October 6 record close of 7,818.93. Monday’s 2.35% gain did most of the work, reversing the prior week’s breakdown in a single session. After that, the rally ran out of buyers. Thursday’s high of 7,653 stopped just short of the 50-day moving average at 7,667. The index then slipped in each of the last two sessions.
While the price action was more bullish, the moving averages tell a split story. The market index currently sits 3.0% above a rising 200-day average at 7,340. This leaves the primary uptrend intact. However, it remains below both the 20-day mean of 7,613 and the 50-day mean of 7,667. More notably, the 50-day has also started to roll over, down from 7,679 a week ago.
Beyond the moving averages, RSI rebounded from 33.5 at the November 5 low to 47, a neutral level with no directional momentum. Furthermore, the MACD remains below its signal line, at −42 versus −41 index points. Nonetheless, the gap has narrowed sharply from a week ago. If the MACD can manage a crossover early next week, it would flip the market momentum signal back to a buy.
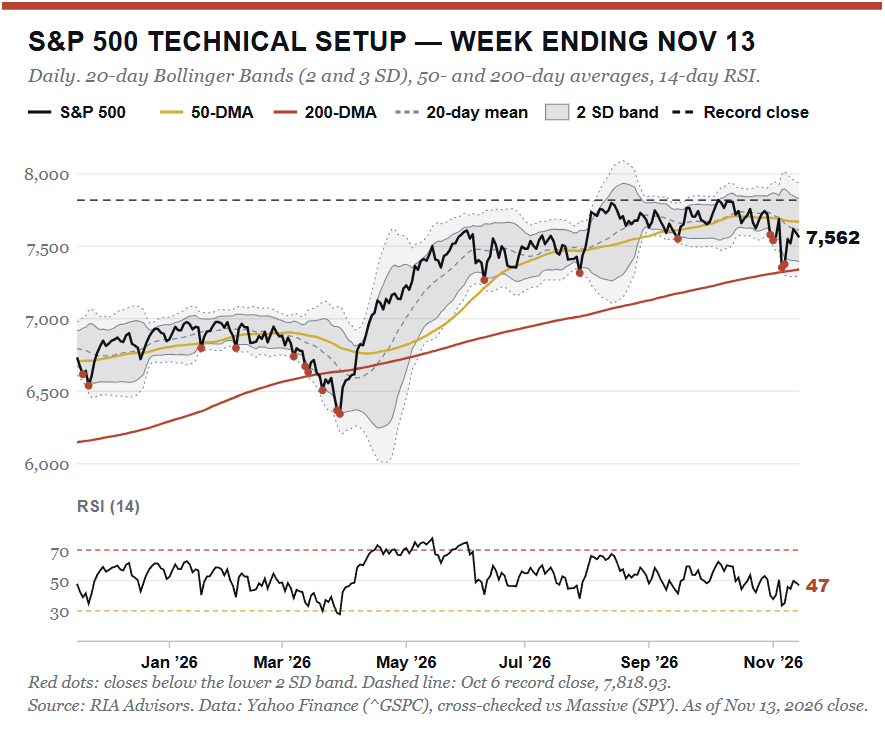
Notice the cluster of red dots at the right edge of the chart above. Four of six sessions from October 30 to November 6 closed below the lower 2 SD band. That’s the densest cluster since March. The index has since climbed back to roughly half a standard deviation below its 20-day mean. The lower band now sits at 7,396. That’s the level where a retest would look washed out again.
Sector breadth is the strongest evidence this week, and it cuts both ways. Measured against each sector’s 50-day relative trend versus the S&P 500, 10 of 11 sectors are outperforming. Six are more than 5% above trend. Health Care (+9.3%) and Staples (+9.2%) are the most stretched. The equal-weight S&P 500 (RSP) is also 4.2% above its relative trend. That is real “broadening.” The catch is that the only oversold groups, Technology at −7.8% and semiconductors at −11.8%, represent the biggest single block of market value in the index, so the rest of the market can outperform for weeks without lifting the S&P 500 to a new high.

The bullish case making the rounds is simple. If 10 of 11 sectors are beating the index, the market must be healthy. It is, below the surface. But a cap-weighted index can’t make a new high while its largest sector sits 8% below trend. Either technology catches up to the market, or the market comes down to meet technology. Such is why Tuesday’s Nvidia report matters for the whole tape, not just for one stock.
For shorter-term traders, the investing playbook for this week is fairly straightforward. If the market can close above the 50-day at 7,667, it would reopen the path to the record at 7,819. For now, Initial support is Friday’s low near 7,500, but below that, the 200-day average and the November 5 low converge at 7,340 to 7,350.
Most crucially, a close below July’s swing low at 7,316 would break the pattern of higher lows. Such a break would argue for raising cash and adding hedges to portfolios. For now, until the index reclaims the 50-day, we continue to recommend trimming extended defensive positions as strength develops. We are looking to add to growth stocks but only in measured tranches with confirmation, not on a bounce that has already stalled once.

In summation, the single level to watch this coming week is the 50-day moving average at 7,667. The index failed there on Thursday, raising our caution level. A second failure after Nvidia reports would turn a healthy pullback into a range-bound year-end.

The Week Ahead & PPI
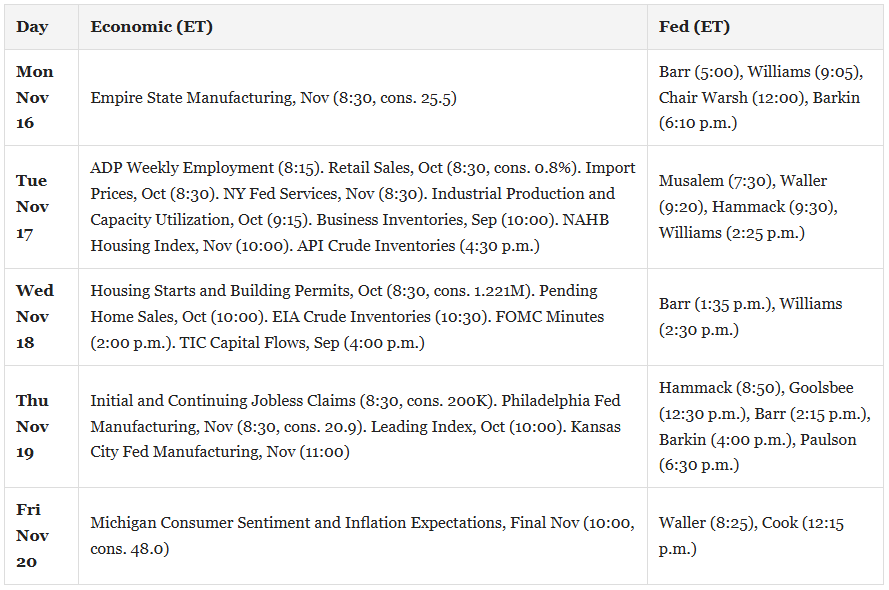
The economic calendar is consumer-focused, with October Retail Sales on Tuesday. Wednesday delivers housing starts and building permits, along with a $13 billion 20-year Treasury auction. Thursday has jobless claims, the Philadelphia Fed survey and the leading index. Friday closes with the final University of Michigan survey and its one- and five-year inflation expectations, which carry more weight than usual given the Fed may hike rates at its next meeting. Wednesday’s FOMC minutes will likely point to a rate hike on December 9th.
Earnings turn to the consumer. Home Depot and Disney report Tuesday; Lowe’s, Target, and TJX on Wednesday; and Walmart Thursday. Taken with Tuesday’s retail sales, we should get a good read on consumer health. Maybe most important, Nvidia reports Tuesday after the close.
October producer prices (PPI) rose 0.3%, a tenth below consensus, but the annual rate climbed to 6.5%, the highest since November 2022. We would not take much comfort in the headline, because the composition changed. September’s 1.4% jump was more than 80% energy. In October, energy fell 0.1%, while goods excluding food and energy rose 0.5% and accounted for over 60% of the monthly advance. The narrow core, which also excludes trade services, rose 0.5% versus a 0.3% forecast. Producer inflation for October was not an energy story, making it harder for the Fed to look through.
Recession Indicators Turned Green: Job Quality Hasn’t
Here is the puzzle investors face right now. S&P 500 companies are on track to report 31.4% earnings growth for the third quarter, the eighth straight quarter of double-digit gains. Last Friday, the October jobs report beat every forecast, with payrolls up 165,000 and unemployment back down to 4.1%. On the surface, the recession indicators have turned green. Beneath the surface, the quality of the jobs tells a different story. Such is the question worth answering: is the labor market healing, or are companies still “hoarding” labor while profits do the heavy lifting?
Why The Recession Indicators Disagree
Let’s start with the economic indicators that say all is well. In the most recent reports:
- Initial jobless claims fell to 189,000 in the week ended October 31, the lowest reading since 1969.
- The Job Openings and Labor Turnover Survey (JOLTS), which printed a layoff rate of 1.0% in September, near the floor of its 25-year history
- The October payrolls rose 165,000 against a consensus near 65,000, and revisions added 84,000 jobs to August and September.
In other words, if your only recession indicators are layoffs, claims, and the headline payroll count, there is no recession anywhere in sight.


Tweet of the Day

Trading Rules With Desktop Printout
“Want to achieve better long-term success in managing your portfolio? Here are our 15-trading rules for managing market risks.”
Please subscribe to the daily commentary to receive these updates every morning before the opening bell.
If you found this blog useful, please send it to someone else, share it on social media, or contact us to set up a meeting.