
Bitcoin peaked a year ago, hitting an all-time high of $126,210 in October 2025, and has since fallen more than 50%, bottoming near $58,000 two months ago. The tide may be turning; over the last week, Bitcoin rose by over 20%, marking its sharpest bounce during this year-long drawdown. The question is whether that marks the start of a leg higher or it’s a dead cat bounce within a bear market.
The optimistic bullish case rests on deleveraging and the Treasury’s actions to manage yields. Many crypto pundits believe that leverage used by Bitcoin investors last summer was massive. While it pushed Bitcoin’s price up substantially, it also left the price vulnerable to deleveraging. These pundits believe leverage has since normalized, which might ease pressure on Bitcoin. Second, the recent Treasury buyback announcements lead some to question the dollar and US Treasury bonds as safe havens. Thus, alternative currencies like gold and Bitcoin may be gaining value for some.
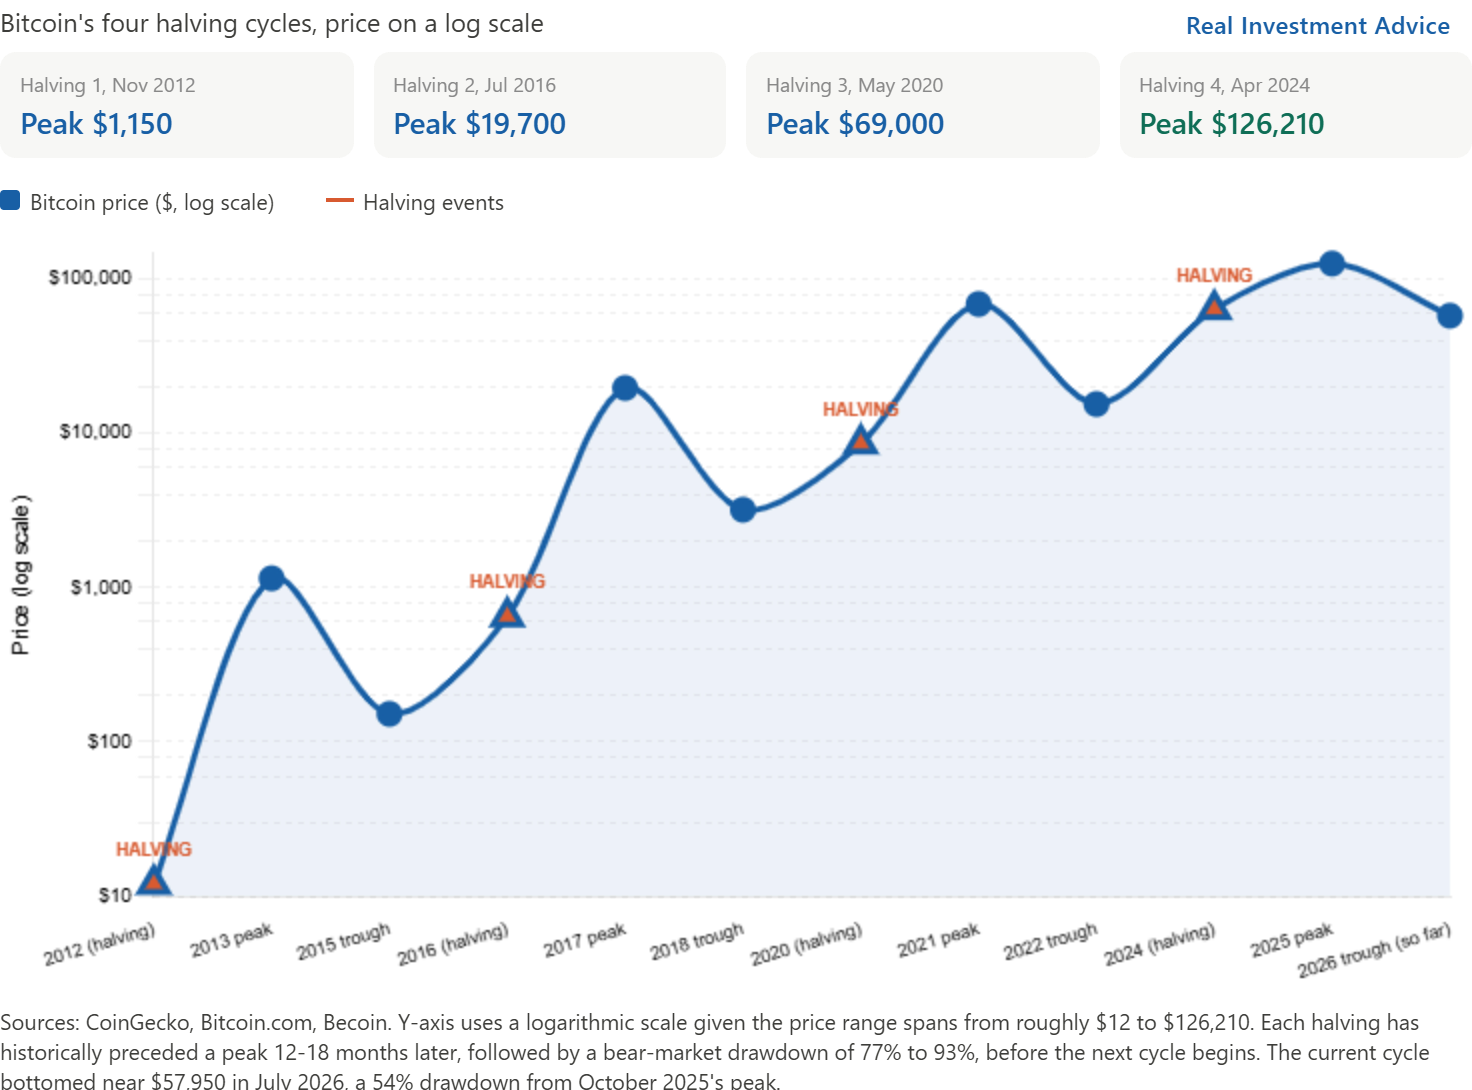
The bear case is more mechanical. Bitcoin’s four-year halving cycle (mining rewards are cut in half every four years) has historically driven boom-bust cycles, including drawdowns ranging from 75% to over 90% leading into significant rallies.
One strong week doesn’t undo a year-long drawdown, and Bitcoin’s history is full of head-fake rallies. But assuming it follows the four-year cycle pattern of the past, Bitcoin might be starting to rise into the April 2028 projected halving with a peak projected in early 2029.
What To Watch Today
Earnings
Economy
Fed Speakers
The Jackson Hole Economic Symposium opens today (Aug. 27–29). No marquee address on the tape yet: Chair Kevin Warsh delivers his first Jackson Hole keynote as Fed Chair tomorrow, Friday, Aug. 28, around 10:00 a.m. ET. The Fed is not in its pre-FOMC blackout (next meeting Sept. 16).
Market Trading Update
Yesterday, Michael Lebowitz used the Gilligan’s Island framework to explain why productivity, not spending, ultimately drives growth and returns (read it here). Today I want to shift from that long-run engine to the near-term calendar, because September is upon us and midterm election seasonality has a story worth hearing.
Start with the tape. The S&P 500 closed Tuesday at 7,677.28, roughly 1.8% below the August 13 record high of 7,816.70. Momentum has cooled off an overbought push, and the VIX still sits near 15.8. The index is up about 13% on the year. In other words, the wobble so far is mild. The real question is what the calendar says happens next.
September has a history of earning its reputation of being a month to avoid. Since 1950, it’s been the worst month for stocks, and the only one with a reliably negative average return, roughly -0.7%. It finishes higher just 44% of the time (LPL, Investing.com). Layer on the four-year cycle, and it sharpens. As the chart below shows, the midterm year is the weakest seat in the cycle, up around 4.5% on average and positive in barely half the cases. The pre-election year that follows has been the strongest by a wide margin, up roughly 16%.
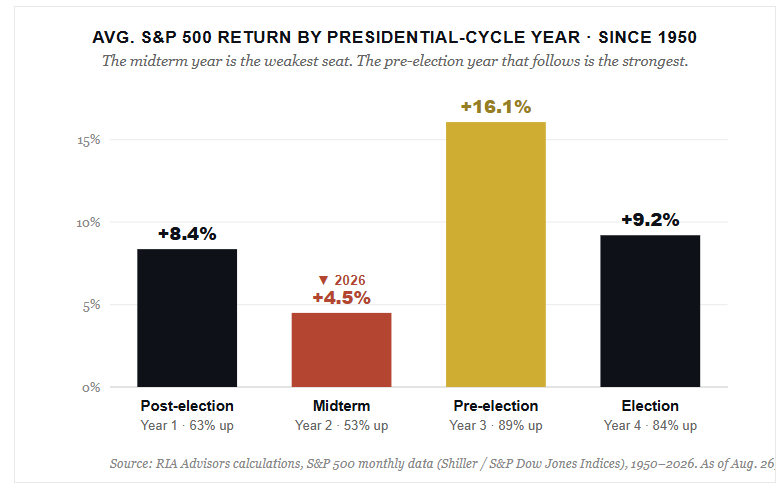
Here’s the part that matters for how you potentially manage portfolio risk. The midterm cycle period has been the most reliable “buy-the-fear” window of the entire cycle. As investors approach the actual election, market returns are muted, and drawdowns tend to be deeper. Fidelity pegs the average midterm drawdown near 19%, and this year’s worst pullback was only 9%, back in March. Bottoms cluster in the August-to-October window, with October the dominant low. That is when the tape actually turns.
The scoreboard below is close to perfect. The S&P has been higher one year after every midterm since 1950, up around 15% on average. It has been positive 95% of the time since 1938.

So far, the current setup doesn’t match the classic script precisely. The market is moving down heading into September; true, but it remains within a stone’s throw of records, with rich valuations, heavy AI concentration, and a 30-year yield near 5.3%. Averages describe nineteen cycles, not this one. The base rate rewards buying the dip, NOT chasing the high. As Howard Marks likes to say, you can’t predict, but you can prepare.
So that’s what we’re doing. In the latest Bull Bear Report, our money-flow breadth model hit an extreme overbought level, so we trimmed the most stretched positions back toward target weight and lifted the cash buffer. We’re not selling the bull. We’re keeping dry powder for the weakness in September and October that the calendar is flagging. We also remain ready to add to a pullback rather than reach for strength here.

PCE Prices Confirm The Cooling Trend
Yesterday’s PCE report largely confirmed the disinflation story. Headline PCE prices rose 0.2% in July, putting the annual rate at 3.7%, just 0.1 percentage point above consensus, and core PCE rose 0.2% as well, holding at 3.3% annually, in line with expectations. Both readings align with the cooling CPI and PPI trends we have seen over the last two months.
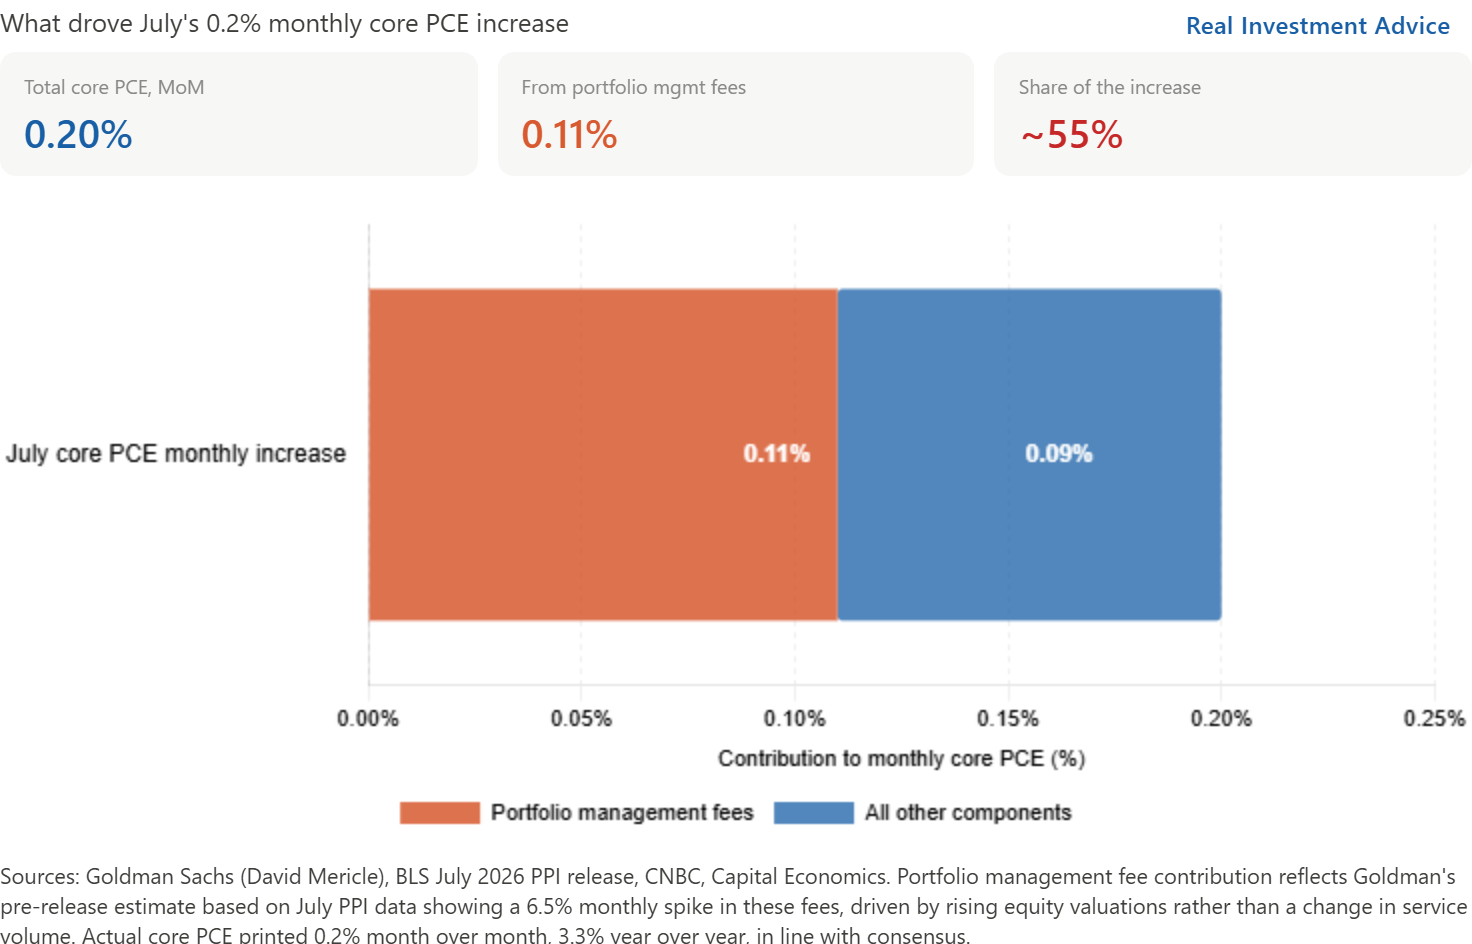
One detail in the PCE report is worth highlighting. Slightly over half of that 0.2% core increase came from a single line item, portfolio management fees, not from broader goods or services inflation. Portfolio management fees are directly correlated with rising stock prices, not any real change in the service provided. The BEA has acknowledged this measurement quirk and plans to fix it in a methodology overhaul at the end of September.
PCE personal income rose 0.4%, and spending rose 0.2%, both slightly above forecasts. Bear in mind that with 0.2% inflation, PCE spending is flat in real terms.
The more interesting question is what this data does to the September hike debate. Several FOMC members have supported a hike this year, but that case has rested heavily on inflation running hot enough to require it. With CPI, PPI, and now PCE all cooling and July’s payroll report showing an outright decline, the inflation half of that argument is getting harder to sustain while the employment market is starting to make a case for a rate cut.
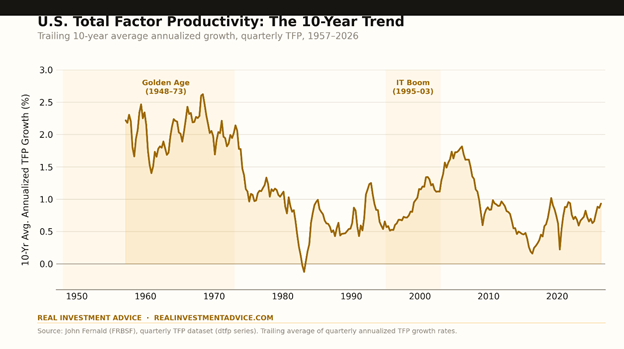
Productivity On Gilligan’s Island: Episode 2
Over 7 years ago, we wrote a piece using the 1960s TV sitcom Gilligan’s Island to provide a simple example of why productivity is the most important driver of economic growth. In this article, we present the next episode of Gilligan’s Island, describing what happens after the benefits of innovation no longer drive economic growth.
Right now, the US and global economies are in a period of transition between two innovation eras: the IT boom’s productivity tailwind is largely spent, and AI’s potential is budding. Nobody knows when, or how large, the AI payoff will ultimately be.
While no one has the answers as to what AI has in store for the economy, we can help you appreciate why productivity and innovation are vital for economic growth and ultimately investment returns.

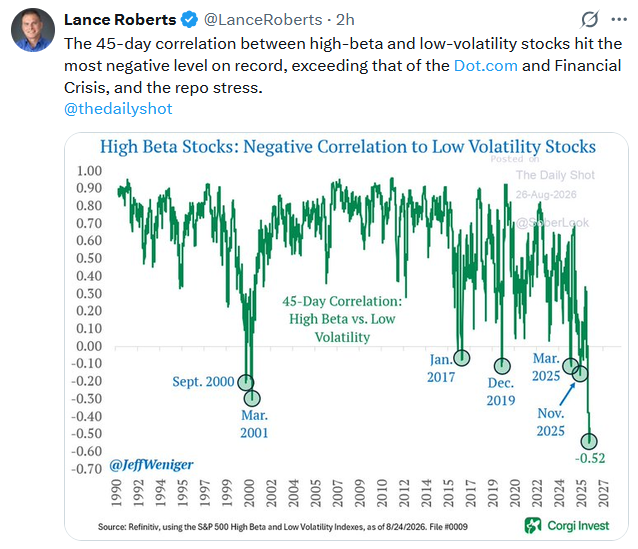
Tweet of the Day
New UPDATED Trading Rules With Desktop Printout
“Want to achieve better long-term success in managing your portfolio? Here are our 15-trading rules for managing market risks.”
Please subscribe to the daily commentary to receive these updates every morning before the opening bell.
If you found this blog useful, please send it to someone else, share it on social media, or contact us to set up a meeting.