
🔎 At a Glance
- AI Narrative Risk: The Hyperscaler Story Changes Again
- Market Brief & Technical Review
- From Lance’s Desk: Sound Money: Be Careful What You Wish For – RIA
- Market stats, screens, and risk indicators
🏛️ Market Brief – Weak Jobs Data Fuels Rally
The week the labor market cracked was the week stocks had their best run since April. Friday’s close of 7,757.64 on the S&P 500 set a record, up 3.6% over five sessions. The Nasdaq Composite gained 5.2% to 26,690.62, and the Dow added roughly 3% to 54,036.93. Small caps kept pace, with the Russell 2000 proxy up 3.6%. That is two straight weekly gains, and it is the first close above 7,700 in the index’s history, and it arrived in the very week that delivered the worst payroll print in years, which is the kind of contradiction that usually resolves badly for whoever assumes it simply continues.
In July, the economy shed 23,000 jobs against expectations of a gain of nearly 83,000. The unemployment rate then fell to 4.1% rather than holding at 4.2%. Don’t overlook those two numbers; read them together, and you get the real story. Unemployment did not drop because hiring improved. It dropped because the labor force shrank again. Participation slipped to 61.4%, down 0.7 percentage points this year, as roughly 1.4 million people simply left.
Interestingly, the markets did not care about the mechanism, but rather about the fact that a September rate hike was taken off the table. That matters more than it sounds. The Fed held on July 29 by a 9-3 vote, with Hammack, Kashkari, and Logan all dissenting in favor of an increase. It was the most divided decision since 2016. On Thursday, a rebound in crude prompted desks to openly debate an autumn move; however, by Friday morning, that debate was over. Futures still carry a hike in 2026, though not before December.
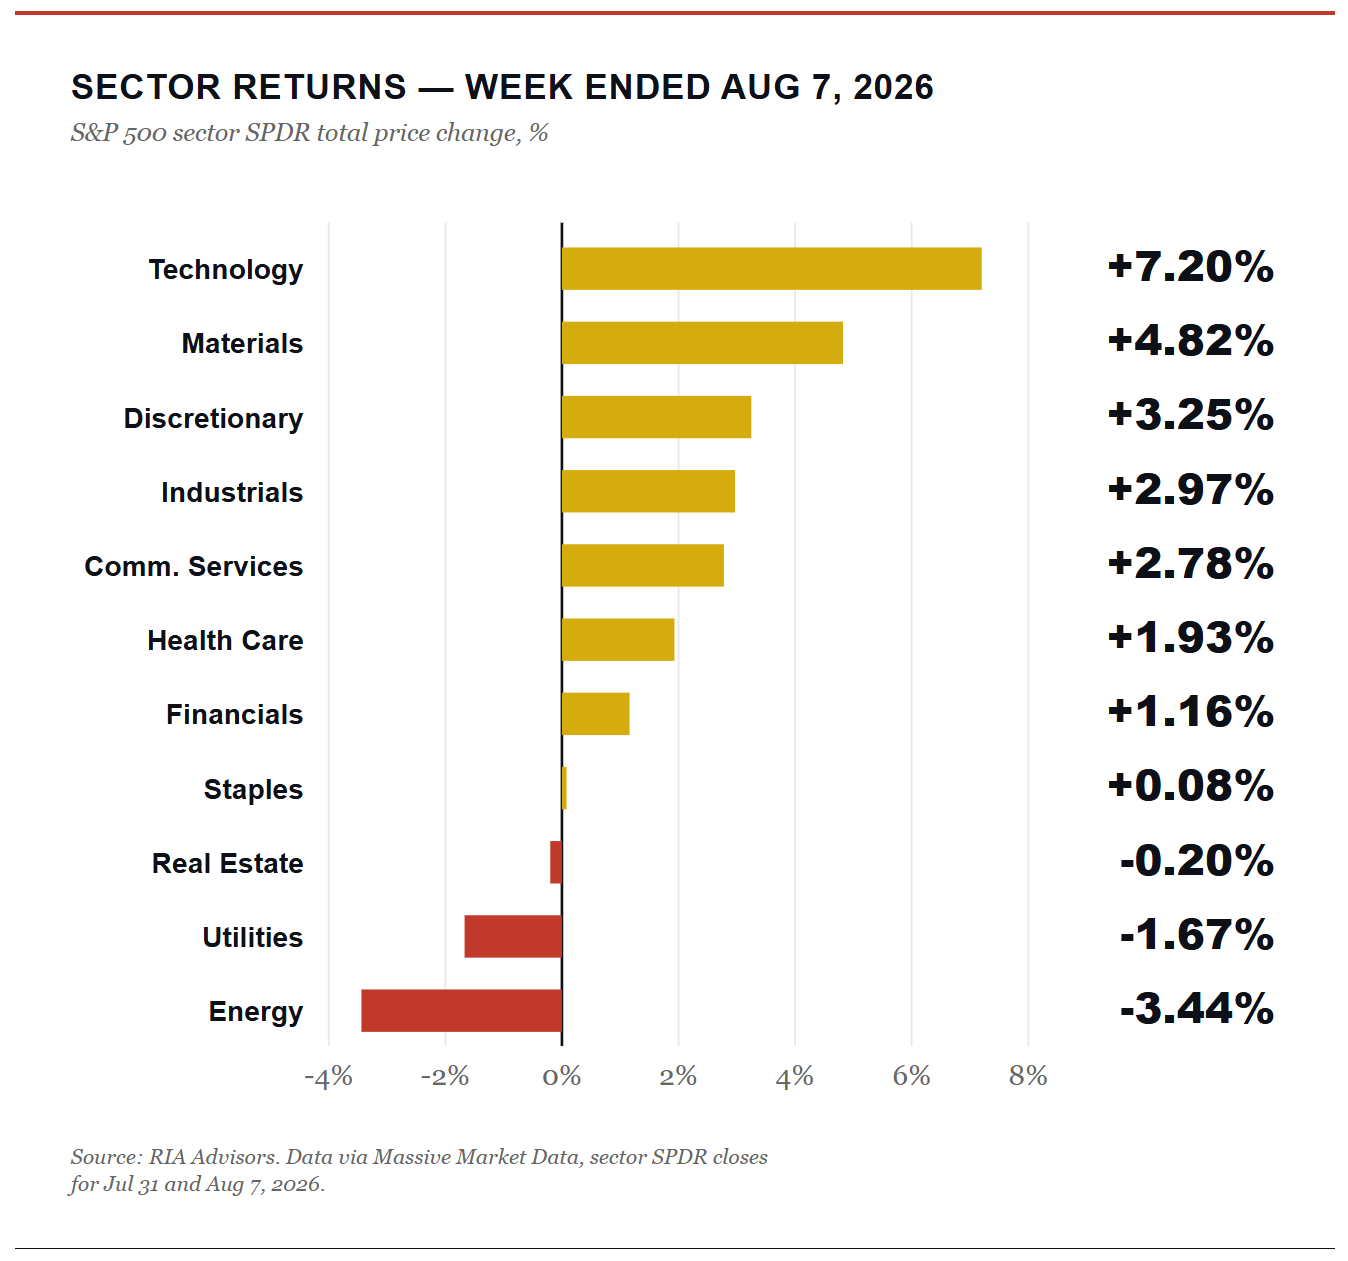
Leadership was narrow and violent, with Technology gaining 7.2%. Semiconductors did even better, with the iShares and VanEck chip funds up 7.6% and 7.8%, a full reversal of the memory-led damage from the prior month. Energy fell 3.4% as crude dropped nearly 9% on renewed Iran diplomacy. Utilities lost 1.7%. Gold was the quiet standout at 7.3%, running on the same rate-cut arithmetic that lifted equities. The dollar slipped, and volatility collapsed.
One caution worth carrying into the week. The cap-weighted index beat its equal-weighted twin by about 115 basis points, so the same handful of names is doing the lifting again. Watch the macro thread: the softening labor market is bullish only as long as inflation cooperates, and Wednesday’s CPI is the first real test of whether that condition still holds.
📈Technical Backdrop – Breakout Confirmed, Momentum Extended
The S&P 500 finished at 7,757.64, up 3.6% on the week and at a record close. The index sits 3.5% above its 50-day moving average near 7,488 and 10.0% above a rising 200-day average near 7,045. RSI(14) closed at 66.0, which is firm but still shy of the 70 overbought threshold. MACD remains above its signal line with the histogram widening to +3.3.

What happened here matters more than the level, and I want to reiterate an analysis from this past week because of its importance.
From early June, the market did not fall, but went sideways. This is crucial to understand because an overbought tape corrects one of two ways. It can either drop in price or work off the excess over time. This current cycle chose time. Eight weeks of chop reset momentum without breaking the trend. Tuesday’s record close at 7,736.52 confirmed buyers had finally absorbed the overhead supply. Friday extended it on the jobs print, and volume confirmed the move rather than contradicting it. That is what separates a real breakout from a squeeze.
So the obvious question is whether you chase a market at record highs. History argues against the fear. Going back a decade, we count eleven prior cases where the S&P broke to a new high after at least two months without one.

The downside is what surprises people. The worst 12-month outcome in that group was a 2.8% dip, compared with a 21% drawdown for the worst year following a random day since 2016. Carson Group’s work dates back to 1957, and it lands in the same place: stocks are higher a year after a new high roughly 71% of the time. New highs beget new highs FAR more often than they ring the bell at the top.
None of that even remotely suggests abandoning discipline. We are extended, and the markets are not cheap. The index runs 10% above its 200-day average into a historically soft August-to-October window, and breadth is thinning again. In our equity models, we are staying long the trend and holding cash for the pullback that eventually arrives. If you are trying to add money into the markets, do that on weakness toward the 50-day, not on strength into round numbers.
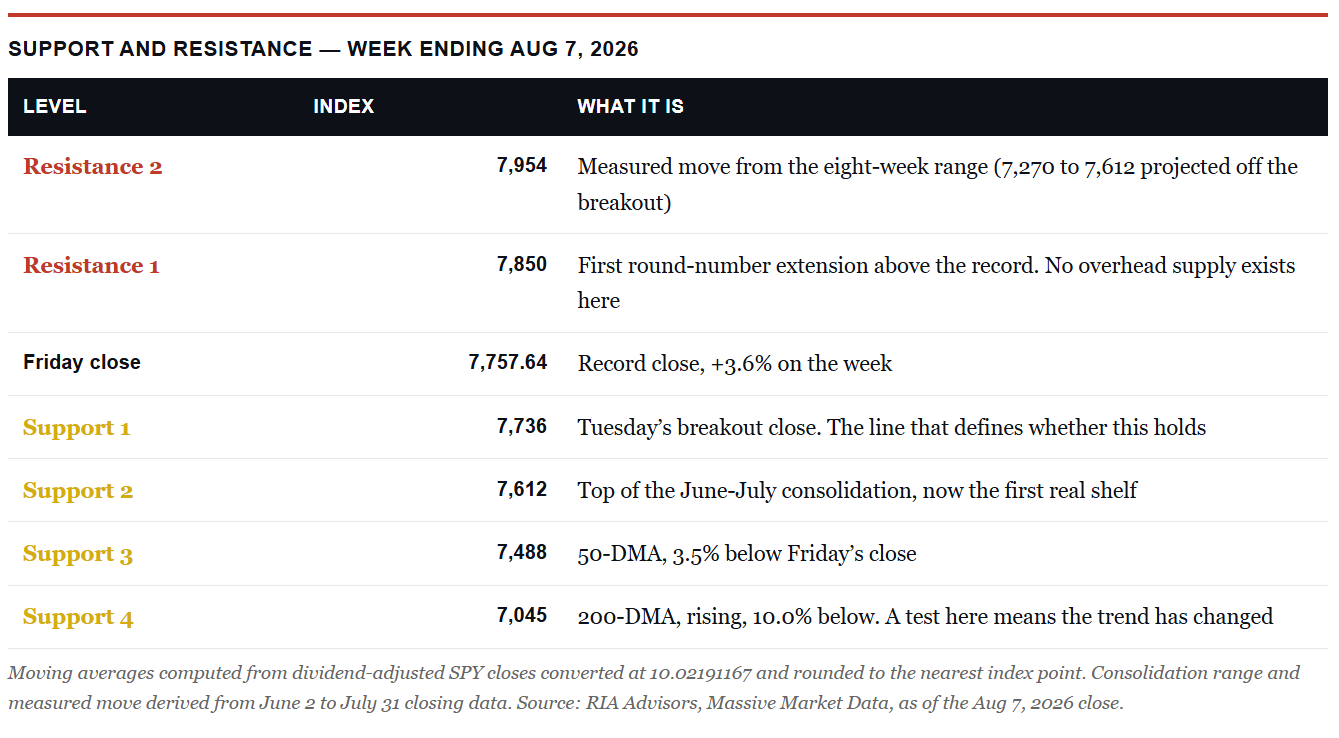
The level that matters is 7,736.52. That was Tuesday’s breakout close, and a decisive move back below it would turn this from a confirmed breakout into a failed one, which is the single scenario that would change how we are positioned. Ride the trend. Keep your stops honest.
🔑 Key Catalysts Next Week
Two questions dominate the week, and the second only matters because of the first. July CPI lands on Wednesday, and it arrives amid a visibly deteriorating labor market. That combination is the whole ballgame for the markets. If the print is cool, the Fed sits still and validates the rally that Friday’s payroll miss set off. A hot one revives the three dissenters who wanted a July hike and forces the market to price in stagflation rather than a soft landing.
However, it isn’t the headline print that matters; it’s the core reading. Headline CPI will move with energy, and crude just fell nearly 9%. That flatters the print for reasons unrelated to underlying price pressure. Shelter and services are where the signal lives, and the signal is in the core reading.
PPI follows on Thursday, and retail sales on Friday. They answer whether consumers are still spending as employment shrinks. Again, instead of the headline numbers, watch the control group, which feeds into GDP. Weekly claims on Thursday now carry more weight than usual. A second soft labor reading inside the same week would harden the case that July was a trend rather than a stumble.
Two other threads remain unresolved, with the Strait of Hormuz still at issue. Thursday night brought reports of explosions tied to Iranian interceptions. The oil move that helped equities this week can reverse on one headline. The FOMC minutes land the following Wednesday, and after a 9-3 split, they will be read closely for how close the hawks came to winning.

Earnings thin out to the AI supply chain. Cisco reports after the close midweek, the tape’s bellwether for AI networking, where we will be watching for margin compression rather than demand. Applied Materials reports on Thursday after the close and is the more consequential print because it is where hyperscaler capital spending ultimately lands. The China revenue mix is the cleanest read available on export-control drag. CoreWeave reports early in the week, and after a 40% drawdown, it is the sharpest live test of whether the neocloud backlog actually converts.

Need Help With Your Investing Strategy?
Are you looking for comprehensive financial, insurance, and estate planning services? Need a risk-managed portfolio management strategy to grow and protect your savings? Whatever your needs are, we are here to help.

💰 AI Narrative Risk: The Cost Of Trading The Story
Two weeks ago, in The AI Capex Bill Comes Due, we closed the week at 7,411.98 with an AI capex scare and an oil shock against us. Last week, we asked whether the momentum crash was over. On Tuesday, the S&P 500 closed at 7,736.52, its first finish above 7,700. This morning, July payrolls printed at -23,000, against expectations of +83,000. Almost nothing about the underlying businesses changed across those sessions. However, the AI narrative story changed twice. That gap is the subject of this piece because “AI narrative risk” has cost investors more this year than being wrong about AI ever did.
Let’s dig into it.
Four Obituaries And Not One Funeral
First, let’s start with the overall pattern, because it is the most useful thing here. Over the last roughly eighteen months, the market has written the AI narrative’s trade obituary four separate times. Each obituary was intelligent and written by serious people who argued with one another with real evidence, from a widely cited MIT study to a $1.1 billion options position. Each one produced a violent repricing inside the AI complex that never became a market event.
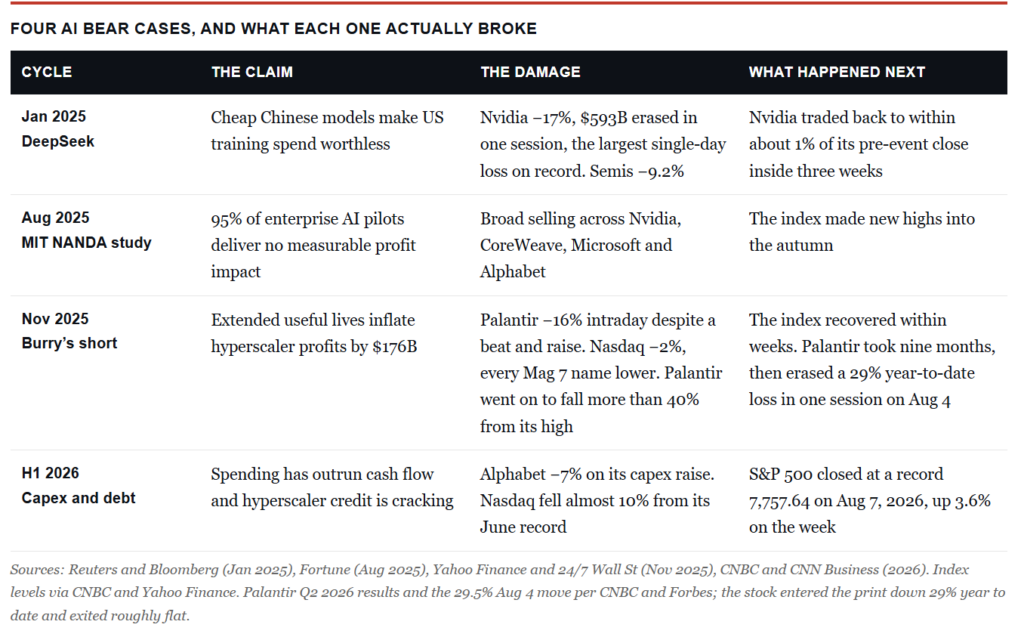
Look at the pattern rather than any single row. Each time, the claim changes, whether it was the models are too cheap to justify the chips, to an enterprise that would never pay, to fake accounting, to stretched balance sheets. However, the shape never changes. Something inside the complex gets destroyed, and the index goes on to make new highs.
Retail Bought The Story And Sold The Stocks
Here is what turns this from an intellectual exercise into a P&L problem. Scott Rubner’s team at Citadel Securities tracks retail order flow, and their July data is the cleanest illustration of narrative risk I have seen this cycle.

Read those rows together. Separately, they look like a sentimental story, and together they describe the single most expensive mistake available to an investor this year, which is being right about a theme and wrong about which part of it you own. Through May and June, retail aggressively accumulated semiconductor and memory names on the narrative that the infrastructure layer captured the value. In the final week of July, they sold those same names at more than five times the previous record. Days later, the hyperscalers rose between 4.6% and 6%, and the index closed at a record.
They were not wrong about AI, but they were wrong about WHERE twice, and the second mistake landed at the point of maximum discouragement. That is what a narrative does to a portfolio. It tells you what to own without telling you what you are paid to own it.
This past week supplied the epilogue. SanDisk and Western Digital both reported beat-and-raise quarters on Wednesday night. Then on Thursday, SanDisk fell more than 6%, and Western Digital dropped 13%. Coming in, the two were up roughly 469% and 201% on the year. AppLovin lost nearly 20% on mixed results. The point here is that when a stock falls on a beat, the price is carrying the story, not the numbers.
What Was Knowable All Along
The frustrating part is that the July bear case was checkable while it was being made. The claim was that spending had decoupled from demand. So do the arithmetic. Microsoft’s commercial remaining performance obligation reached $678 billion. Alphabet’s cloud backlog reached $514 billion. Amazon’s reached $496 billion. That is $1.688 trillion of contracted revenue against roughly $725 billion of 2026 capital spending across the four largest hyperscalers.

The contracted book is 2.3 times the spending it must justify, and the duration is short. Microsoft disclosed a weighted average duration of 2.3 years, with the slice converting inside twelve months growing 37% year over year. Alphabet expects to recognize just over half of its backlog within 24 months. None of this required a forecast, just a reading of the disclosures instead of the headlines.
Andy Jassy told analysts that “the demand we already have for 2028 is striking.” The return question was equally testable. Here is the point. In theory, if AI workloads carried structurally worse economics, a rising AI mix would compress cloud margins. In reality, it did the opposite.

Where The Profit Actually Lands
So, here is where this whole AI narrative matters. The question we need to be asking, and understanding, is where the profit in an AI dollar actually ends up.
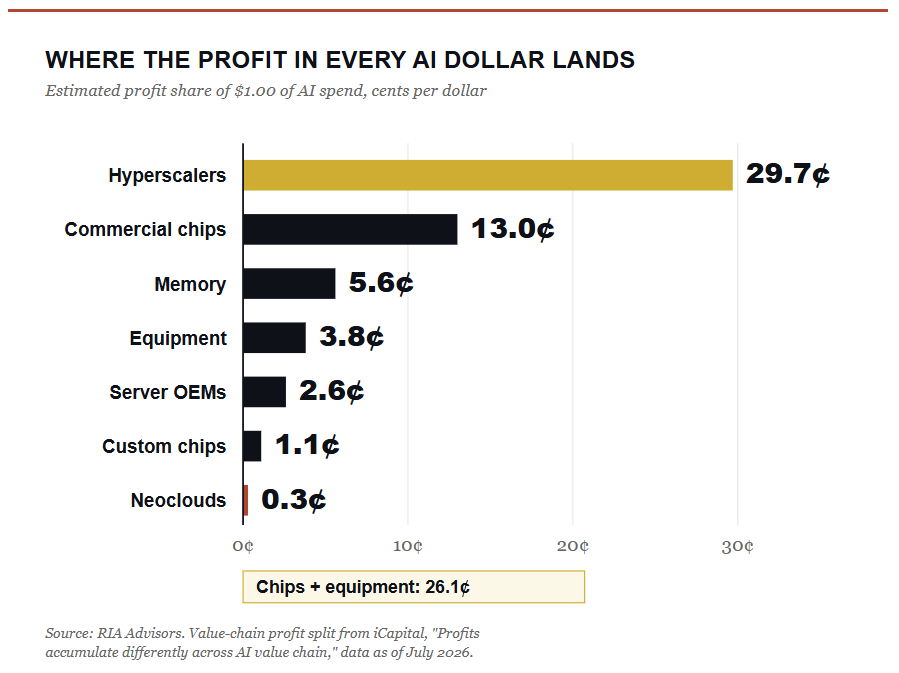
Pay very close attention to the chart above. Currently, the hyperscalers keep 29.7 cents of every dollar spent on AI. Conversely, the entire chip and equipment complex retains 26.1 cents in combined revenue, while the neoclouds retain only 0.3 cents.
That split has been roughly stable through all four narrative cycles, which is precisely what makes it useful. Through Tuesday, Micron was up nearly 700% over twelve months while Meta was down 25% and Microsoft 6%. Think about that, for the last eighteen months, the market bid up the 26 cents and discounted the 30 cents.
The Next Narrative Is Already Forming
Before you run out and do anything, let’s analyze both sides of the debate. Everything above supports a conclusion that is rapidly becoming the new consensus; however, the “AI capex ROI is proven, own the hyperscalers” is also a narrative. If you look at our core portfolio, you will see that it also reflects the narrative we think is correct. At least for now. However, it is also the fifth story in eighteen months, and the previous four all felt obvious on the day they peaked. So we are watching this very closely.

While we are cautious, we are aware that the setup has genuinely improved. Citadel’s read is that:
- Positioning has normalized,
- Fundamentals matter again,
- Leverage has unwound, and
- Funding spreads are near 50 basis points over SOFR, down from a peak of 138 basis points.
We agree with that analysis, particularly, Information Technology now trades near 20x forward earnings, close to the first percentile of its one-year range and below its 23x ten-year average.
“July did not change the structural bull market. It reset it.” – Scott Rubner, Citadel Securities Global Market Intelligence, Aug 3, 2026
Again, we agree with the mechanics, but we should add the following part. The same $1.5 trillion in semiconductor market value that came out can go back in, and 411 companies have now reported, with 87% beating, up from 82% a year ago. If semis re-accelerate, then “hyperscalers over chips” becomes the crowded trade, and the next reset takes whoever arrives late.
Bob Farrell’s Rule #9 exists for exactly this moment. When all the experts and forecasts agree, something else will happen.
What Should Investors Do Now
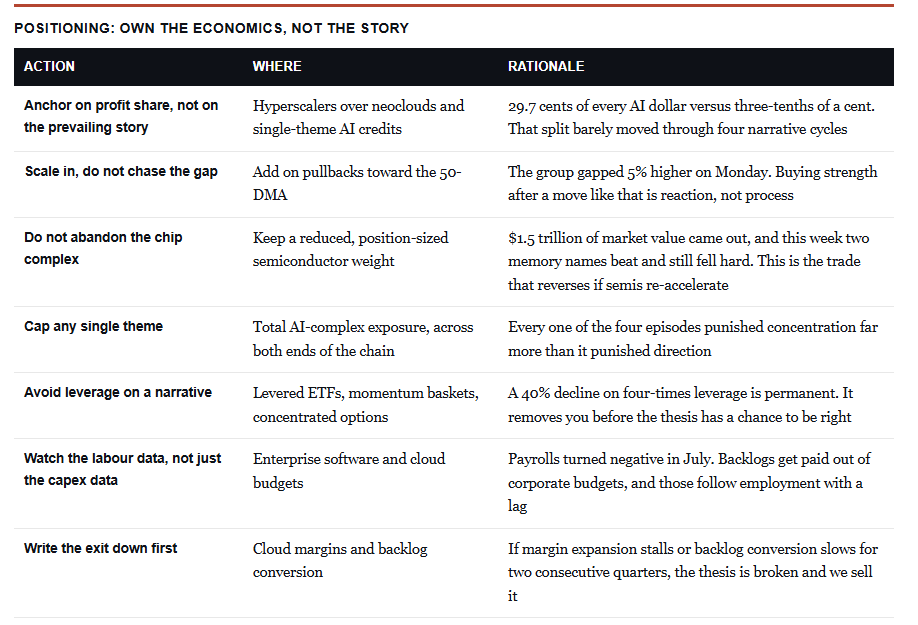
So what do you do with this? The answer is not to guess which story wins next. Everyone who tried that got whipsawed at least once, and the ones who used leverage are gone. Michael Lebowitz made the credit version of this point last week. Strip out Oracle, and the other four hyperscalers’ spreads have sat at or below the AA index since the start of 2025. The “carnage” applied one company’s story to four balance sheets that never shared it.
Three risks deserve naming.
- Memory costs are still climbing, which is what moved Amazon’s capex guide from roughly $200 billion to $220 billion. That pressure eventually reaches margins.
- Regulation is second, and underpriced. New York State has already imposed a moratorium on data-center construction, enough for Baird to cut Caterpillar to Hold in late July. Land and power were supposed to be the flexible part of the plan.
- The third is the labor market. A negative payroll print, with unemployment falling to 4.1%, signals a shrinking workforce, not a hiring boom, and ADP reported only 44,000 private jobs on Wednesday.
Cheaper money helps long-duration assets. However, a workforce that stops growing eventually reaches enterprise software budgets, and that is where much of the $1.688 trillion backlog is paid. Jamie Dimon warned on Wednesday that “margin debt is the highest it has ever been,” much of it carried under other names. FactSet shows incremental debt rising from 9% of capex in fiscal 2024 to 32% over the trailing year.
As portfolio managers, our job is to manage the risk of being wrong, and as such, our confidence is calibrated rather than absolute. Over the next 12-months, I think the profit-share argument wins. However, over 12 weeks, anything can happen, given that August through October is the weakest seasonal stretch of the year, breadth is thin, and this complex has repriced violently four times with no warning.
For now, we own the part of the chain where the cash lands, sized so no single story can hurt us. It is crucial to remember that narratives are free to change, and they change often. Your portfolio, however, is not.
🖊️ From Lance’s Desk
This week’s #MacroView blog explores that while everyone wants the discipline of gold, almost no one has done the math on what getting it would actually cost.

Also Posted This Week:
- Hidden Debt: Is Our Hyperscaler Thesis Wrong – Part 2 – RIA – by Michael Lebowitz
- Bonds In Your Portfolio: Why Ditching Them Is The Wrong Move – RIA – by Lance Roberts
📹 Watch & Listen
The S&P 500 has broken out to fresh all-time highs after months of consolidation, triggering a new momentum buy signal. But after one of the strongest five-day rallies since April 2025, should investors keep buying or start taking profits?
Subscribe To Our YouTube Channel To Get Notified Of All Our Videos
📊 Market Statistics & Analysis
Weekly technical overview across key sectors, risk indicators, and market internals

💸 Market & Sector X-Ray: Market Gains Ground
The market action this week vindicated the bulls, with the market hitting all-time highs. As we have noted previously, the out-of-favor Mag 7 stocks led the charge with momentum stocks lagging, and Energy faded as new hopes of an Iran resolution emerged. The market is now up over 13% YTD, with Technology up more than 30%
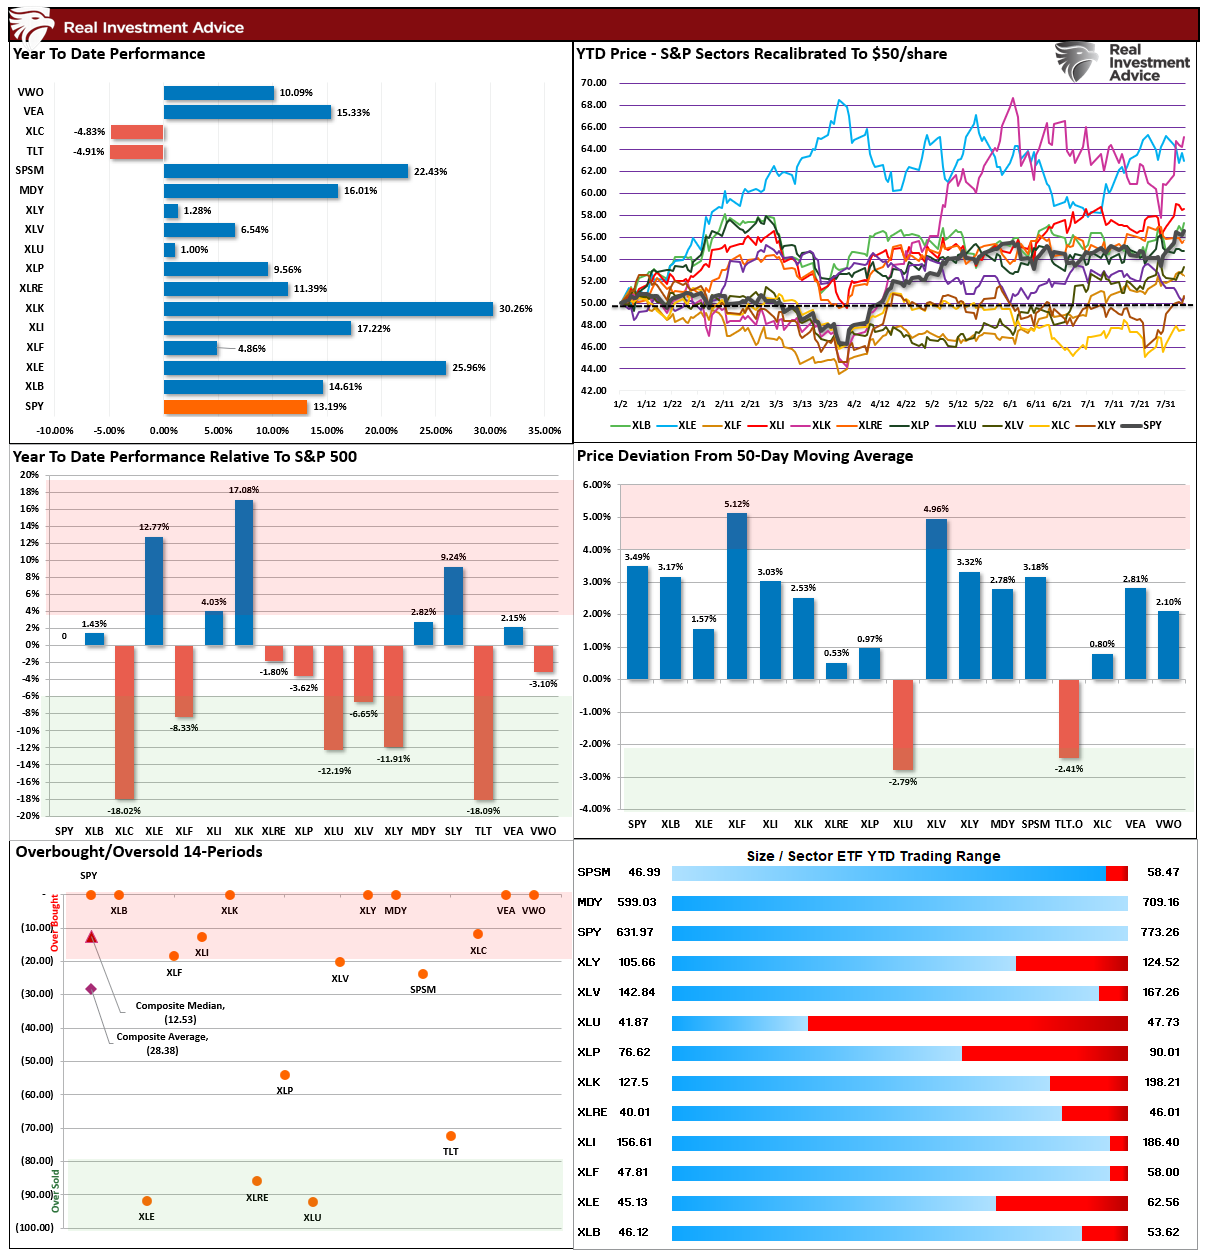
📐 Technical Composite: 86.38 – Bullish Overbought
The technical condition ticked up this past week as the Megacaps put in a strong run at the end of the week. The market is now overbought, and sentiment remains bullish for now.

🤑 Fear/Greed Index: 83.21 – Extreme Greed
Earnings reports from large-cap stocks pushed the market higher, bringing investor positioning and sentiment along with it. From a “how are investors positioned” perspective, investors remain very bullish on the market and show no real signs of concern.

🔁 Relative Factor Performance
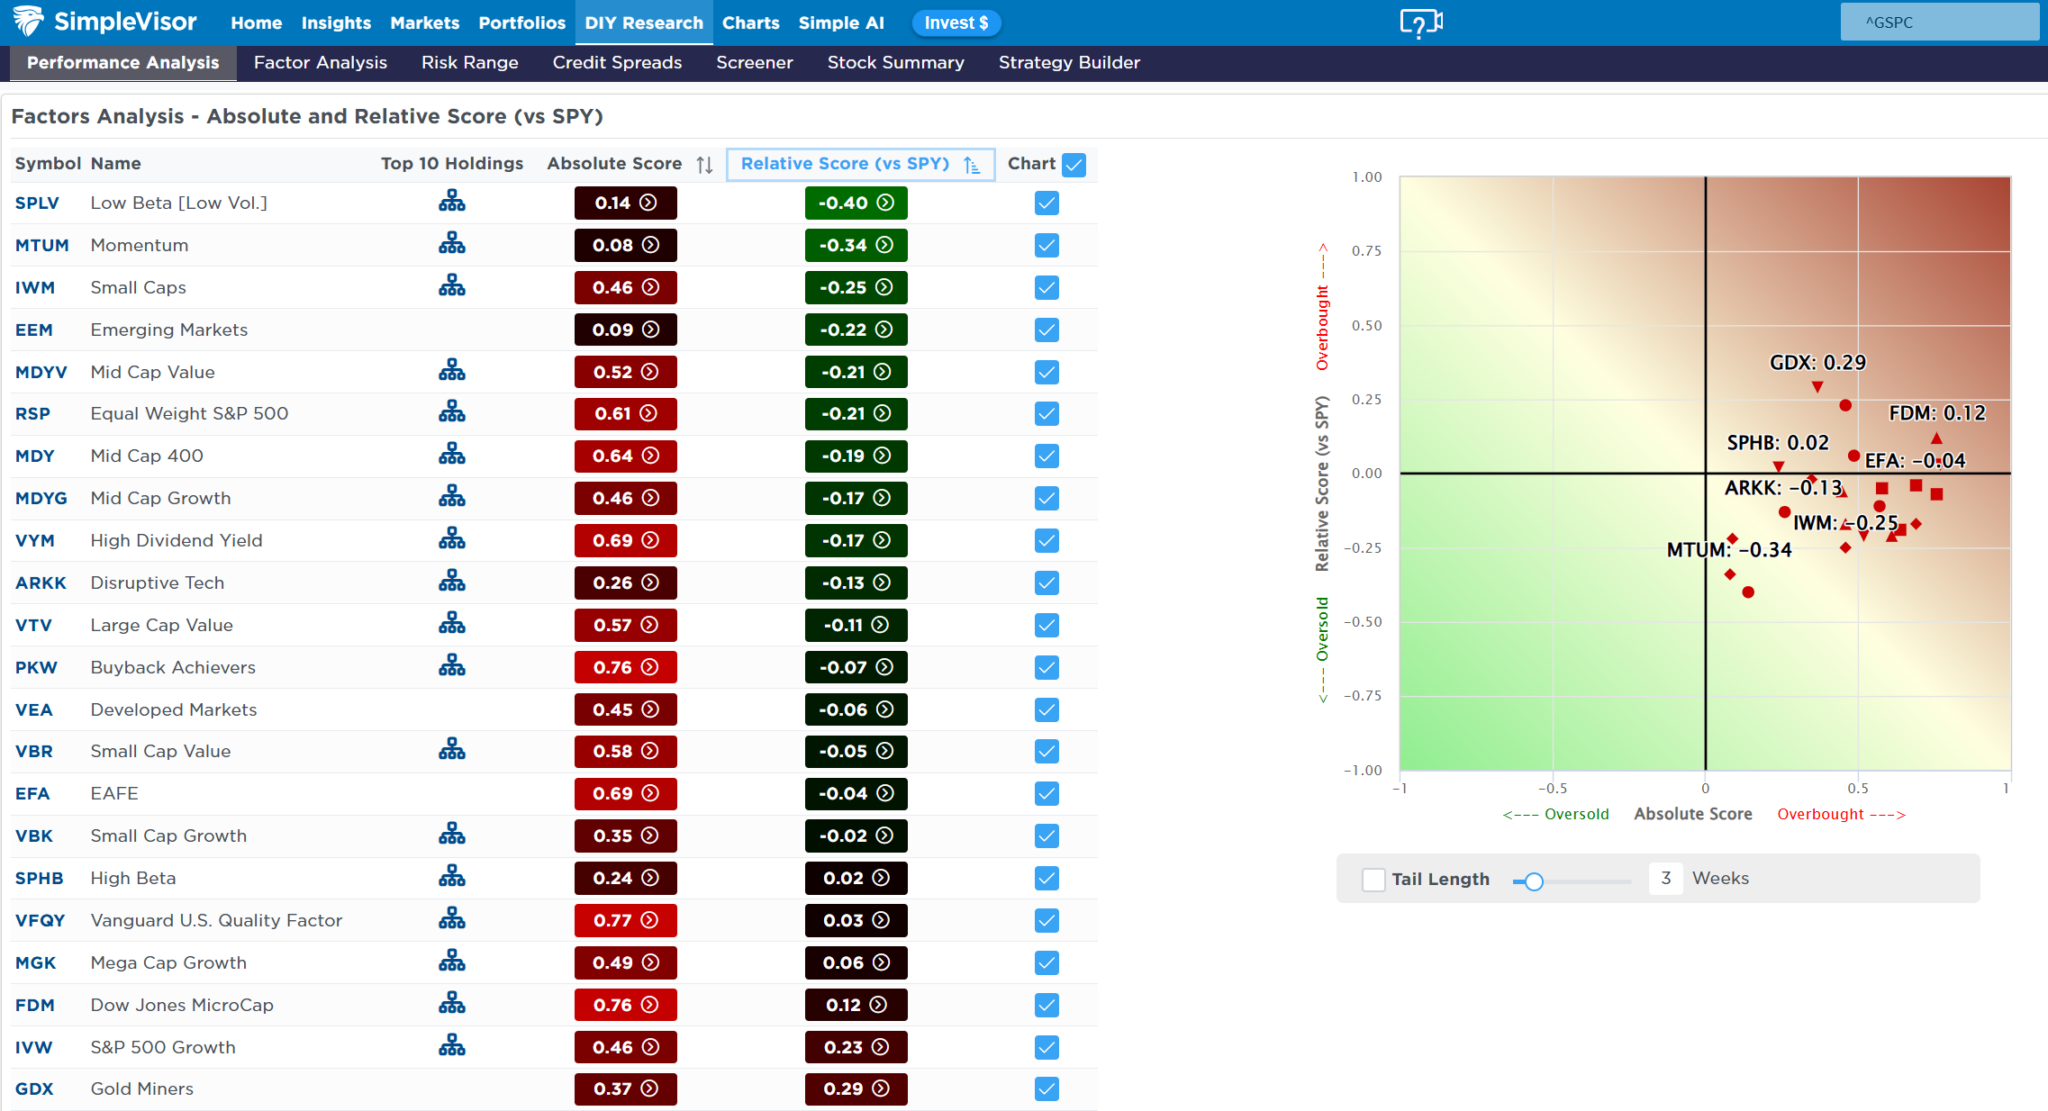
We noted three weeks ago that “compression of factors has been evident…that clustering will shake itself out sooner than later, and the opportunity will be in which factors start to take the lead.” That happened at the end of this past week with some of the Megacap names leading the charge. Magacaps continued to outperform this past week, along with Gold Miners, and Growth stocks are now overbought. With the market very bullish, we could see a rotation back to defensive positioning heading into September.
📊 MFBR Index (Money Flow/Breadth Ratio Indicator)
NEW! MFBR Index: The Money Flow Breadth Ratio (MFBR) model is a rules-based equity allocation framework that uses weekly S&P 500 money flow data to generate buy, sell, and neutral signals. The MFBR systematically adjusts portfolio equity exposure in response to the direction and persistence of institutional capital flows. It aims to reduce drawdowns while capturing the majority of market upside.
“As of August 7, 2026, with the S&P 500 at 7,757.64, the Money Flow Breadth Ratio (MFBR) stands at 75% and rising, versus 70% the prior week – a 10 percentage-point increase over the trailing four weeks. This places the indicator in extreme overbought territory (75% or higher). The raw breadth signal still reads BUY, but the MFBR is a contrarian indicator at extremes: readings this stretched have historically been followed by below-average forward returns, so the model treats this as a caution flag rather than a green light to add risk.
The model currently recommends reducing equity exposure to a target weight of 50%. Against your current equity weight of 63%, that implies reducing equity exposure by roughly 13 percentage points. The trim is driven by the contrarian grid rather than by weak breadth – the model takes profits into strength when participation reaches extremes.
Breadth this stretched is a profit-taking signal, not a chase signal. The model’s message is to sell into strength, move down to the target weight, and reassess next week.”

📊 Sector Model & Risk Ranges
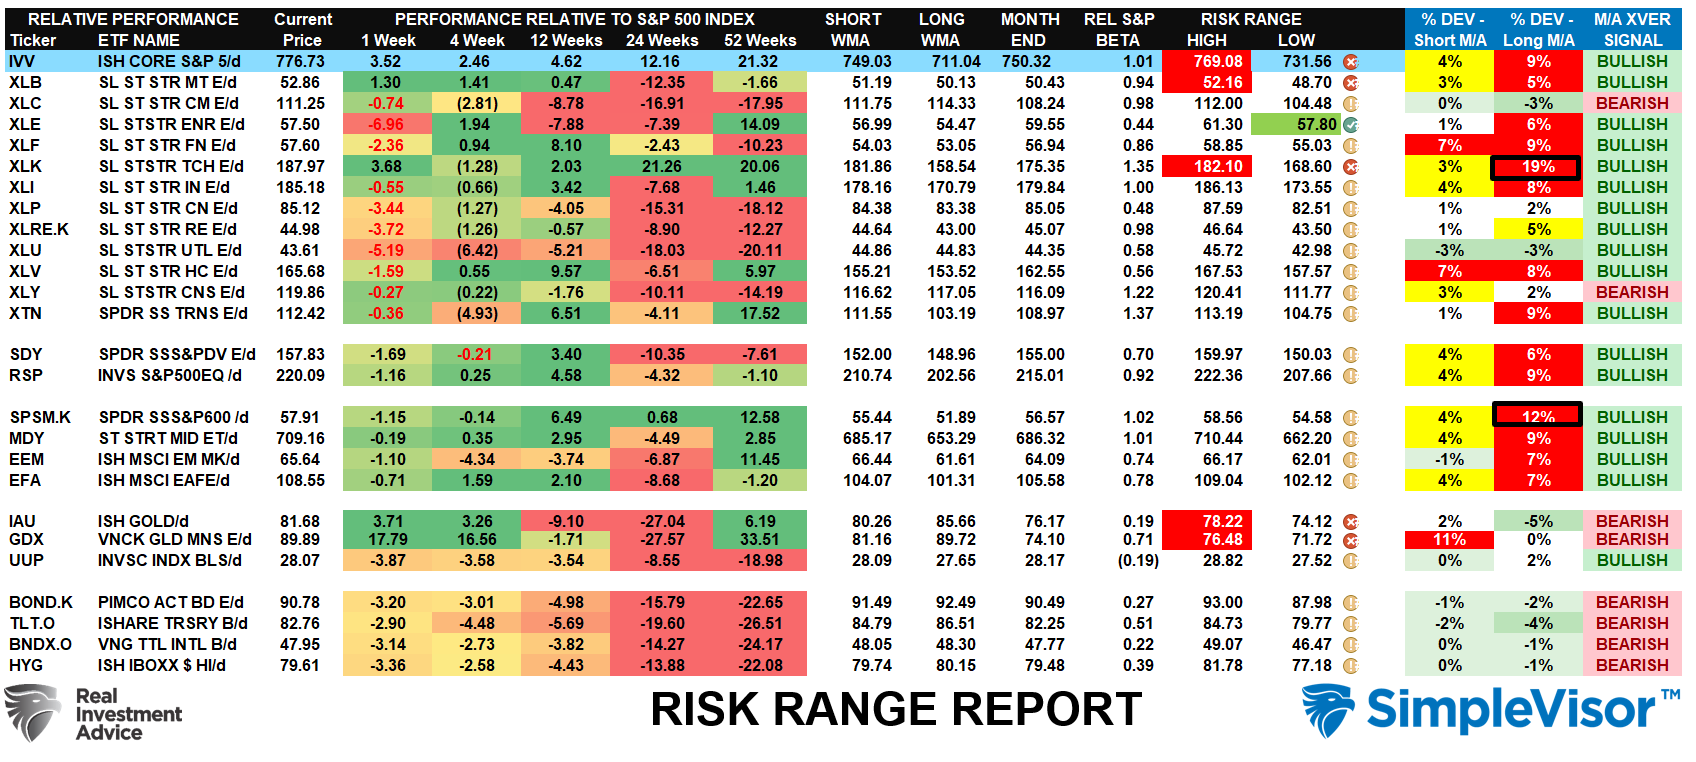
This past week, the surge in Megacap and Technology related names, as well as Basic Materials, Gold, and Goldminers, back to very overbought and extended conditions. Take profits and rebalance risk particularly given the status of the MFBR indicator above.
Have a great week.
Lance Roberts, CIO, RIA Advisors