Recession indicators are ringing loudly.
Yet, the Fed remains focused on its inflation fight, as repeatedly noted by Jerome Powell following this week’s FOMC meeting. During his press conference, he specifically made two critical comments. The first was that inflation remains too high and is well above the Fed’s two-percent goal. The second was that the bank crisis would tighten lending standards which would have a “policy tightening” effect on the economy and inflation.
As shown, lending conditions have tightened markedly, and such tightening always precedes recessionary slowdowns.
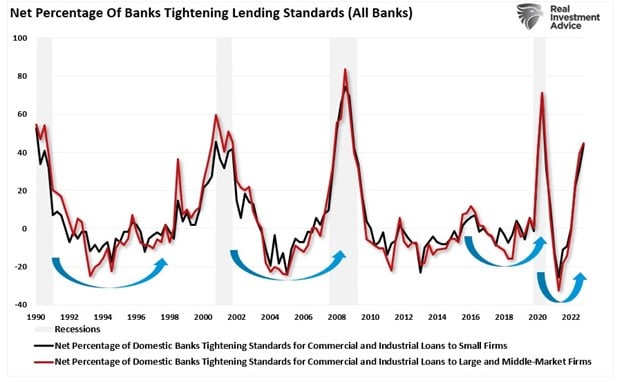
While the market is starting to price in just one additional rate hike by the Fed, the “lag effect” of rate hikes remains the most significant risk.
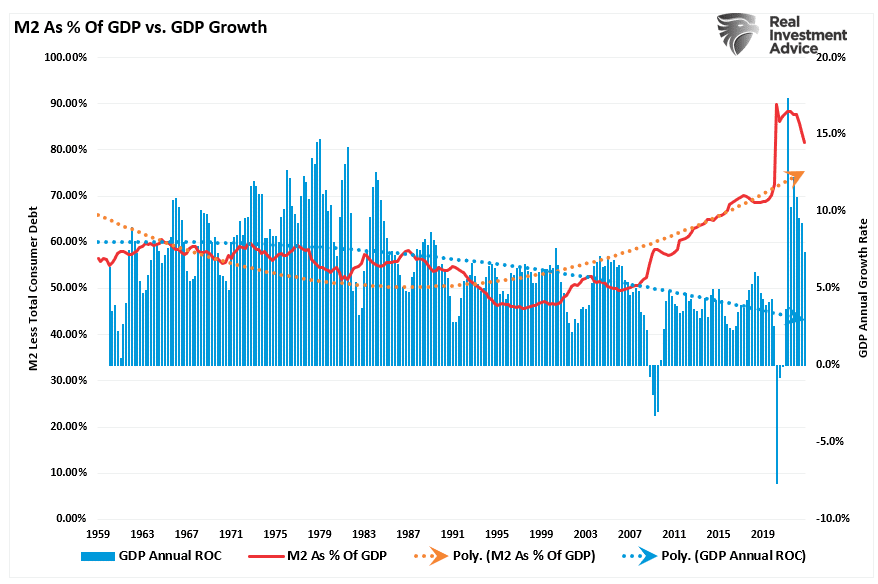
The problem for the Fed is that the economy still shows plenty of strength, from recent employment numbers to retail sales. However, much of this “strength” is an illusion from the “pull forward” of consumption following the massive fiscal and monetary injections into the economy.
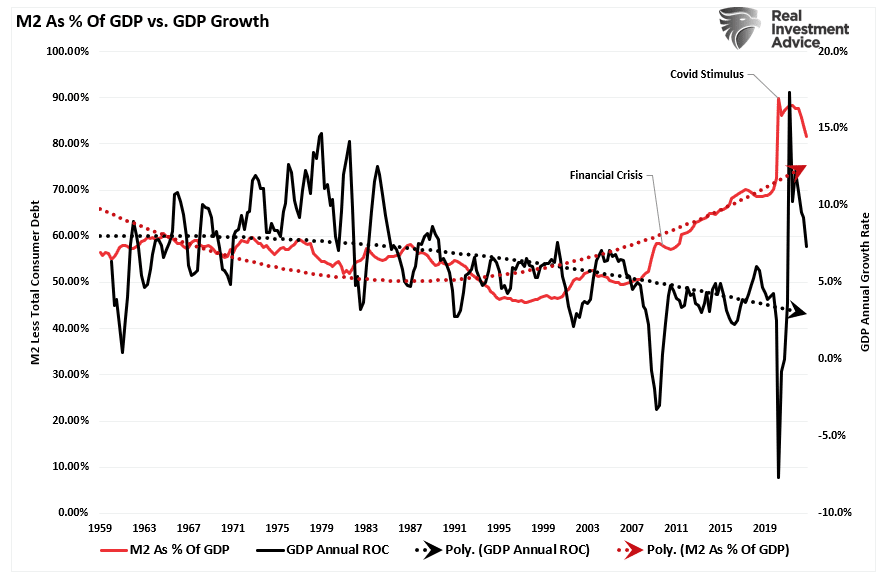
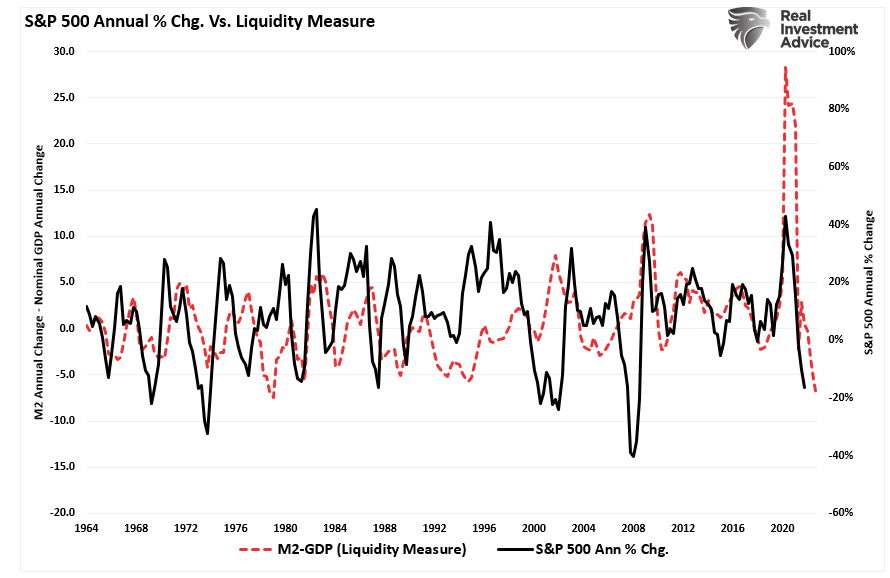
As shown, M2, a measure of monetary liquidity, is still highly elevated as a percentage of GDP. This “pig in the python” is still processing through the economic system. Still, the massive deviation from previous growth trends will require an extended time frame for reversion. Such is why calls for a “recession” have been early, and the data continues to surprise economists.
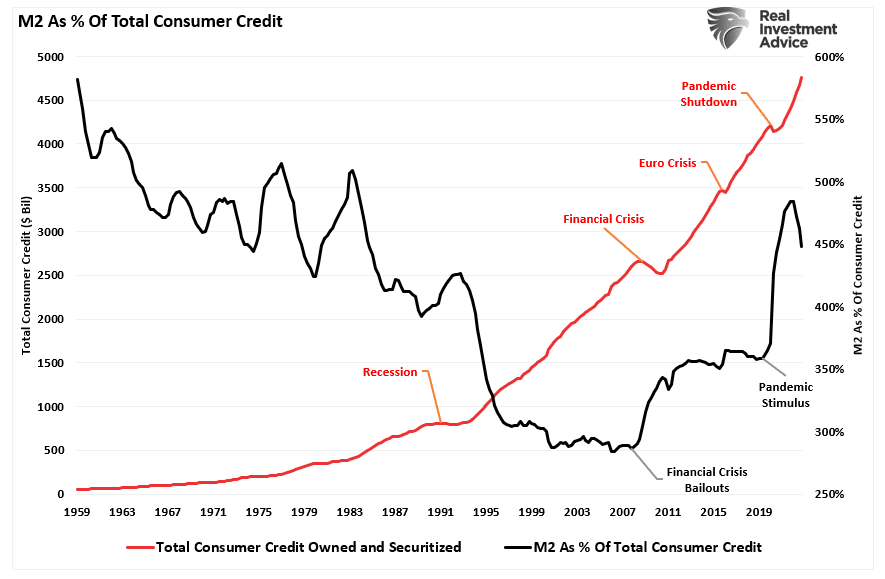
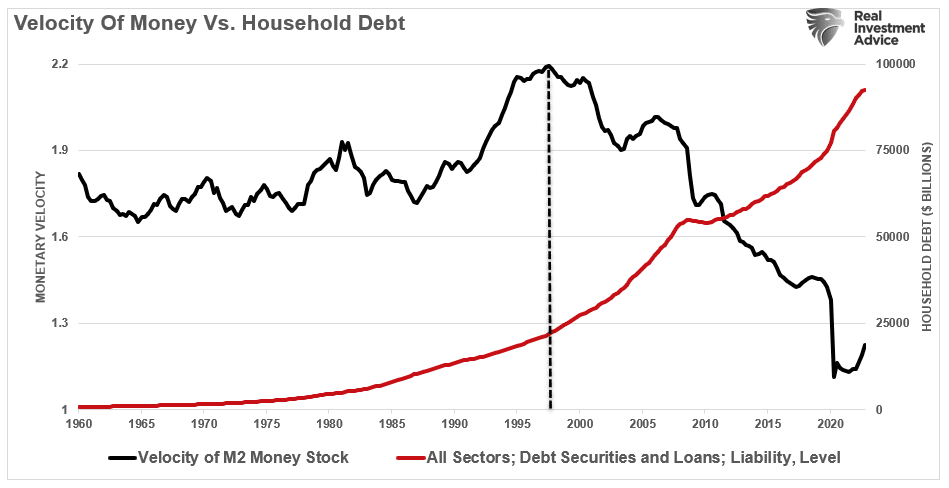
Given that economic growth is comprised of roughly 70% consumer spending, the ramp-up in debt to “make ends meet” as that liquidity impulse fades is not surprising. You will note that each time there is a liquidity impulse following some crisis, consumer debt temporarily declines. However, as we said previously, the inability to sustain the current standard of living without debt increases is impossible. Therefore, as those liquidity impulses fade, the consumer must take on increasing debt levels.

Monetary & Fiscal Policy Is Deflationary
The problem is that the Federal Reserve and the Government fail to grasp that monetary and fiscal policy is “deflationary” when “debt” is required to fund it.
How do we know this? Monetary velocity tells the story.
What is “monetary velocity?”
“The velocity of money is important for measuring the rate at which money in circulation is used for purchasing goods and services. Velocity is useful in gauging the health and vitality of the economy. High money velocity is usually associated with a healthy, expanding economy. Low money velocity is usually associated with recessions and contractions.” – Investopedia
With each monetary policy intervention, the velocity of money has slowed along with the breadth and strength of economic activity. While, in theory, “printing money” should lead to increased economic activity and inflation, such has not been the case.
Beginning in 2000, the “money supply” as a percentage of GDP exploded higher. The “surge” in economic activity is due to “reopening” from an artificial “shutdown.” Therefore, the growth is only returning to the long-term downtrend. The attendant trendlines show that increasing the money supply has not led to more sustainable economic growth. It has been quite the opposite.
Moreover, it isn’t just the expansion of M2 and debt undermining the economy’s strength. It is also the ongoing suppression of interest rates to try and stimulate economic activity. In 2000, the Fed “crossed the Rubicon,” whereby lowering interest rates did not stimulate economic activity. Therefore, the continued increase in the “debt burden” detracted from it.
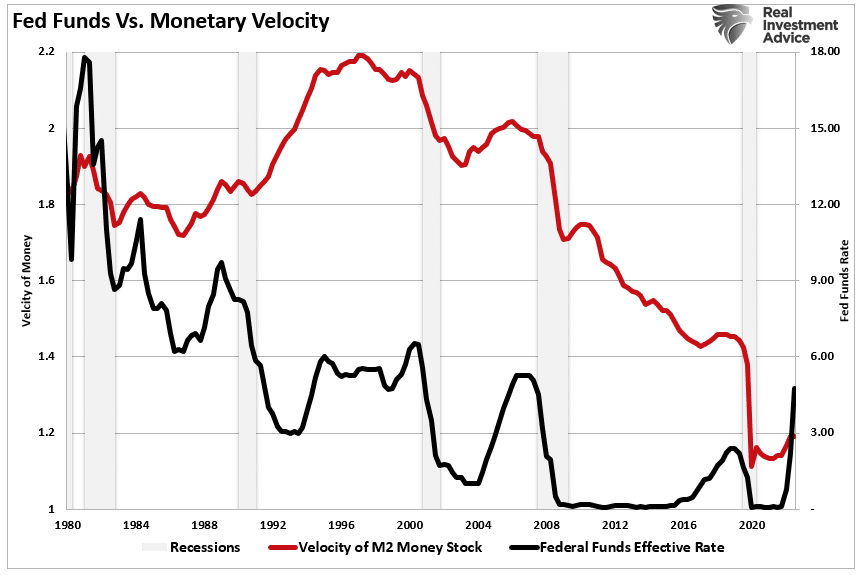
It is also worth noting that monetary velocity improves when the Fed is hiking interest rates. Interestingly, much like the recession indicators we will discuss next, monetary velocity tends to improve just before the Fed “breaks something.”

Recession Indicators Ringing Alarm Bells
Many “recession indicators” are ringing alarm bells, from inverted yield curves to various manufacturing and production indexes. However, this post will focus on two related to economic expansions and recessions.
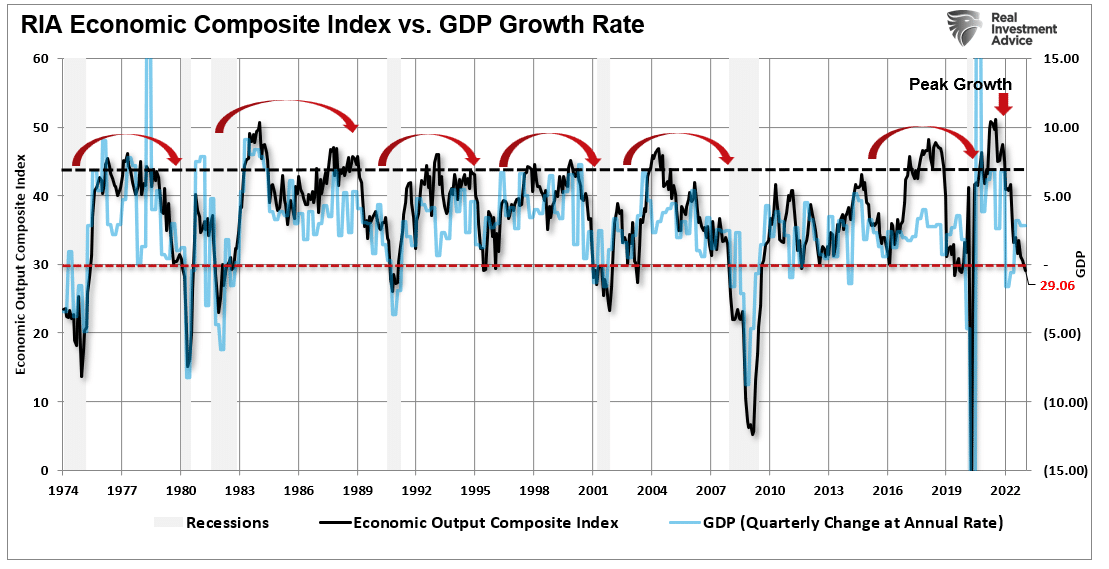
The first is our composite economic index comprising over 100 data points, including leading and lagging indicators. Historically, when that indicator has declined below 30, the economy was either in a significant slowdown or recession. Just as inverted yield curves suggest that economic activity is slowing, the composite economic index confirms the same.
The 6-month rate of change of the Leading Economic Index (LEI) also confirms the composite economic index. As a recession indicator, the 6-month rate of change of the LEI has a perfect traffic record.
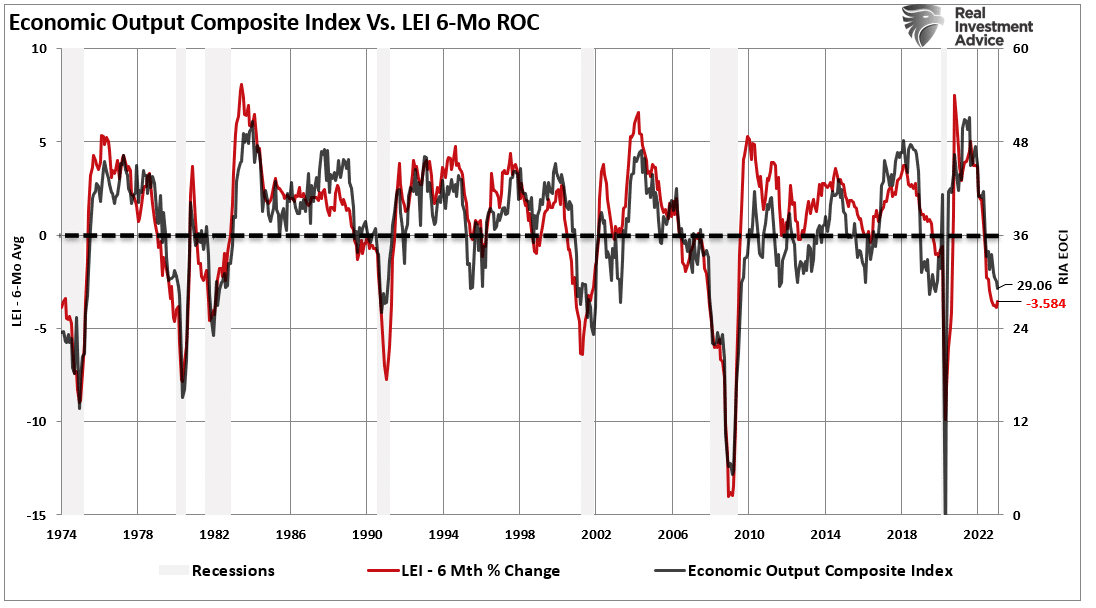
Of course, today’s debate is whether these recession indicators are wrong for the first time since 1974. As stated above, the massive surge in monetary stimulus (as a percentage of GDP) remains highly elevated, which gives the illusion the economy is more robust than it likely is. As the lag effect of monetary tightening takes hold later this year, the reversion in economic strength will probably surprise most economists.
For investors, the implications of reversing monetary stimulus on prices are not bullish. As shown, the contraction in liquidity, measured by subtracting GDP from M2, correlates to changes in asset prices. Given there is significantly more reversion in monetary stimulus to come, such suggests that lower asset prices will likely follow.
Of course, such a reversion in asset prices will occur as the Fed “breaks something” by over-tightening monetary policy.

The Fed Broke Something
As the Fed continues to hike rates to fight an inflationary “boogeyman,” the more considerable threat remains deflation from an economic or credit crisis caused by overtightening monetary policy.
History is clear that the Fed’s current actions are once again behind the curve. While the Fed wants to slow the economy, not have it come crashing down, the real risk is “something breaks.” Each rate hike puts the Fed closer to the unwanted “event horizon.” When the lag effect of monetary policy collides with accelerating economic weakness, the Fed’s inflationary problem will transform into a more destructive deflationary recession.
If we overlay periods of Federal Reserve tightening on our economic composite recession indicator, the risk becomes quite clear.
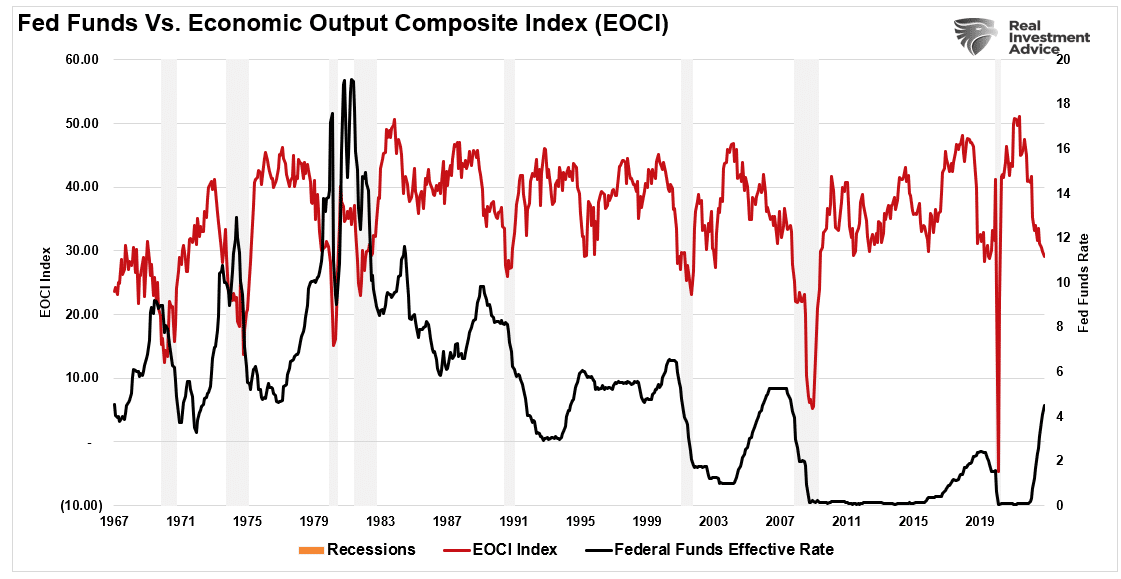
While the Fed is hiking rates due to inflationary concerns, the real risk becomes deflation when something breaks.
“Such is because high inflationary periods also correspond with higher interest rates. In highly indebted economies, as in the U.S. today, such creates faster demand destruction as prices and debt servicing costs rise, thereby consuming more of available disposable income. The chart below shows “real interest rates,” which include inflation, going back to 1795.”

Not surprisingly, each period of high inflation is followed by very low or negative inflationary (deflation) periods.
For investors, these recessionary indicators confirm that earnings will decline further as tighter monetary policy slows economic growth.
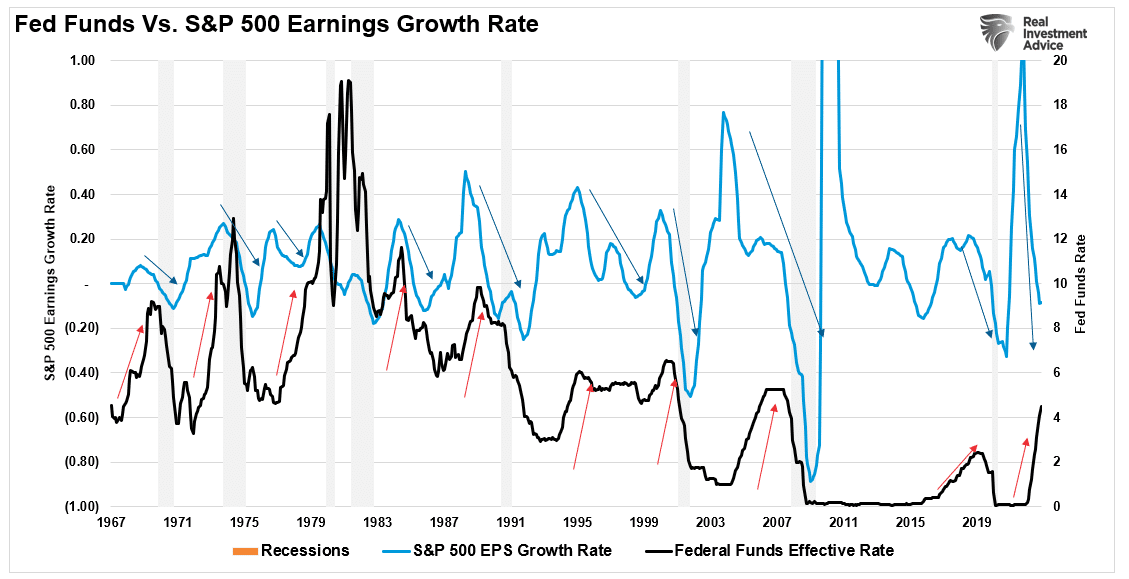
Historically, periods of Fed tightening have never had a positive outcome on earnings, and it likely won’t this time either.
That is particularly the case when the Fed “breaks” something.
While this time “could be different,” from an investing standpoint, I wouldn’t bet my retirement on that view.

