
As we get ready to review the Q4 earnings report, stocks have rallied sharply over the last two months. As we have discussed previously, it will be unsurprising that we will see a high percentage of companies “beat” Wall Street estimates. Of course, the high beat rate is always the case due to the sharp downward revisions in analysts’ estimates as the reporting period begins. The chart below shows the changes for the Q4 earnings period from when analysts provided their first estimates.
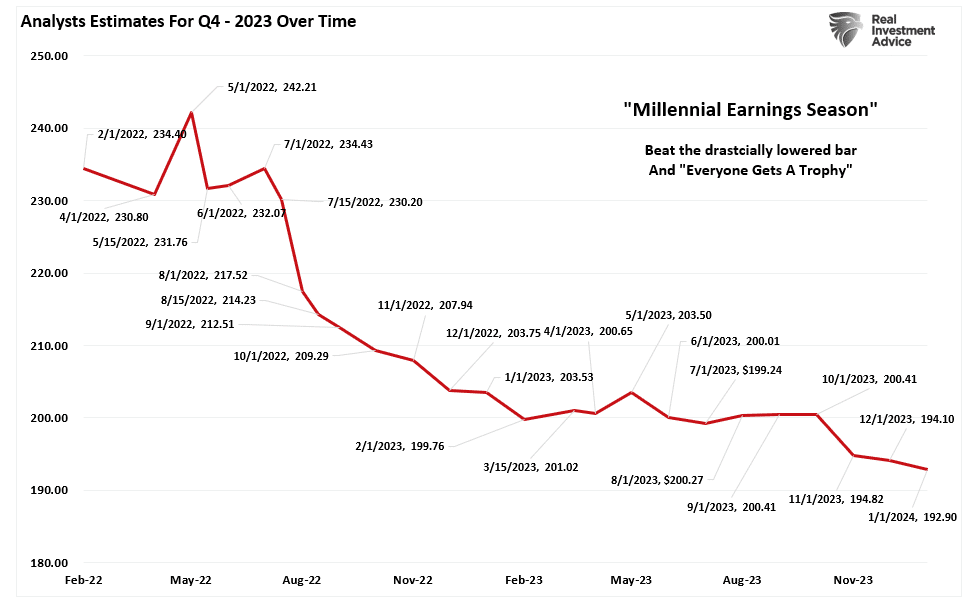
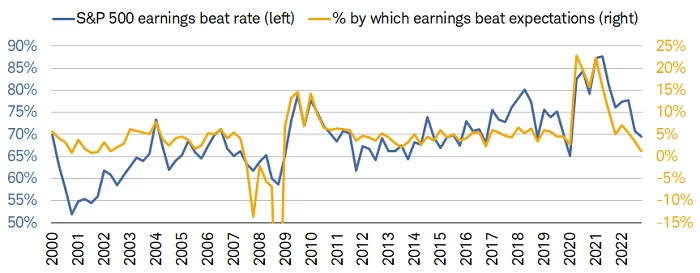
This is why we call it “Millennial Earnings Season.” Wall Street continuously lowers estimates as the reporting period approaches so “everyone gets a trophy.” An easy way to see this is the number of companies beating estimates each quarter, regardless of economic and financial conditions. Since 2000, roughly 70% of companies regularly beat estimates by 5%. Again, that number would be lower if analysts were held to their original estimates.
Analysts remain optimistic about earnings even with economic growth weakening, inflation remaining elevated, and liquidity declining. However, despite the decline in Q4 earnings estimates, analysts still believe that the first quarter of 2023 marked the bottom for the earnings decline. Again, this is despite the Fed rate hikes and tighter bank lending standards that will act to slow economic growth.
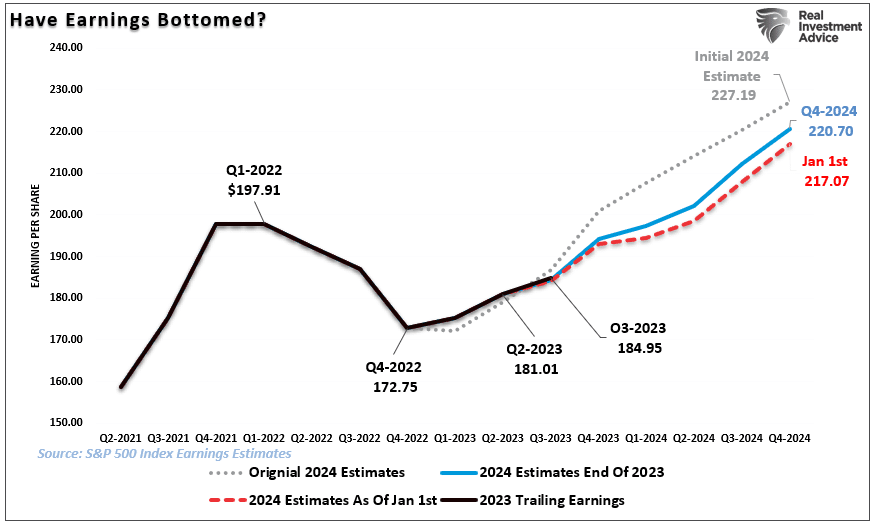
The problem with these expectations is the detachment of earnings estimates above the long-term growth trend.

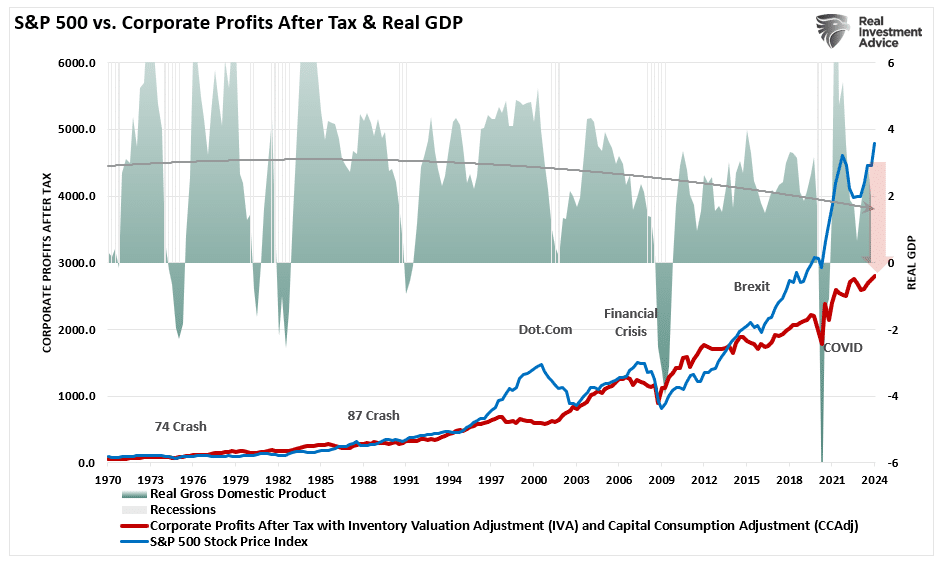
As we have discussed previously, economic growth, from which revenue and earnings are derived, must also grow enormously for earnings to grow at such an expected pace.
Since 1947, earnings per share have grown at 7.72%, while the economy has expanded by 6.35% annually. That close relationship in growth rates is logical, given the significant role that consumer spending has in the GDP equation. However, while nominal stock prices have averaged 9.35% (including dividends), reversions to underlying economic growth will eventually occur. Such is because corporate earnings are a function of consumptive spending, corporate investments, imports, and exports. The same goes for corporate profits, where stock prices have significantly deviated.
This is important to investors due to the coming impact on “valuations.”
Given current economic assessments from Wall Street to the Federal Reserve, such is not currently expected to be the case. The data also suggest a reversion to the mean is entirely possible.

The Reversion To The Mean
Following the pandemic-driven surge in monetary policy and a shuttering of the economy, the economy is slowly returning to normal. Of course, normal may seem very different compared to the economic activity we have witnessed over the last several years. Numerous factors at play support the idea of weaker economic growth rates and, subsequently, weaker earnings over the next few years.
- The economy is returning to a slow growth environment with a risk of recession.
- Inflation is falling, meaning less pricing power for corporations.
- No artificial stimulus to support demand.
- Over the last three years, the pull forward of consumption will now drag on future demand.
- Interest rates remain substantially higher, impacting consumption.
- Consumers have sharply reduced savings and higher debt loads.
- Previous inventory droughts are now surpluses.
Notably, this reversion of activity will become exacerbated by the “void” created by pulling forward consumption from future years.
“We have previously noted an inherent problem with ongoing monetary interventions. Notably, the fiscal policies implemented post the pandemic-driven economic shutdown created a surge in demand and unprecedented corporate earnings.”
As shown below, the surge in the M2 money supply is now over. Without further stimulus, economic growth will revert to more sustainable levels.

While the media often states that “stocks are not the economy,” as noted, economic activity creates corporate revenues and earnings. As such, stocks can not grow faster than the economy over long periods. A decent correlation exists between the expansion and contraction of M2 less GDP growth (a measure of liquidity excess) and the annual rate of change in the S&P 500 index. Currently, the deviation seems unsustainable.

So, either the annualized rate of return from the S&P 500 will decline due to repricing the market for lower-than-expected earnings growth rates, or the liquidity measure is about to turn sharply higher.

Valuations Remain A Risk
The problem with forward earnings should be obvious. Given that forward earnings estimates are almost always wrong, such means that investors overpay for investments. As should be obvious, overpaying for an investment today leads to lower future returns.
Even with the decline in earnings from the peak, valuations remain historically expensive on both a trailing and forward basis. (Notice the significant divergences in valuations during recessionary periods as adjusted earnings do NOT reflect what is occurring with actual earnings.)
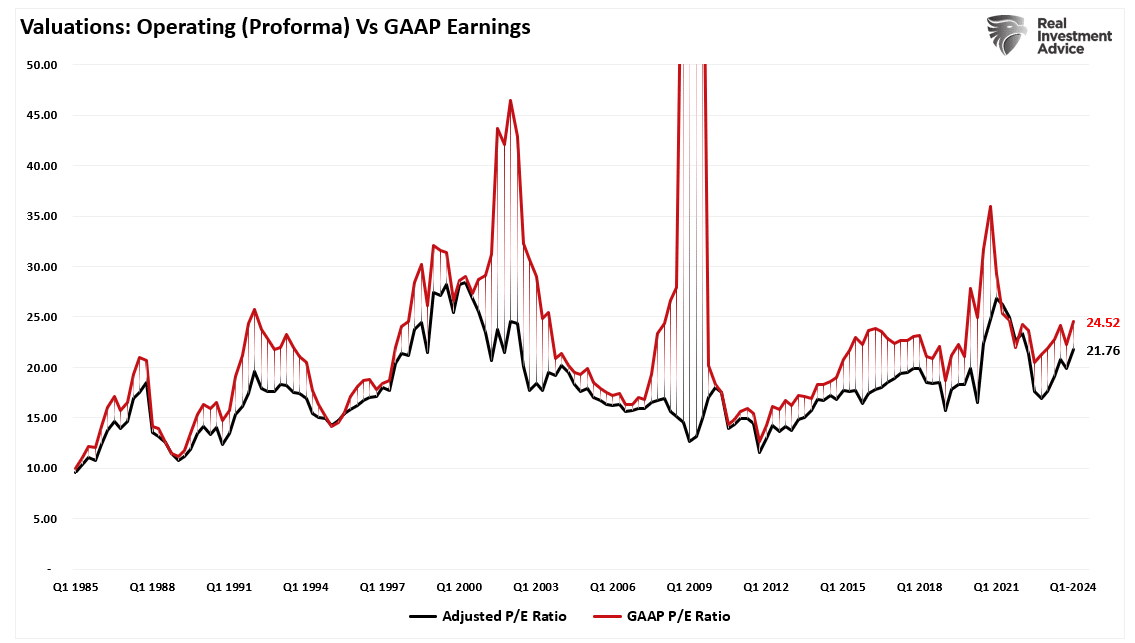
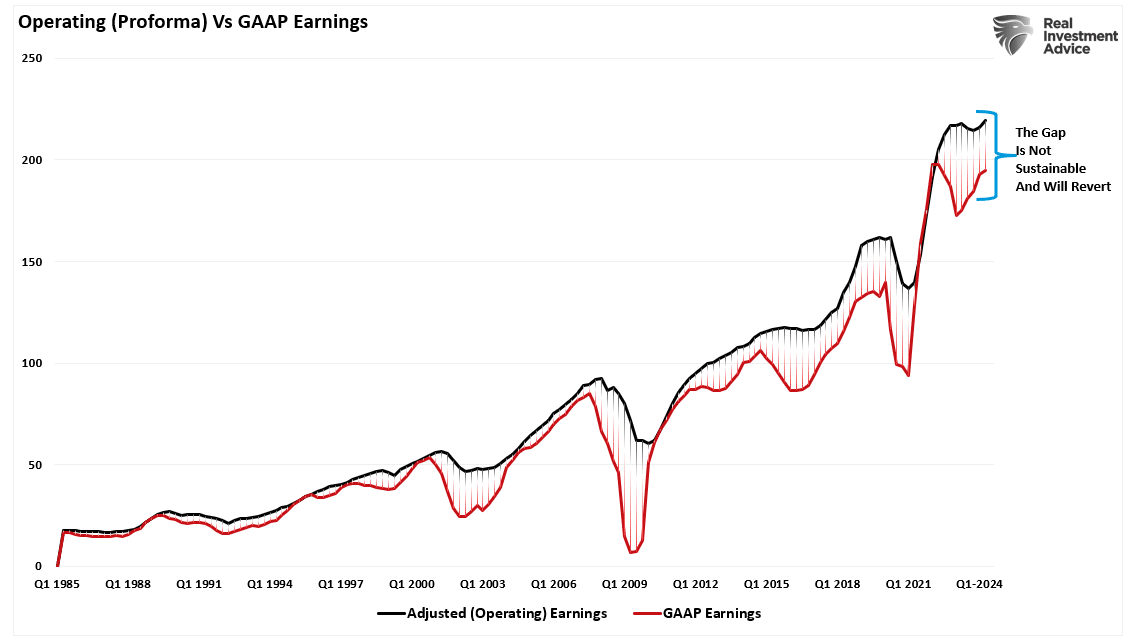
Most companies report “operating” earnings, which obfuscate profitability by excluding all the “bad stuff.” A significant divergence exists between operating (or adjusted) and GAAP earnings. When a variation of that magnitude occurs, you must question the “quality” of those earnings.
The chart below uses GAAP earnings. If we assume current earnings are correct, then such leaves the market trading above 24x earnings. (That valuation level remains near previous bull market peak valuations.)
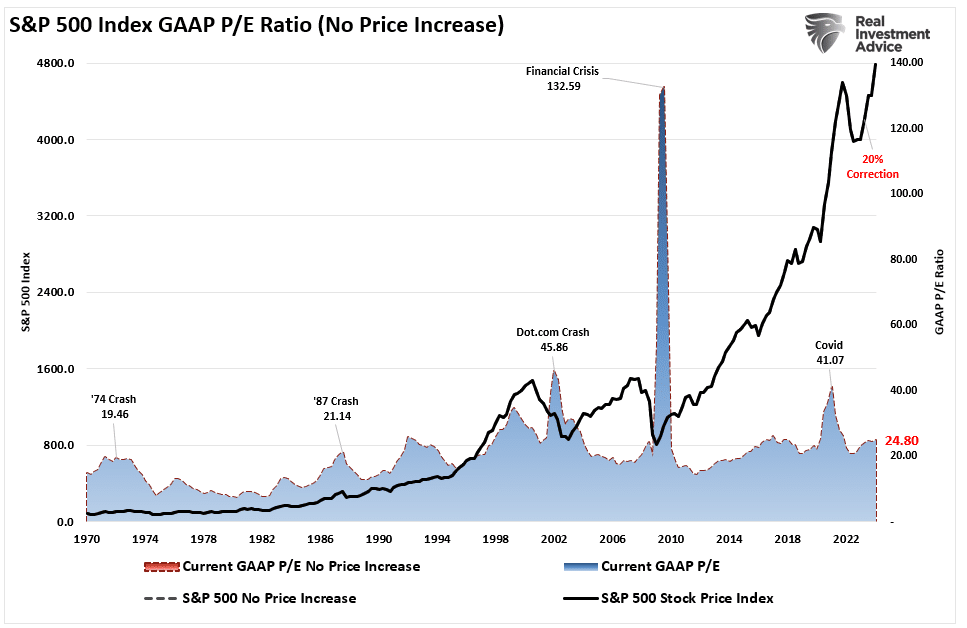
Since markets are already trading well above historical valuation ranges, this suggests that outcomes will likely not be as “bullish” as many currently expect. Such is particularly the case if more monetary accommodations from the Federal Reserve and the Government are absent.

Trojan Horses
The hope, as always, is that Q4 earnings and the entire coming year’s reports will rise to justify the market’s overvaluation. However, when earnings are rising, so are the markets.
Most importantly, analysts have a long and sordid history of being overly bullish on growth expectations, which fall short. Such is particularly the case today. Much of the economic and earnings growth was not organic. Instead, it was from the flood of stimulus into the economy, which is now evaporating.
Overpaying for assets has never worked out well for investors.
With the Federal Reserve intent on slowing economic growth to quell inflation, it is only logical earnings will decline. Prices must accommodate lower earnings by reducing current valuation multiples if such is the case.
When it comes to analysts’ estimates, always remain wary of “Greeks bearing gifts.”

