For the better part of the last two years, Jerome Powell and the Fed have clearly indicated that monetary policy is primarily focused on bringing inflation back to its 2% target. Over the period, Powell indicated he was comfortable with weakness in the labor market if it meant inflation would normalize. Powell’s FOMC press conference and a speech on Good Friday provide hints that they are getting comfortable with inflation. Accordingly, the labor market will play a more prominent role in setting monetary policy. To wit the following sentence from Powell:
“If we were to see unexpected weakness in the labor market that could draw a policy response.”
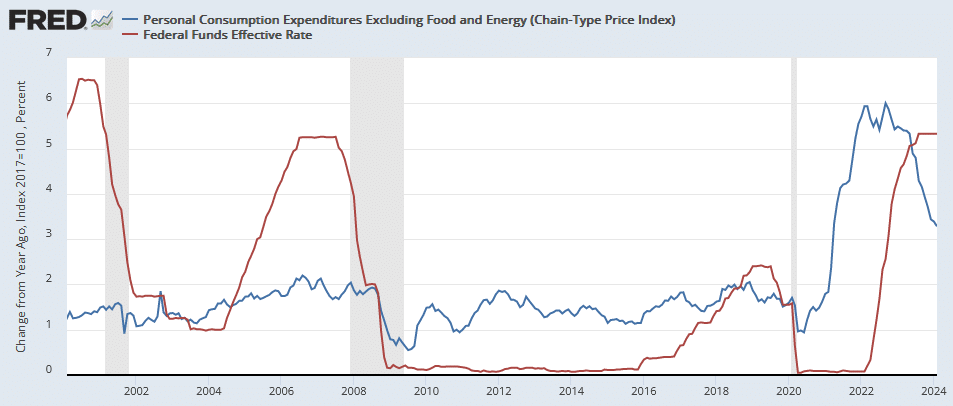
The graph below shows the 2% difference between Fed Funds and Core PCE is the most restrictive policy since 2007. Given that policy is tight, their new focus on employment is logical. BLS headline labor data has been robust. However, other data, like their household survey and part-time versus full-time employment, have shown weakness. Further, a report by ZeroHedge reviews a Philadelphia Fed report stating that job growth has been overstated. Is Powell trying to tip the market off that the BLS may revise lower job growth? Or might the headline jobs data start catching down to other sources, indicating weak job growth? It could be, but the important takeaway, in our view, is that Powell indicates that employment is now on par with inflation as a good signal for when the Fed may cut rates.
What To Watch Today
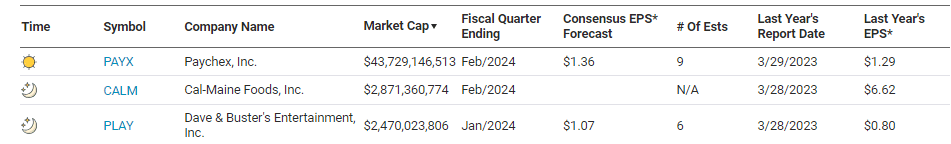
Earnings
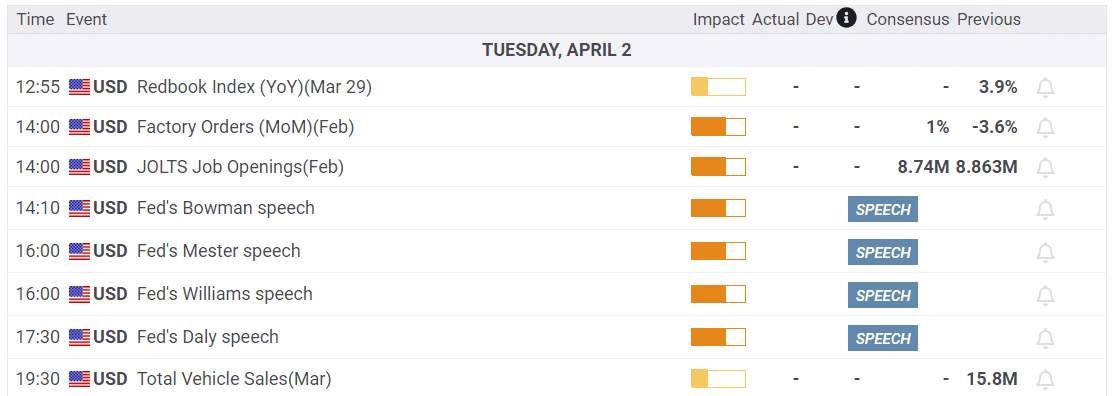
Economy
Market Trading Update
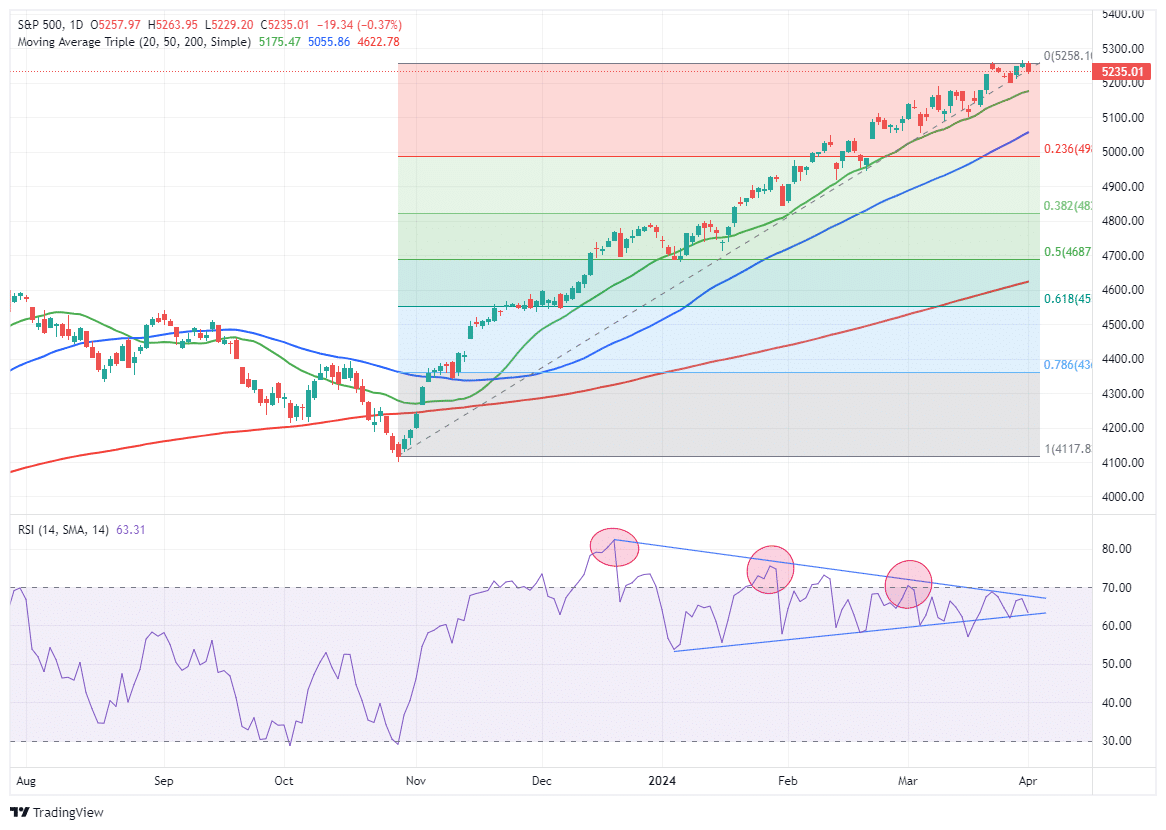
Yesterday was a good “April Fools” joke by the market. In early morning trade, futures suggested a fairly strong open, pointing to new all-time highs for the index. However, that failed to materialize, and the market sold off with small and mid-caps leading the way. Notably, on Friday, we discussed the rotation trade and that other markets were finally showing some relative strength to play “catch up” to the S&P 500. Much of that “catch-up” trade was likely end-of-quarter rebalancing by managers as yesterday’s biggest laggards were the recent winners.
One day in the new quarter does not mean much, but it remains ripe for further corrective action with the market extended and well deviated above long-term means. Also, with the market putting in a double-top, a violation of the 20-DMA will confirm a large correction is in process. There is no reason to be overly concerned with one day’s action, but we watch closely for evidence of a turn. It is worth remembering that the last time we had such a long stretch of overbought condition was in 2017. We then had two sizable corrections in 2018.

The 50% Problem Driving The Wealth Gap
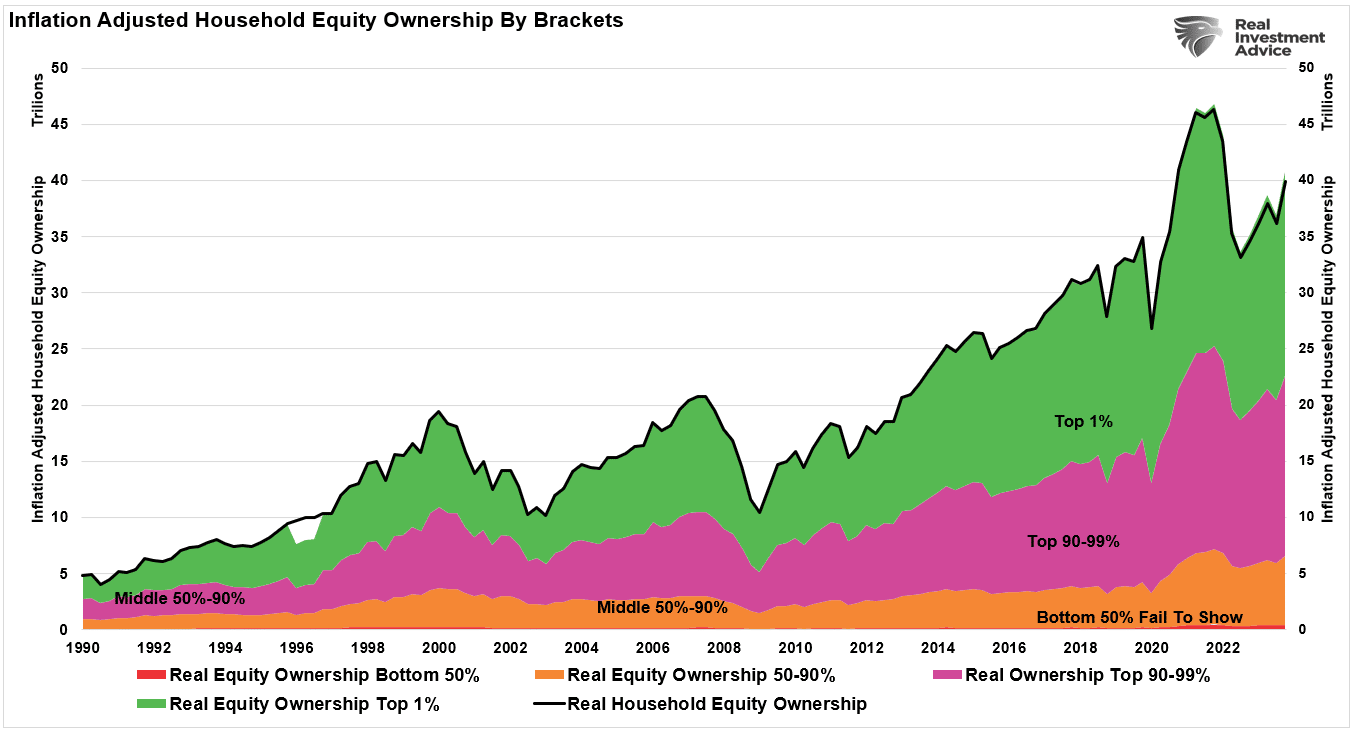
Our latest article, Wealth Gap and the Road to Serfdom, reviews the vast difference in wealth between the rich and poor. While there are many reasons for the gap, a good portion of it is due to the populace’s inability to invest. As the article notes,
The advice to build wealth is quite simplistic. Investment money into the financial market consistently over long periods. That’s it.
Again, considering that most Americans alive today participated in either one or both of the most significant secular bull markets in history, the lack of wealth is quite appalling. If individuals had invested $1000 in 1980 into the S&P 500 index and added just $100 per month, they would have roughly $1.4 million in retirement savings today.
The advice to invest is simple, but most Americans do not have the means to invest. Per the article:
The cost of raising a family of four continues to increase with inflation, so the bottom 80% are forced to live paycheck-to-paycheck, primarily leaving no money for retirement savings.
Therefore, while the stock market surges to all-time highs, the wealth gap leaves increasing numbers of Americans behind. For the average American, it isn’t a choice of not wanting to participate; they simply can’t.
The Equal Weighted S&P Shows Promise
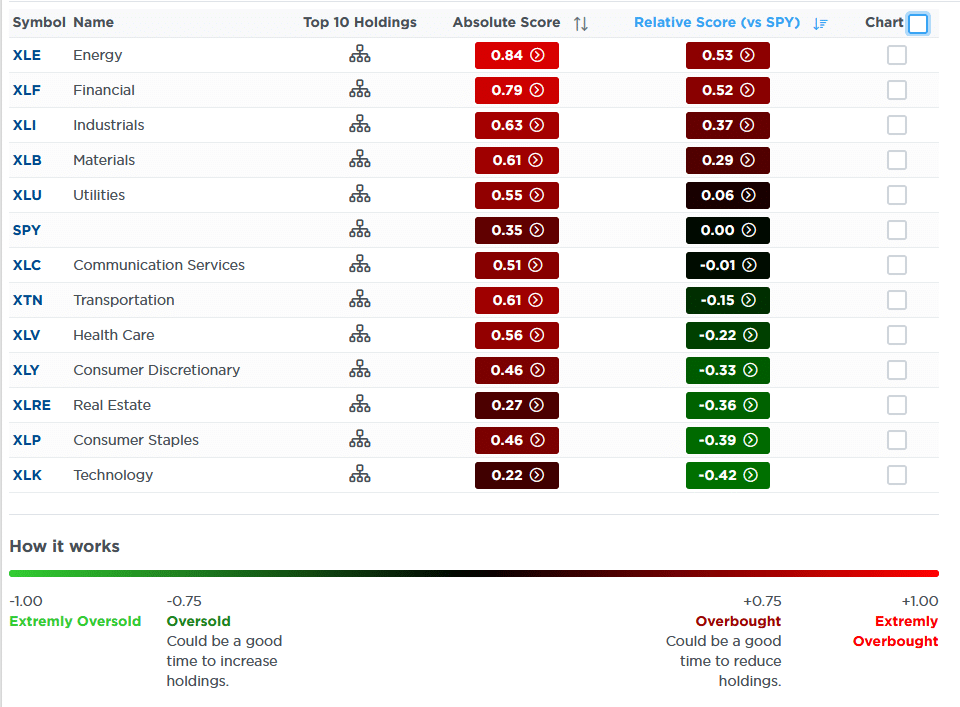
Our SimpleVisor proprietary Relative and Absolute analysis of sectors aggregates 13 technical studies to assess which sectors are over or underperforming versus each other and against the broader S&P 500. The graphics provide a sneak peek of the updated SimpleVisor website. We hope to roll out the new version this month.
The new layout plots the relative and absolute scores side by side. The first graphic is sorted from most overbought to most oversold. Energy, financials, industrials, and materials are the most overbought sectors. After having been the best-performing sector for the better part of the last six months, technology is now the most oversold on a relative and absolute basis. Communications, another market leader over the previous six months, including META and GOOG, are at fair value on a relative basis but still decently overbought (+.51) on an absolute basis.
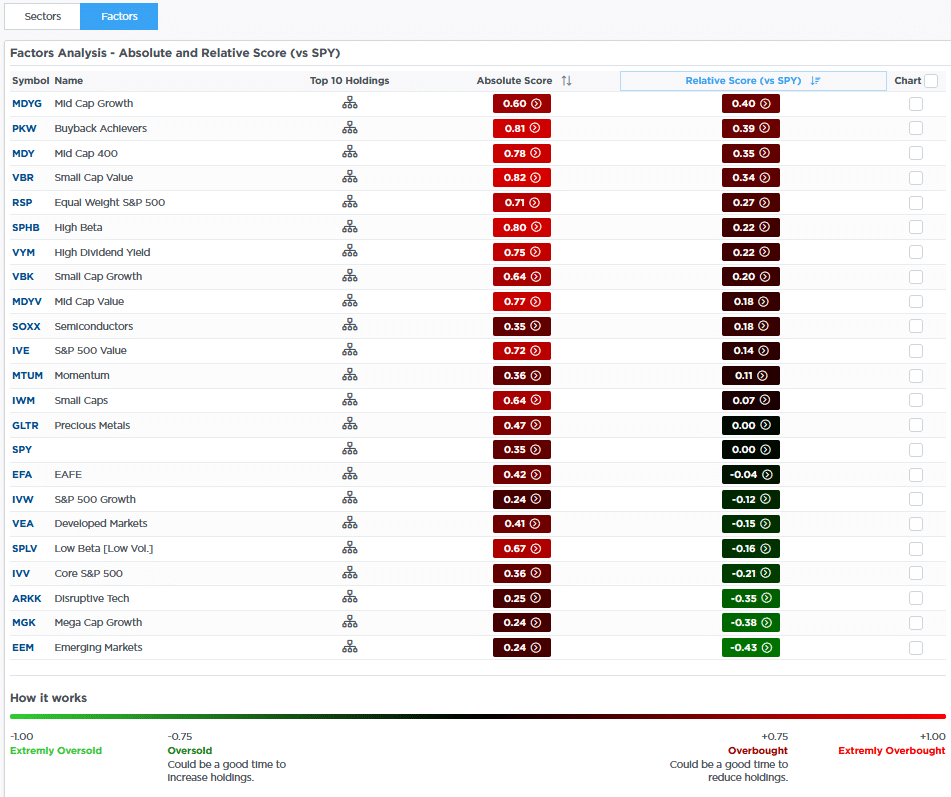
The second graph points to a similar rotation when assessing stock factors. For instance, the laggards of late 2023 and early 2024 are now the most overbought stocks versus the S&P 500. Some of these include mid-and small-cap stocks along with the equal-weighted S&P 500.
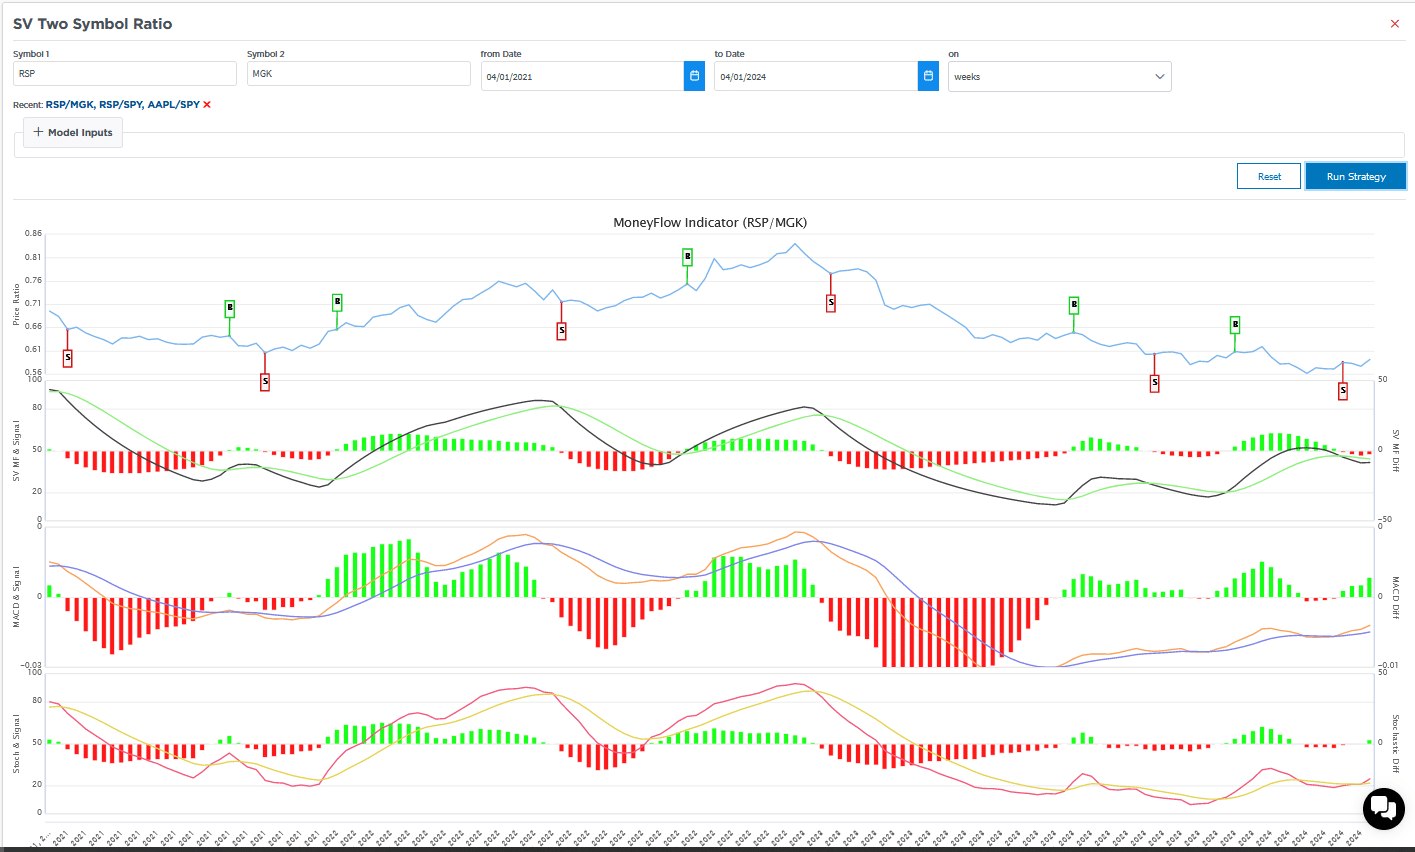
With this analysis, we are left to consider whether the reign of the mega-cap and Magnificent Seven is ending or just taking a pause. The third SimpleVisor analysis below provides some context. The price ratio of the equal-weighted S&P 500 (RSP) versus mega-cap stocks (MGK) has been flatlining recently after declining for over a year. Further, indicating that the equal-weighted index may be starting to outperform, the three technical studies below the graph are trending upward. As long as these indicators continue trending higher and the price ratio does not break below the prior lows, RSP may likely outperform the broader S&P 500 and mega-cap stocks over the coming month or two.
Tweet of the Day
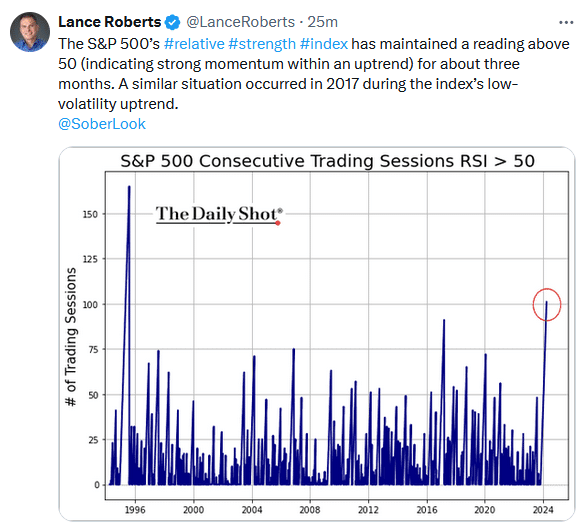
“Want to have better long-term success in managing your portfolio? Here are our 15-trading rules for managing market risks.”
Please subscribe to the daily commentary to receive these updates every morning before the opening bell.
If you found this blog useful, please send it to someone else, share it on social media, or contact us to set up a meeting.
Also Read