
Shawn Langlois recently penned an interesting article:
“Despite a few notable hiccups along the way, the bull market continues to prove insanely resilient.”
What was most interesting, however, was the following quote:
“Current hyper-valued extremes are likely to be followed by market losses on the order of two-thirds of the value of the S&P 500.”
The immediate response by most individuals is a 60%+ decline is an outlandish and impossible event given ongoing Central Bank interventions.
But is it really?
The risk of a larger mean reverting event is a possibility even though such is entirely dismissed by the mainstream media under the guise of “this time is different.” With the market trading more than 3-standard deviations above the 50-week moving average, historical reversions have tended to be more brutal.

The chart below uses key support levels as potential reversion levels. The lows of 2018. The highs and lows of 2015-2016, and the 2007 highs.
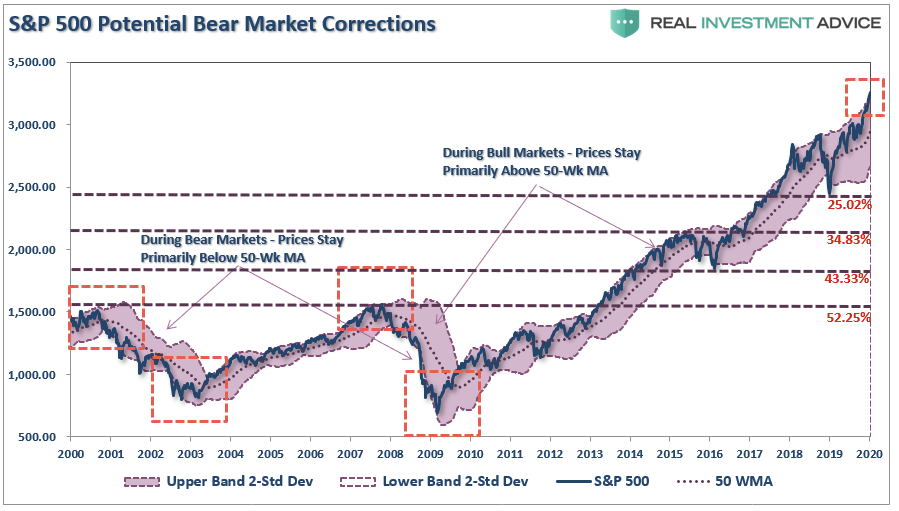
At this juncture, a correction back to the 2018 lows would entail a 25% decline. However, if a “bear market” growls, the 2015-16 highs become the target, which is 34% lower. The lows of 2016 would require a 43% draft, with the 2008 highs posting a 52% “crash.”
Those levels are still short of the 67% decline discussed above.
Such a level certainly seems preposterous, as Shawn quoted:
“I recognize that the notion of a two-thirds market loss seems preposterous. Then again, so did similar projections before the 2000-2002 and 2007-09 collapses.”
While the current belief is that such declines are no longer a possibility, due to Central Bank interventions, we had two 50% declines just since the turn of the century. The cause was different, but the end result was the same. The next major market decline will be fueled by the massive levels of corporate debt, underfunded pensions, and evaporation of “stock buybacks,” which have accounted for almost 100% of net purchases since 2018.
Market downturns are a historical constant for the financial markets. Whether they are minor, or major, the impacts go beyond just the price decline when it comes to investors. This was a discussion I had in more detail in “Retired, Or Retiring Soon? Yes, Worry About A Correction.”
“In 2000, the average ‘baby boomer’ was around 45-years of age. The ‘dot.com’ crash was painful, but with 20-years to go before retirement, there was time to recover. In 2010, following the financial crisis, the time to retirement for the oldest boomers was depleted, and the average boomer only had 10-years to recover. During both of these previous periods, portfolios were still in accumulation mode. However, today, ONLY the youngest tranche of ‘boomers,’ have the luxury of ‘time\ to work through the next major market reversion. (This also explains why the share of workers over the age of 65 is at historical highs.)
With the majority of ‘boomers’ now faced with the implications of a transition into the distribution phase of the investment cycle, such has important ramifications during market declines. The following example shows a $1 million portfolio with, and without, an annualized 4% withdrawal rate.”

“While a 10% decline in the market will reduce a portfolio from $1 million to $900,000, when combined with an assumed monthly withdrawal rate, the portfolio value is reduced by almost 14%. This is the result of taking distributions during a period of declining market values. Importantly, while it ONLY requires a non-withdrawal portfolio an 11.1% return to break even, it requires nearly a 20% return for a portfolio in the distribution phase to attain the same level.
Impairments to capital are the biggest challenges facing pre- and post-retirees currently.
This is an important distinction. Most articles written about retirees, or those ready to retire, is an unrealized assumption of an indefinite timeline.
While the market may not be different than in the past, YOU ARE!”
This is an important point.
Investing is about growing your savings over time, and controlling the risk which could lead to a significant loss of principal. Taking on excruciating losses is not investing, nor is it financially feasible to do so, and still reach your retirement goals successfully.

Putting Corrections Into Perspective
The real problem with discussing corrections is three-fold:
- It is has been so long since we have had a correction of magnitude, many investors have forgotten what happens, and more importantly, how they reacted previously.
- The majority of mainstream media advice is written or prognosticated by individuals who don’t manage money for a living, have substantial investment capital at risk, and have never actually been through a bear market.
- Given the extremely long market expansion, many investors have truly come to believe “this time is different.”
If we put corrections into a bit of perspective, it becomes easier to visualize that damage which could, and most likely will, eventually occur.
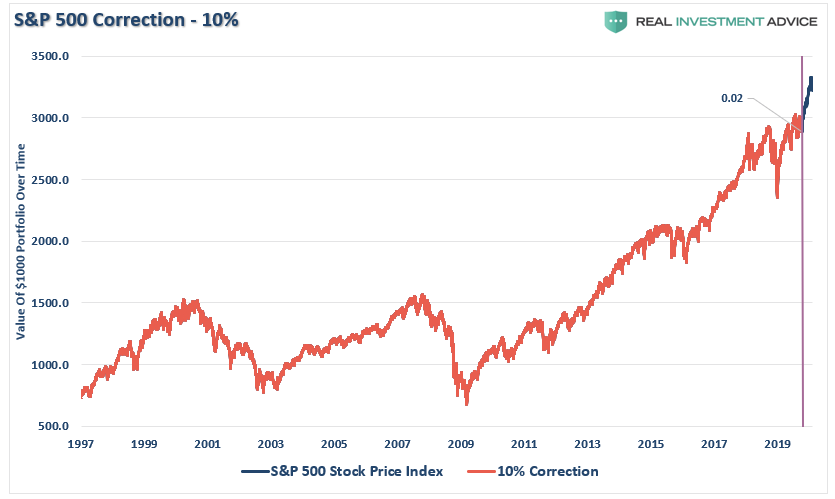
10% Correction
A correction of 10% is entirely normal for a market in any given year. While a 10% decline in a bit painful, such a decline from current levels would only set the market back October of 2019 when the Federal Reserve started their latest liquidity interventions.
20% Correction
A 20% correction from the recent highs is a bit more serious. The last time we came close to a 20% reset was in December, 2018. Try and remember how you felt during that decline.
Currently, a 20% decline would reset your portfolio back to where it was in December 2017, wiping out all the gains of the past two-years. While not the end of the world, your retirement is now set back by almost 4-years as you will have to make up the 30% gain from 2019 plus two-more years of lost growth.

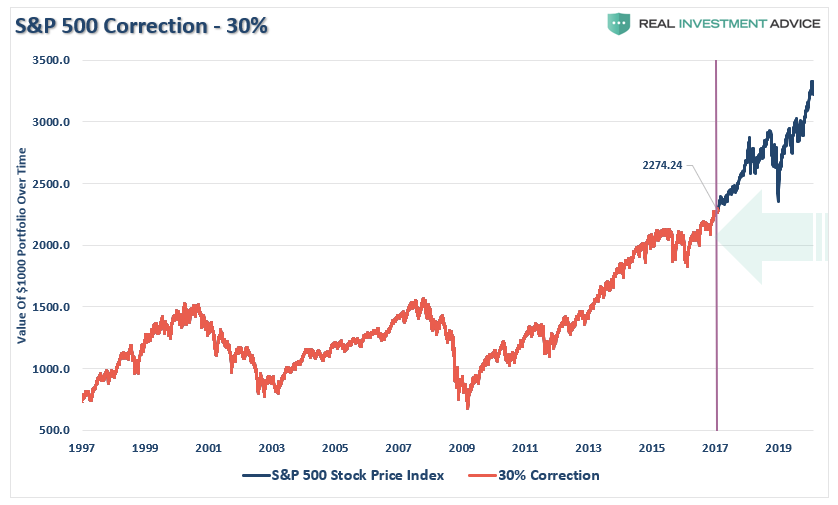
30% Correction
A 30% correction gets much more serious. A decline of this magnitude takes you back to the beginning of 2017. While losing just 3-years of growth may not seem that bad, assuming you need 6% a year to reach your retirement goal, you will need almost 9-years to recover. (Remember, it takes 42.9% to recover the 30% loss, plus you have to make up the 6% annual gains you needed, but didn’t accrue, during each year of recovering the previous loss.)

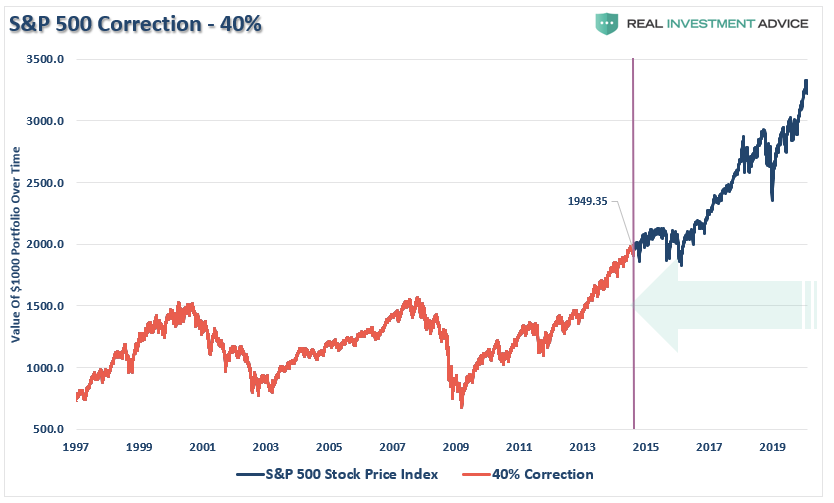
40% Correction
Okay, this is starting to get a bit uglier. A 40% decline takes the market back to 2014 levels and has now wiped out 6-years of your gains. While a 40% decline requires a 66.7% recovery to breakeven, (10 years at 6%,) the lost accrual years are going to make it very difficult to meet retirement goals.
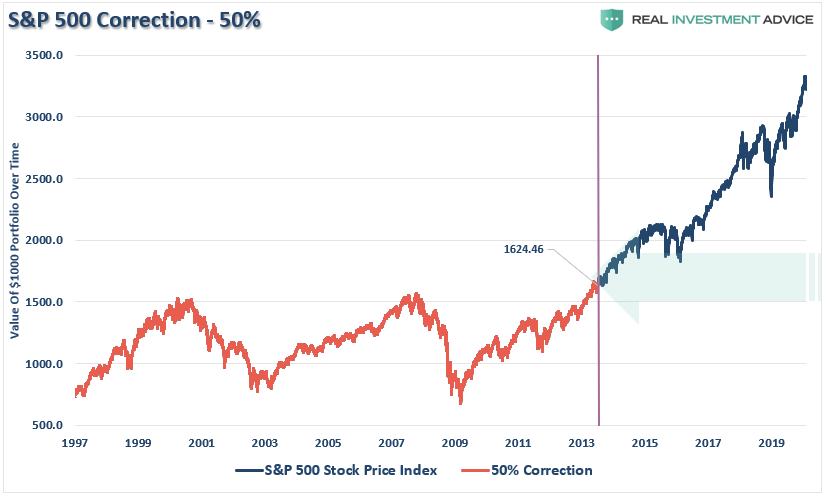
50% Correction
I know…I know…this can’t happen. (It just happened twice the century already.)
A 50% decline is effectively “game over” for investors at this point. A decline of this magnitude will reset the market essentially back to the market highs of 2000 and 2007. For individuals who were close to retirement in 2000, their portfolio, on an inflation-adjusted basis, will have been completely reset.
At this point, retiring is no longer an option for most.
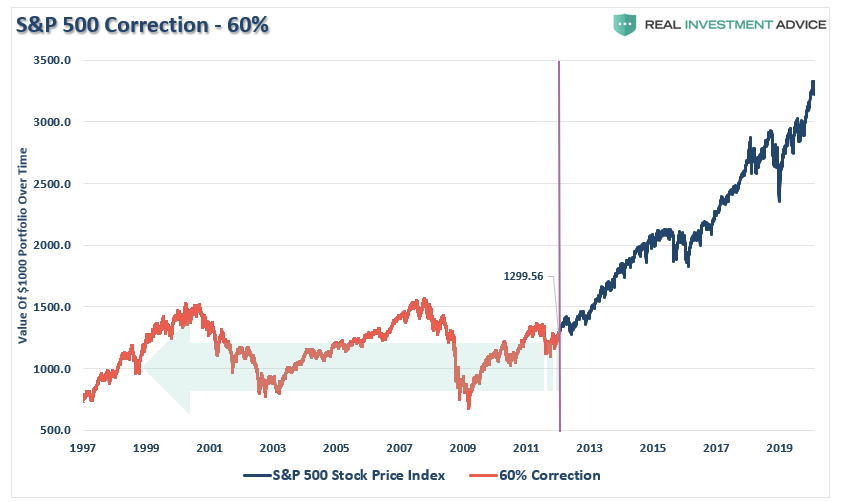
60% Correction
A 60% correction is not entirely out of the question. As I have discussed previously, the next mean reverting event will likely be the last. Corrections of such a magnitude would reset portfolios back to 1999 levels. The devastation will be greater than investors can currently imagine and retirement goals would be erased entirely.
There are numerous catalysts which could pressure such a downturn in the equity markets:
- An exogenous geopolitical event
- A credit-related event
- Failure of a major financial institution
- Recession
- Falling profits and earnings
- A loss of confidence by corporations which contacts share buybacks

Whatever the event is, which is currently unexpected and unanticipated, the decline in asset prices will initiate a “chain reaction.”
- Investors will begin to panic as asset prices drop, curtailing economic activity, and further pressuring economic growth.
- The pressure on asset prices and weaker economic growth, which impairs corporate earnings, shifts corporate views from “share repurchases” to “liquidity preservation.” This removes a major support of asset prices.
- As asset prices decline further, and economic growth deteriorates, credit defaults begin triggering a near $5 Trillion corporate bond market problem.
- The bond market decline will pressure asset prices lower, which triggers an aging demographic who fears the loss of pension benefits, sparks the $6 trillion pension problem.
- As the market continues to cascade lower at this point, the Fed is monetizing nearly 100% of all debt issuance, and has to resort to even more drastic measures to stem selling and defaults.
- Those actions lead to a further loss of confidence and pressures markets even further.
The Federal Reserve can not fix this problem, and the next “bear market” will NOT be like that last.
It will be worse.
None of this will happen, you say?
Maybe? I certainly hope not.
But are you actually willing to bet your retirement on it?

