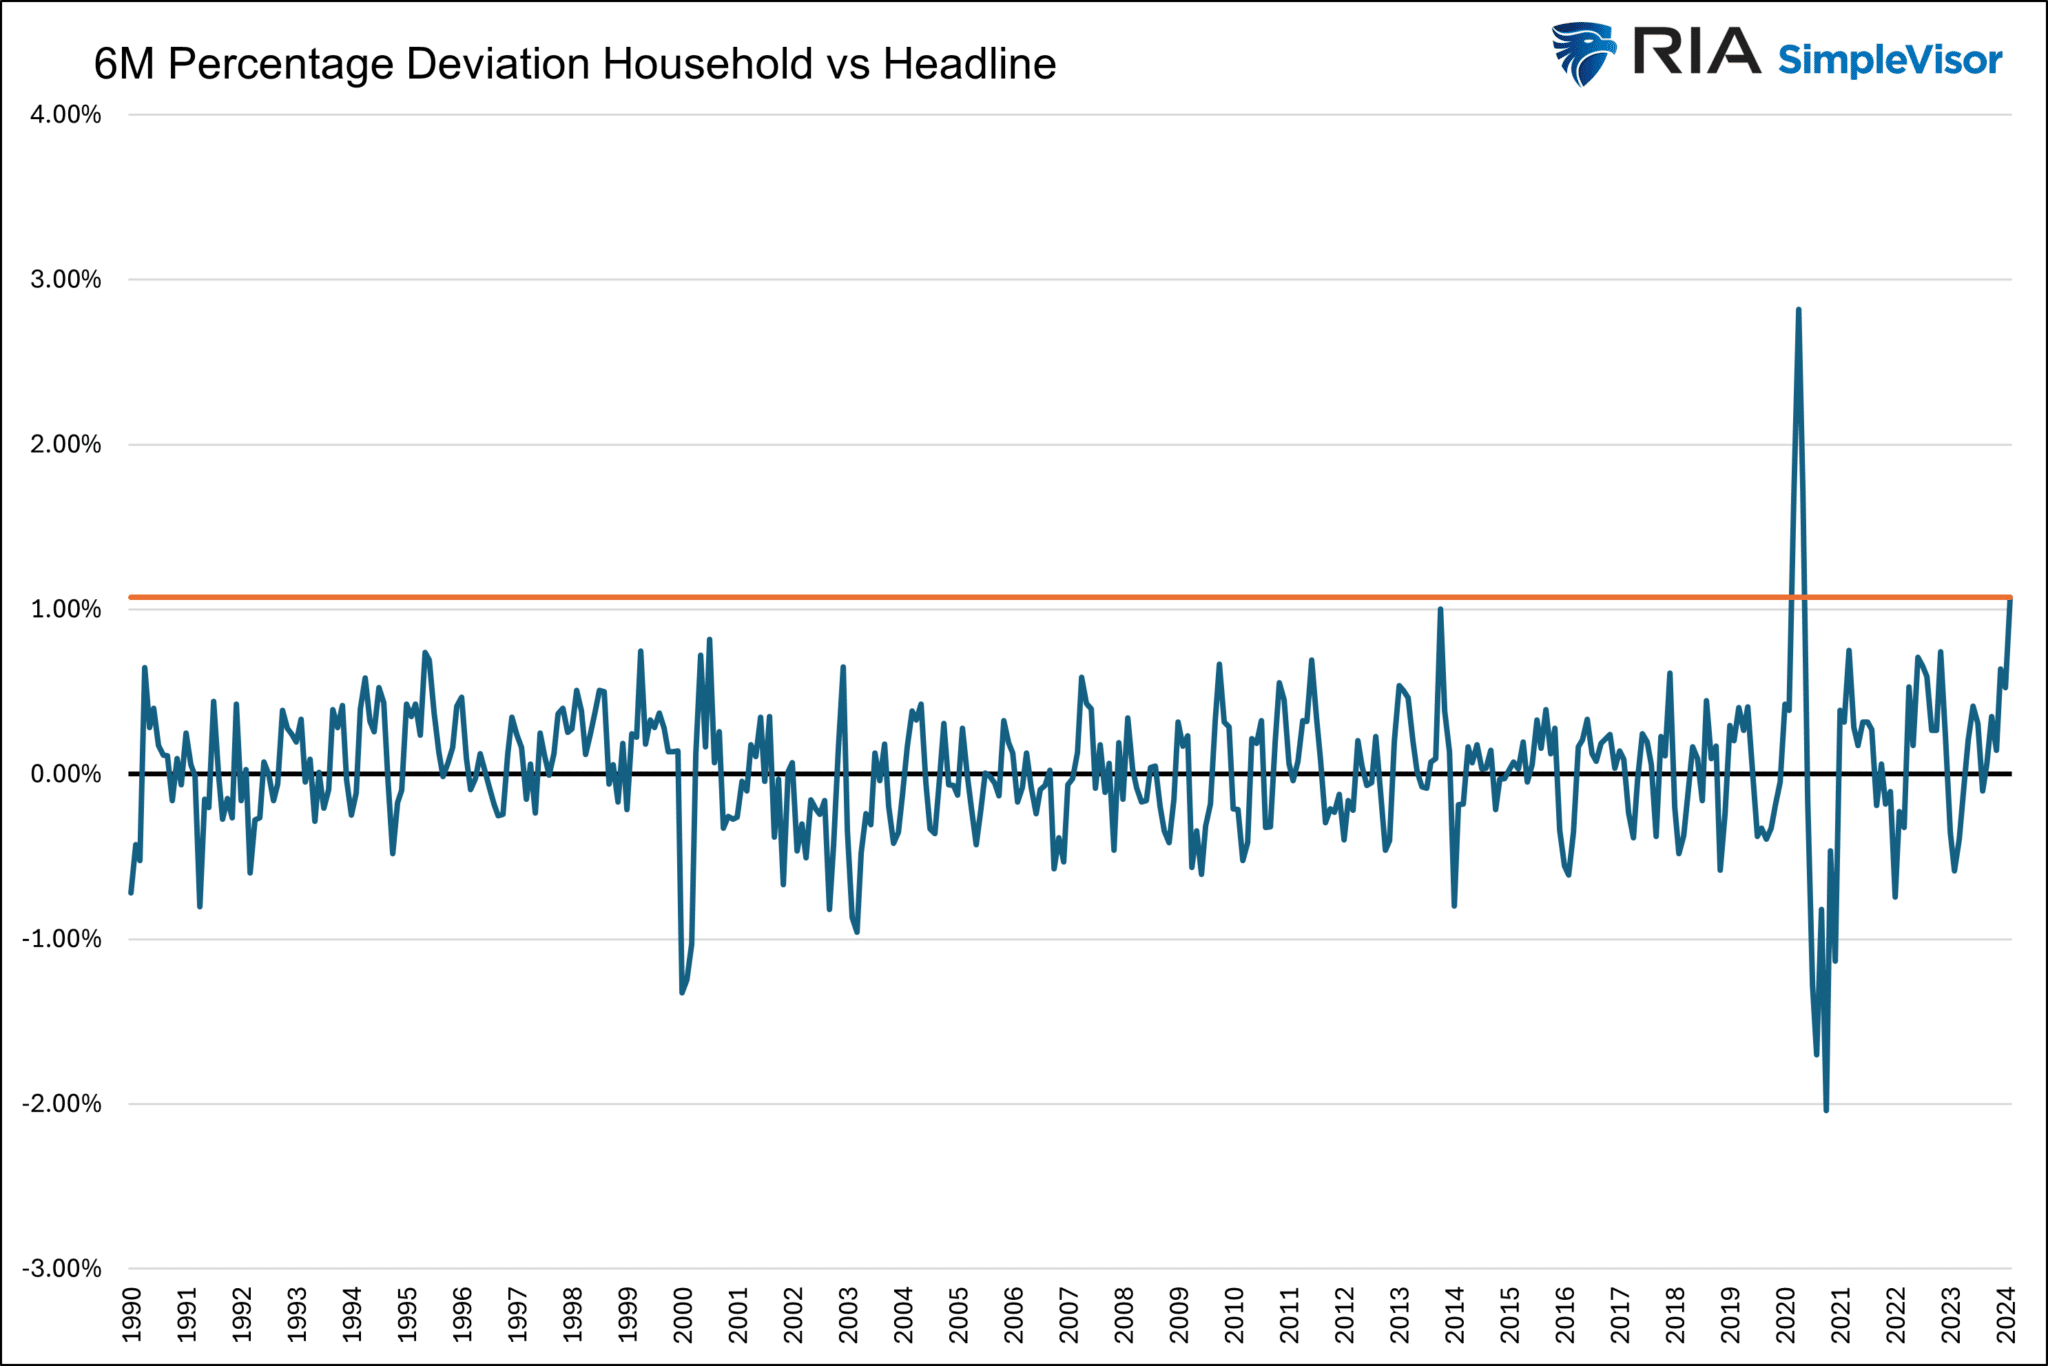
Friday’s employment data from the BLS was a mixed bag. The closely followed nonfarm payrolls number grew by 275k jobs, decently above expectations of +190k. Despite the seemingly strong number, the unemployment rate rose by 0.2% to 3.9%. Last month’s scorching gain of 353k jobs was revised lower to 229k. You may wonder why the unemployment rate ticked up if the number of jobs increased. Typically, this occurs because the labor participation rate, or the number of people in the workforce, changes. That was not the case in Friday’s report. The culprit is the difference between the household survey, which is used for the unemployment calculation, and the establishment survey, also known as the headline survey, which feeds the headline payroll number.
Historically, the two data points move in lockstep. However, since August, the household survey shows the economy lost 532k jobs, while the headline survey shows the addition of 1,328k jobs. A clue as to which survey, household, or headline might be correct can be found in the hourly wages and ADP data. A robust jobs market, as portrayed by the headline number, should lead to good wage growth. Wage growth inched higher by 0.1%, the lowest in over two years. ADP is consistently reporting job growth of 100-125k. Both data sets reflect a growing but sub-par job market, not what the household or headline surveys tell us.
What To Watch Today
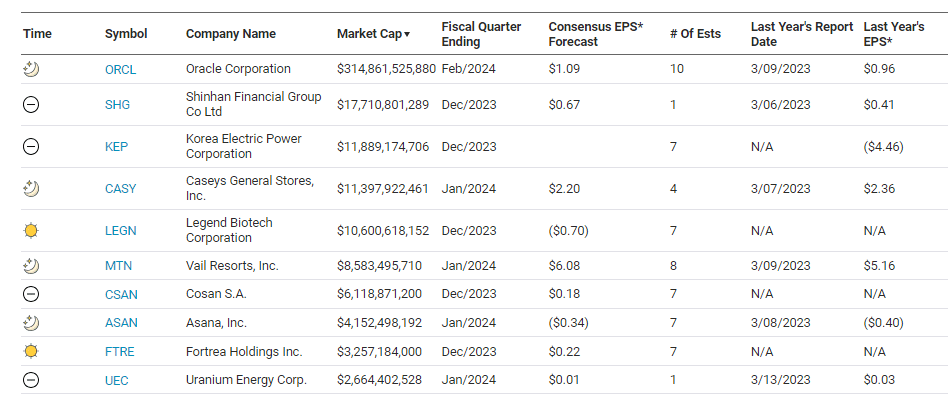
Earnings
Economy
- No notable economic reports
Market Trading Update
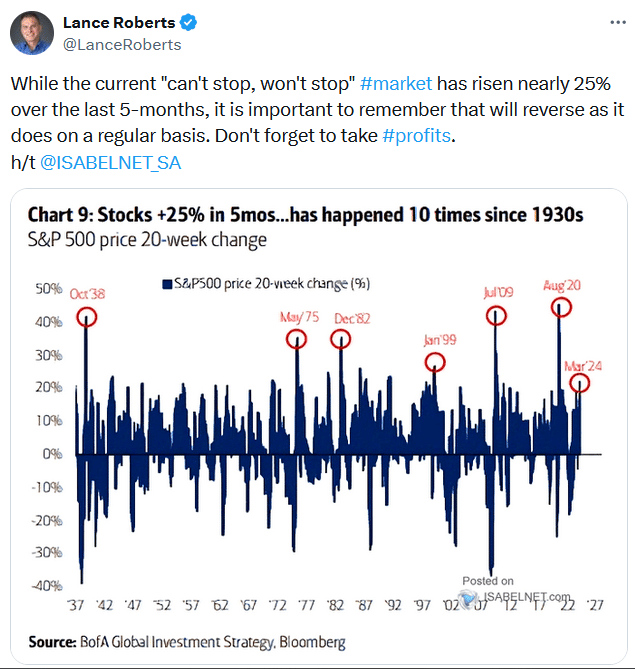
Last week, the ongoing “can’t stop, won’t stop” bullish trend remained firmly intact. As we noted then:
“That remains the case this past week. While the overall market traded higher into the end of the week, setting new all-time highs, the bullish November trend remains intact. While the market remains confined to that narrow rising trend channel, the MACD “buy signal” remains elevated, and an apparent deterioration in the market’s momentum remains.”
That was the case again this week, as the market tested the 20-DMA, the bottom of the trend channel, early in the week, which sparked buyers to push the index to all-time highs by the week’s end. At the same time, volatility remains compressed, with the deviation from the 200-DMA growing. As shown, the breadth of the market and momentum are both negatively diverging from the rising market, which historically serves as a warning.
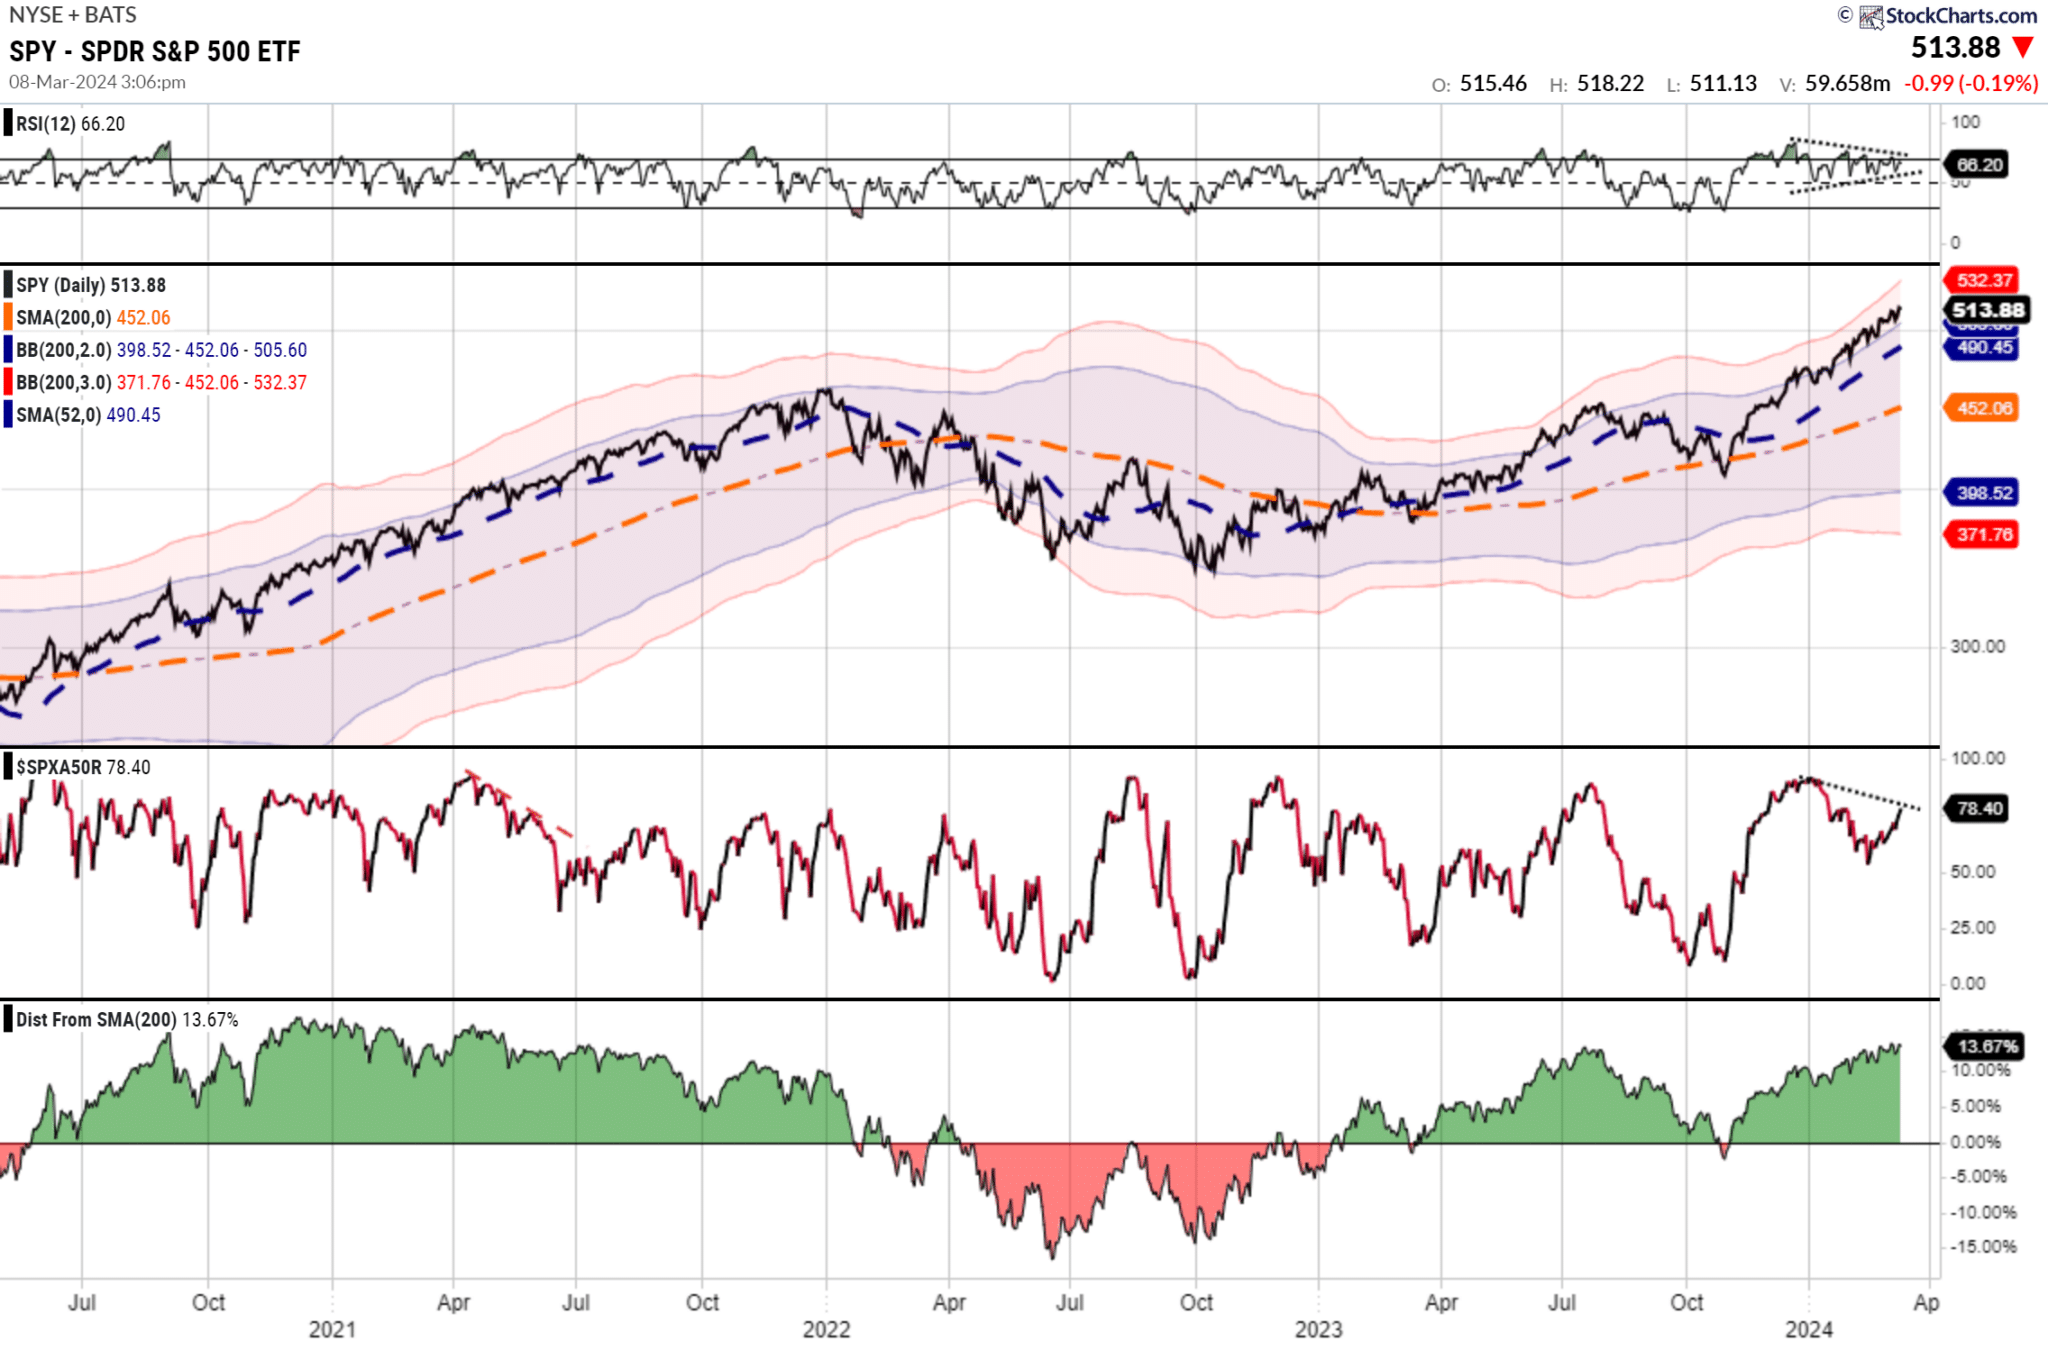
While we have become increasingly cautious over the last few weeks as the market continues to rise, we have suggested taking profits and rebalancing portfolio risks. If you have not done so, this remains a recommended course of action. However, this does not mean aggressively reducing equity allocations.
As noted, the market remains in a bullish trend. The 20-DMA, the bottom of the trend channel, will likely serve as an initial warning sign to reduce risk when it is violated. That level has repeatedly seen “buying programs” kick in and suggests that violating that support will cause the algos to start selling. Such a switch in market dynamics would likely lead to a 5-10% correction over a few months. At that point, we will reduce equity positioning and aggressively implement hedging strategies.

The Week Ahead
With employment in the rearview mirror, investors will turn their focus to inflation, retail sales, and the Fed. The all-important CPI data, coming out tomorrow, is expected to show an increase of 0.4%. Economists expect PPI on Thursday to rise 0.3%. The holiday season hangover resulted in a 0.8% decline in retail sales last month. Expectations are that Thursday’s retail sales report will show a gain of 0.5%.
In addition to digesting CPI, PPI, and retail sales alongside harboring any consternation about what the Fed may say at its upcoming March 20th meeting, bond investors will absorb a fresh round of 10 and 30 bonds from the U.S. Treasury.
The Fed will go on a media blackout this week.
Expect More Underwhelming Economic Data
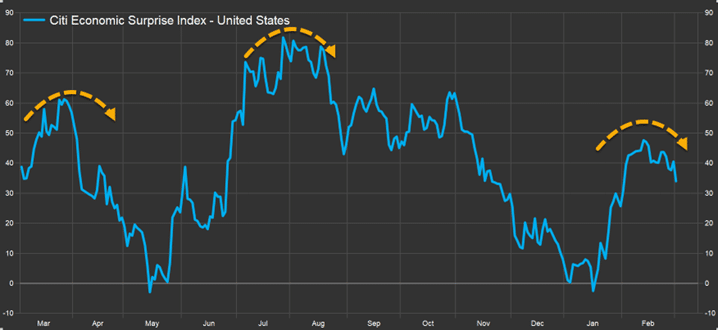
Economic data over the last few weeks has generally underwhelmed economists’ expectations. Consequently, as we share below, the Atlanta Fed GDPNow estimate for Q1 GDP growth has shrunk from over 4.0% to 2.5%. We should begin to consider whether recent data is an early sign that economic activity is weakening or just a few bad numbers affected by seasonal factors.
The second graph below may help us answer the question. The Citi Economic Surprise measures how economic data compares to economists’ estimates of said data. As we share in the second graph, the index tends to cycle reliably higher and lower. It appears to be turning lower. Accordingly, we may be in for a spate of weak economic data until economists adjust their forecasts. Bouts of weaker-than-expected economic data are common in robust economies and recessions, so try not to read too much into it. On the other hand, the Atlanta Fed GDPNow graph will be more concerning if it continues to decline.
Tweet of the Day
“Want to have better long-term success in managing your portfolio? Here are our 15-trading rules for managing market risks.”
Please subscribe to the daily commentary to receive these updates every morning before the opening bell.
If you found this blog useful, please send it to someone else, share it on social media, or contact us to set up a meeting.
Also Read