


Goldman Sachs released its 2024 forecast for the S&P 500 and the economy.
“We forecast the S&P 500 index will end 2024 at 4700, representing a 12-month price gain of 5% and a total return of 6% including dividends. Our baseline assumption during the next year is that the US economy continues to expand at a modest pace and avoids a recession, earnings rise by 5%, and the equity market’s valuation equals 18x, close to the current P/E level.”
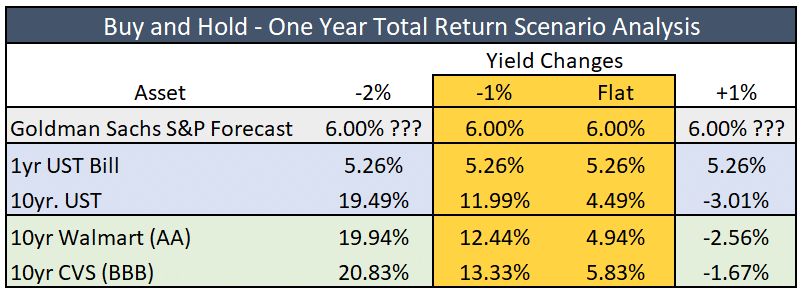
While relatively optimistic on the economic front, it leaves investors with tough decisions. Goldman’s 6% total return forecast for the S&P 500 is slightly below historical average but not a bad return. However, there are safer alternatives that may be more tempting.
Currently, risk-free one-year Treasury bills yield 5.26%, and ten-year Treasury notes are 4.51%. Take some credit risk in the corporate bond markets, and one can earn higher returns. If Goldman proves correct, inflation is likely to stay at current levels or lower. Accordingly, bond yields are likely to fall or, in the worst case, remain around current levels. The table below compares potential returns for stocks and bonds. The gold box shows the performance returns that Goldman’s scenario would likely produce. If yields decline by 2%, it’s likely the economy will be in a recession, and Goldman’s stock forecast is likely too high. Conversely, if yields rise 1% or more, it’s also probable stocks underperform their forecast. Even if Goldman proves correct, less risky bond alternatives are worth considering.
What To Watch Today
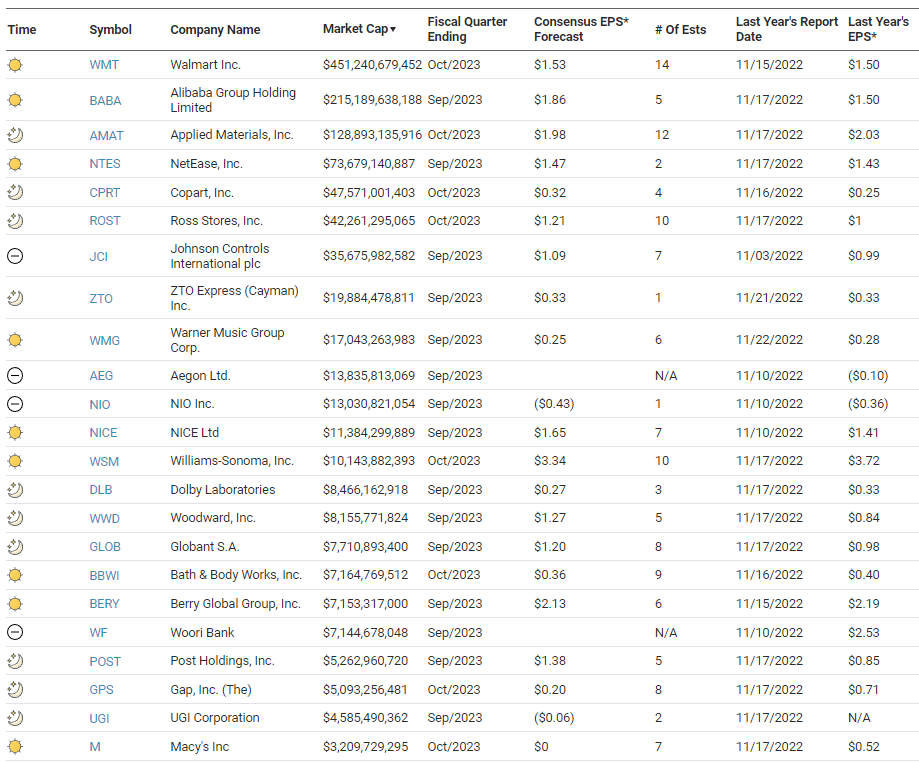
Earnings
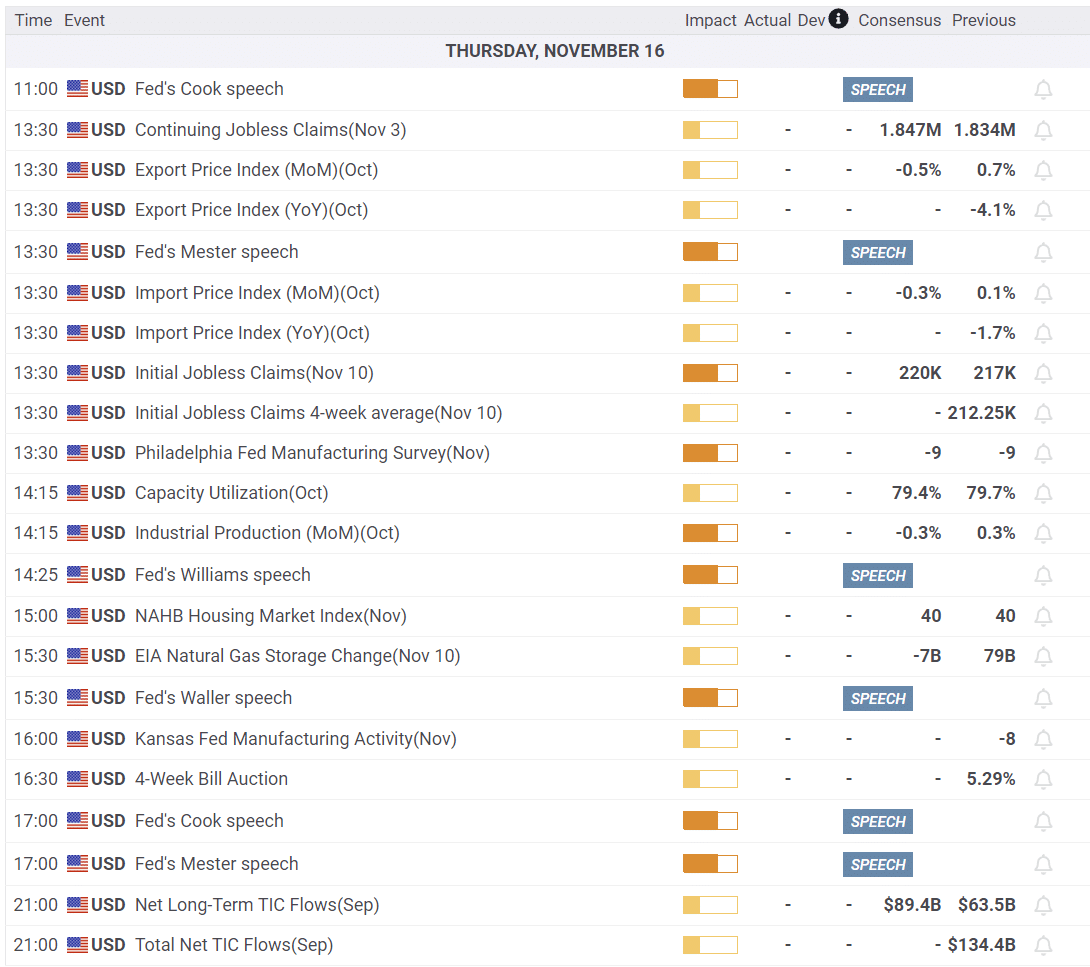
Economy
Market Trading Update
In the November 6th Daily Market Commentary, we presented projections for a Fibonacci retracement as the market approached the previous downtrend. To wit:
“We pushed through the 50% retracement level, which is also the 50-DMA. As noted above, that clears the way for a rally higher with a more bullish tone. That now sets the next targets at the 61.8% and 78.6% levels, then this year’s highs. While the highs are certainly possible, it is most likely a low-probability event.”
Since then, the market has pushed much higher than expected in such a short period. The market has completed a 78.6% retracement and has returned to a very overbought status. It is indeed possible that the markets will attempt a push to this year’s highs. However, such will likely not happen without a short-term correction or consolidation to reset the market for another push higher.
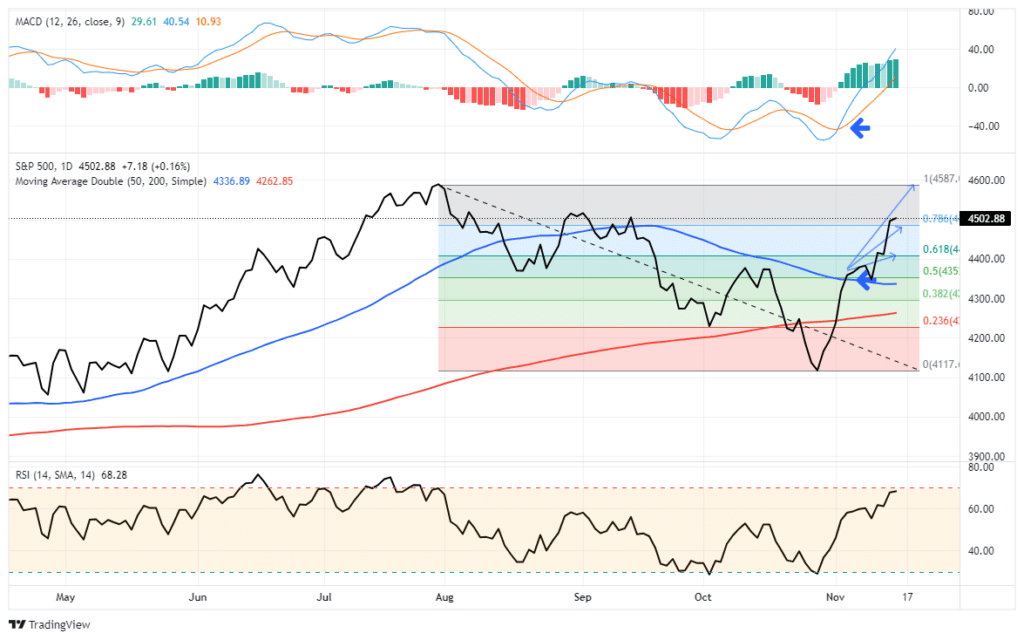
The market is very bullish, and short-term corrections should be used to add equity exposure as needed. As we noted in that previous commentary:
“The market is oversold, and the recent selling pressure across all assets is nearing exhaustion. If you are worried about what is happening overseas or with the Fed and the economy, use rallies to reduce risk at better price levels.”
- Tighten up stop-loss levels to current support levels for each position.
- Hedge portfolios against more significant market declines.
- Take profits in positions that have been big winners.
- Sell laggards and losers.
- Raise cash and rebalance portfolios to target weightings.
With the markets now overbought versus oversold, this is an excellent time to clean up portfolios for a year-end advance.

Recession Or Normalization?
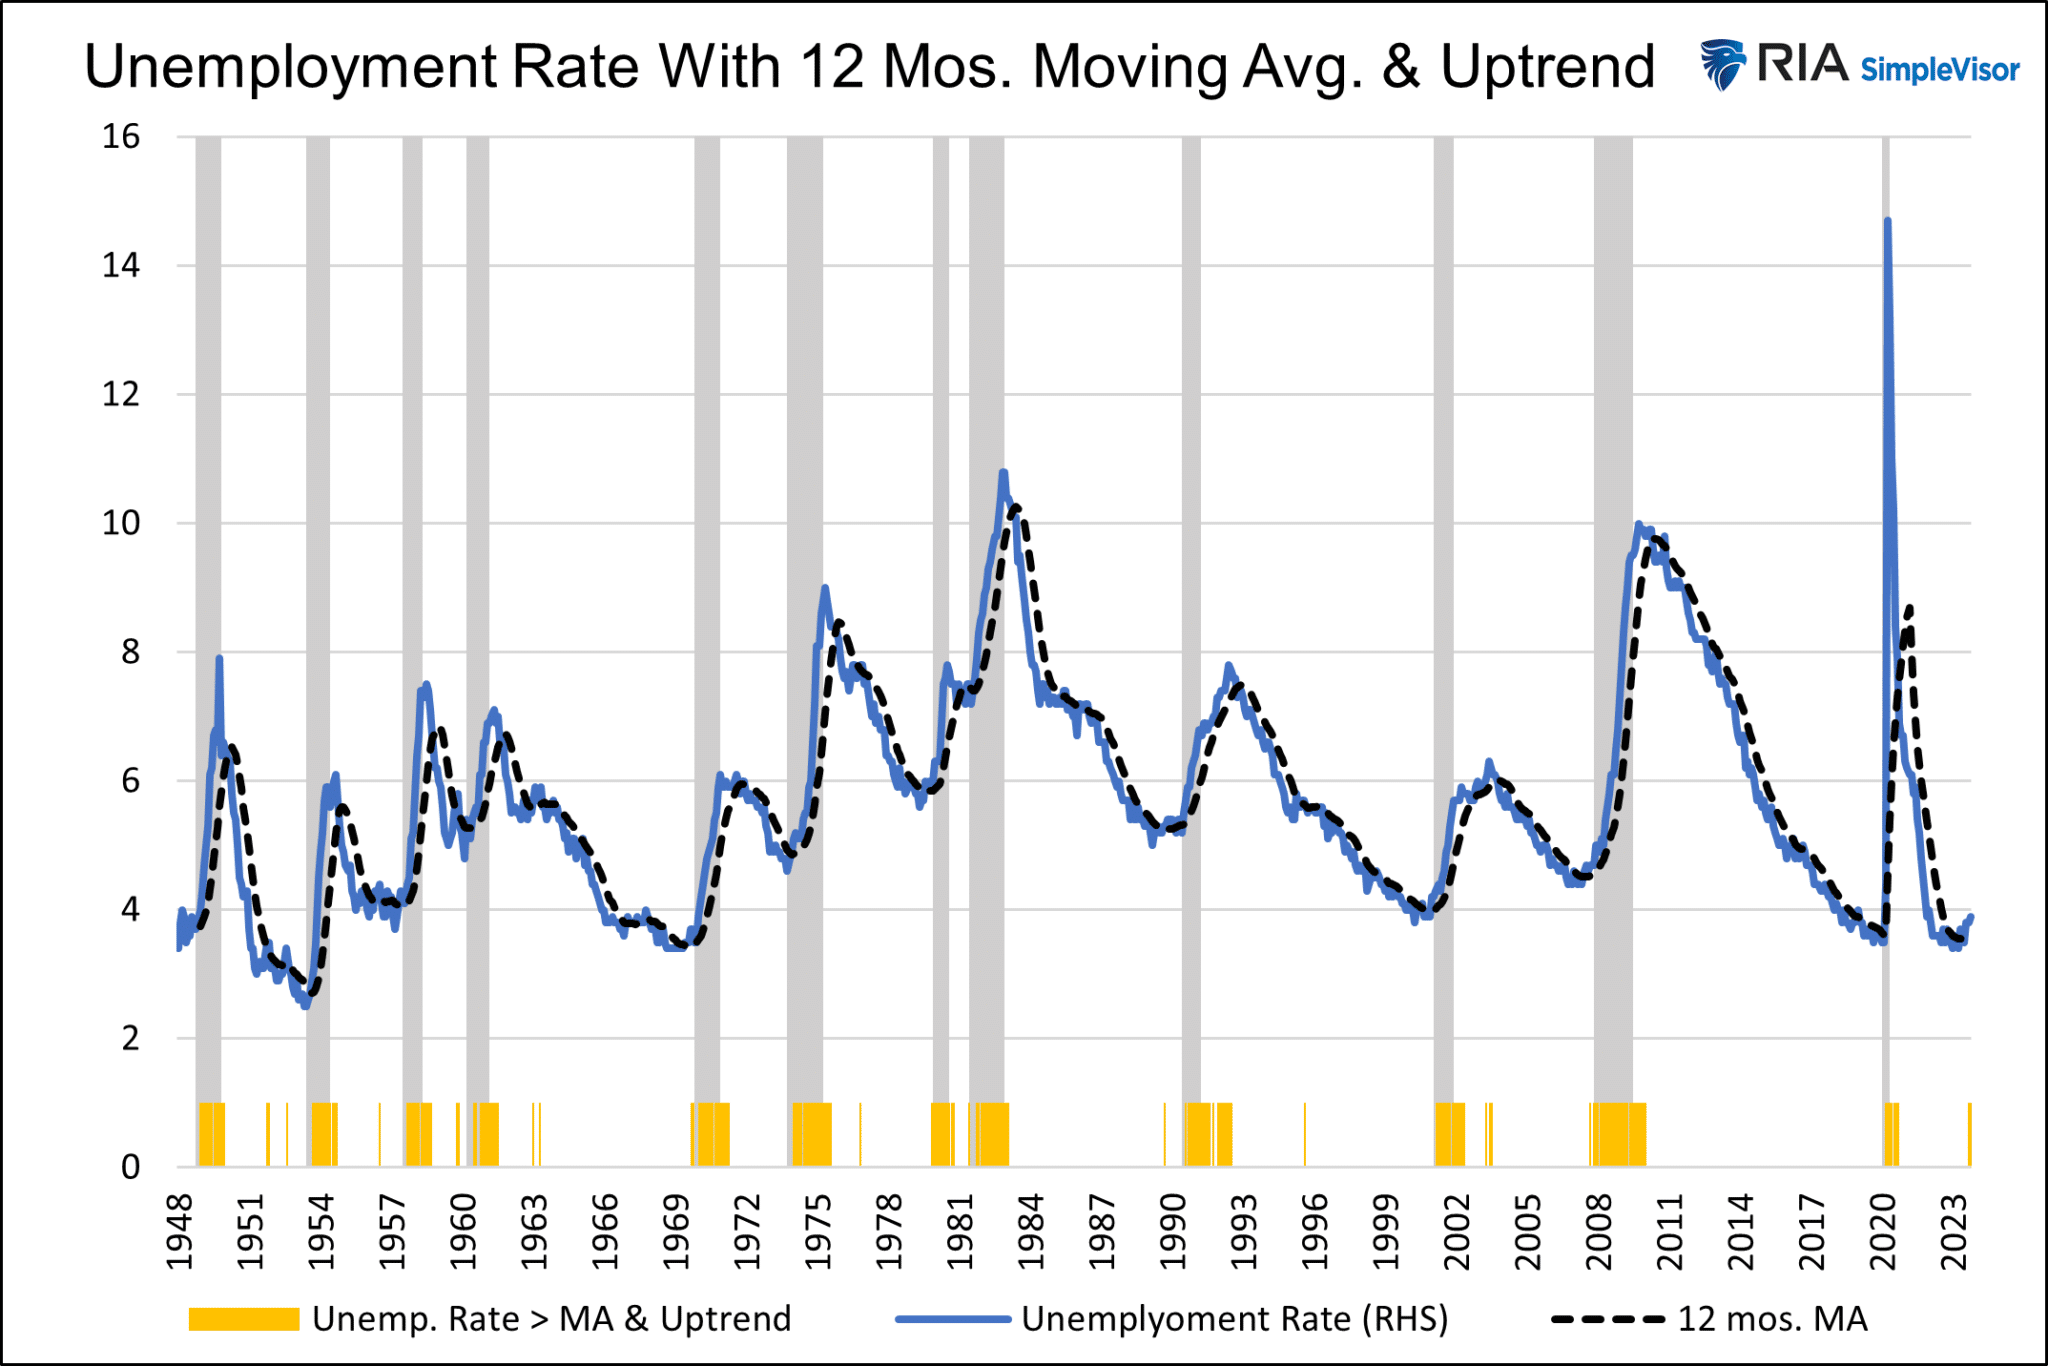
The labor market and its effect on inflation is paramount to Fed decision-making. Consequently, we just published Employment Is Sending Signals to help readers better assess the job market. It is well known that the unemployment rate is most often either rising or falling. It spends very little time stagnating. As such, trend changes in the unemployment rate are critical for forecasting a recession.
To help spot a new unemployment rate trend, we created a more conservative version of the Sahm rule and incorporated a moving average. To wit:
Our warning occurs if the unemployment rate crosses above its 12-month moving average and the unemployment rate has risen by .3% or more over the last six months.
We highlight these instances in yellow below. Since 1948, our tool signaled every recession with only a few false signals. Other than the false alarm in 1996, the other signals occurred slightly before a recession or in the aftermath of one.
Our model, shown below, just triggered a recession warning. However, given the abnormal amount of fiscal and monetary stimulus surrounding the pandemic, we must ask if the recent trend change is just the process of economic normalization or if a recession is coming shortly.
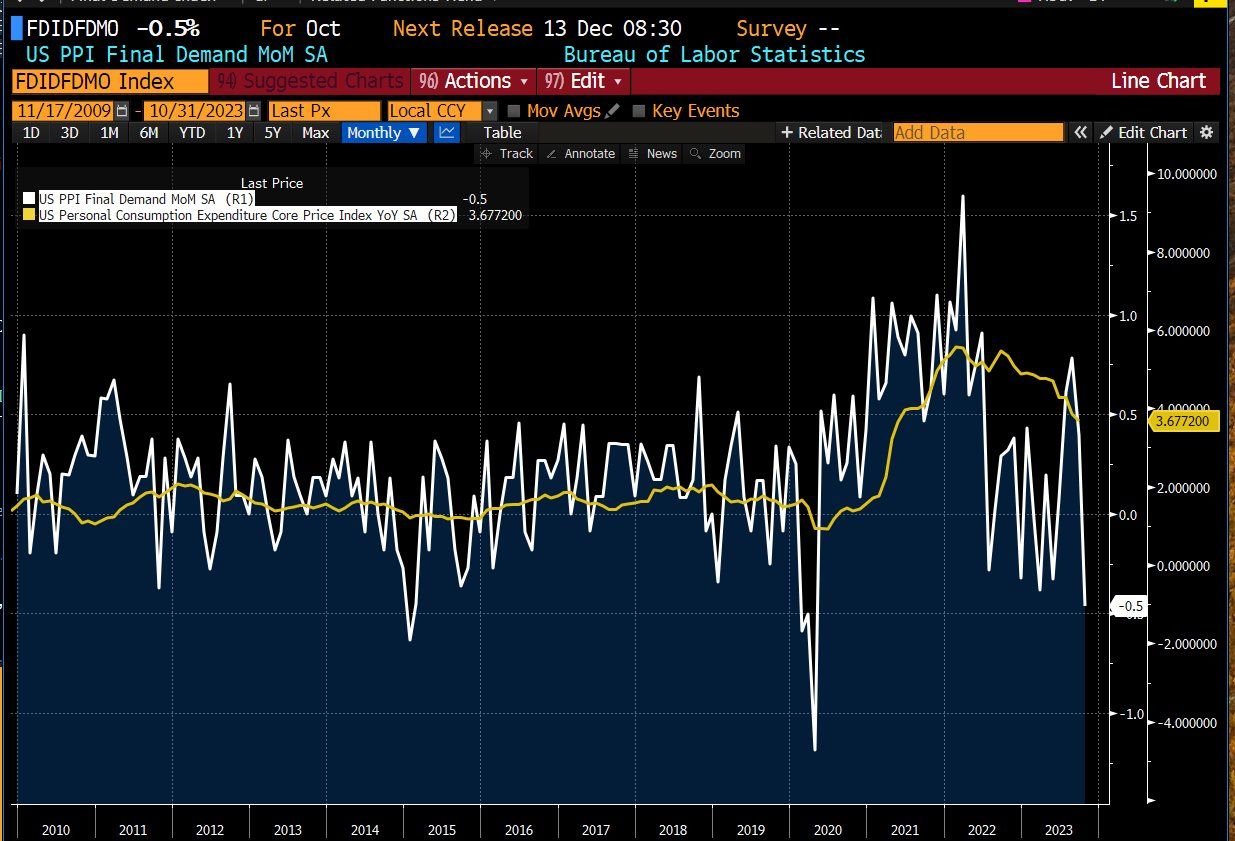
PPI and Retail Sales
Like CPI, PPI came in lower than expected. The monthly headline number was -0.5% versus a downwardly revised +0.4% from the previous month. It was decently below expectations for a 0.1% gain. You have to go back to the second month of the pandemic, in April 2020, to find a lower monthly print. Before that, -0.5% is the lowest monthly figure since 2014, as shown below. Core PPI, excluding food and energy, was 0.0% versus expectations of +0.2%.
Year over year, PPI prices are down to +1.3%, reversing the upward trend of the prior few months. Core year over year is +2.4%, .30% below expectations. You’d have to return to January 2021 for a lower read.
October retail sales came in at -0.1%, slightly better than the -0.2% expected, but this follows an upwardly revised +0.9% from the previous month. The control group, which feeds GDP, was in line with expectations at +0.2% and well off the upwardly revised +0.7% from last month.
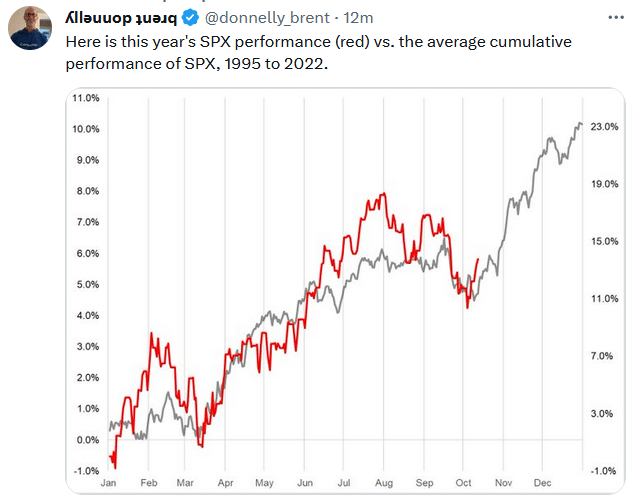
Tweet of the Day
Please subscribe to the daily commentary to receive these updates every morning before the opening bell.
If you found this blog useful, please send it to someone else, share it on social media, or contact us to set up a meeting.
Also Read


