


In February 2023, we wrote Janet Yellen Should Focus On HOPE. The article walks through Michael Kantrowitz’s HOPE model. HOPE, or Housing, New Orders (ISM), Corporate Profits, and Employment, provides a handy acronym to track parts of the economy that are interest rate sensitive and tend to be leading recession indicators.
As we wrote in the article:
These sectors often serve as leading economic indicators. As interest rates dampen economic activity in interest rate-sensitive sectors, other sectors and facets of the economy begin to feel the impact of higher rates. HOPE illustrates the various lags or the time it takes for rate hikes to affect economic activity fully.
Over the last year, many H, O, and P measures indicate a recession is likely. E, employment, has been the lone holdout. However, there are recent signs employment trends are starting to change. Given rising unemployment may be the straw that breaks the back of the economic recovery, let’s look at some leading employment indicators to see what they indicate.
If a recession is on the horizon, these employment indicators should provide a warning. However, as you look at our graphs and read our commentary, consider that weakening labor statistics may reflect the normalization of labor conditions and not necessarily an imminent recession as they may have in the past.
Construction Employment
The H in HOPE is housing. Given the economic significance of new and used home sales and the construction of single and multifamily homes, we review the housing construction labor market and its prospects.
As is to be expected, with mortgage rates near 8%, housing activity has ground to a halt. The only sign of life is from new home sales. Homebuilders offer buyers mortgage rates 3% or so below current rates to sell homes. While successful, homebuilder sentiment is waning and is now at 7-month lows. The following comes from our September 20, 2023 Daily Commentary:
“Higher mortgage rates are resulting in a shortage of inventory of used homes and a surge in new homebuilding. Recent data shows a third of all homes for sale are new homes. That is almost three times the average ratio. While homebuilders have been taking advantage of the low inventory situation by offering home buyers reduced mortgage rates and other discounts, it appears they are starting to have concerns. The most recent NAHB builder confidence survey fell to 45. A reading below 50 means there are more homebuilders with negative sentiment than positive sentiment.”
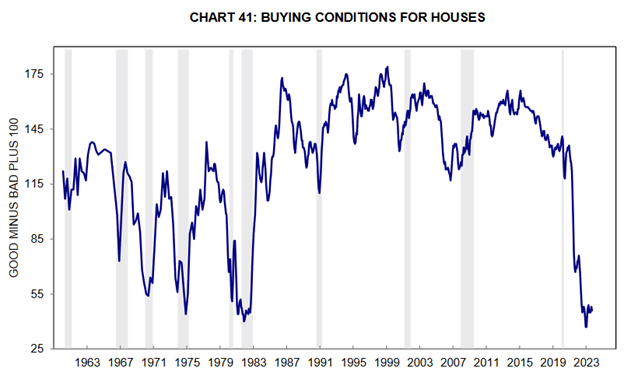
The chart below from the University of Michigan Consumer Sentiment Survey shows that consumers think buying conditions are among the worst since 1960.
Housing starts, a good leading indicator for housing construction employment, peaked in April 2022 at 1,803 units. Since then, it has fallen by about 30% to 1,269 units. Multifamily (five or more units) starts topped simultaneously and has decreased by 54%. Residential construction employment has been unchanged since January. Still, it is likely to fall as construction on existing projects will soon finish, and there will be fewer new construction projects for the current laborers.
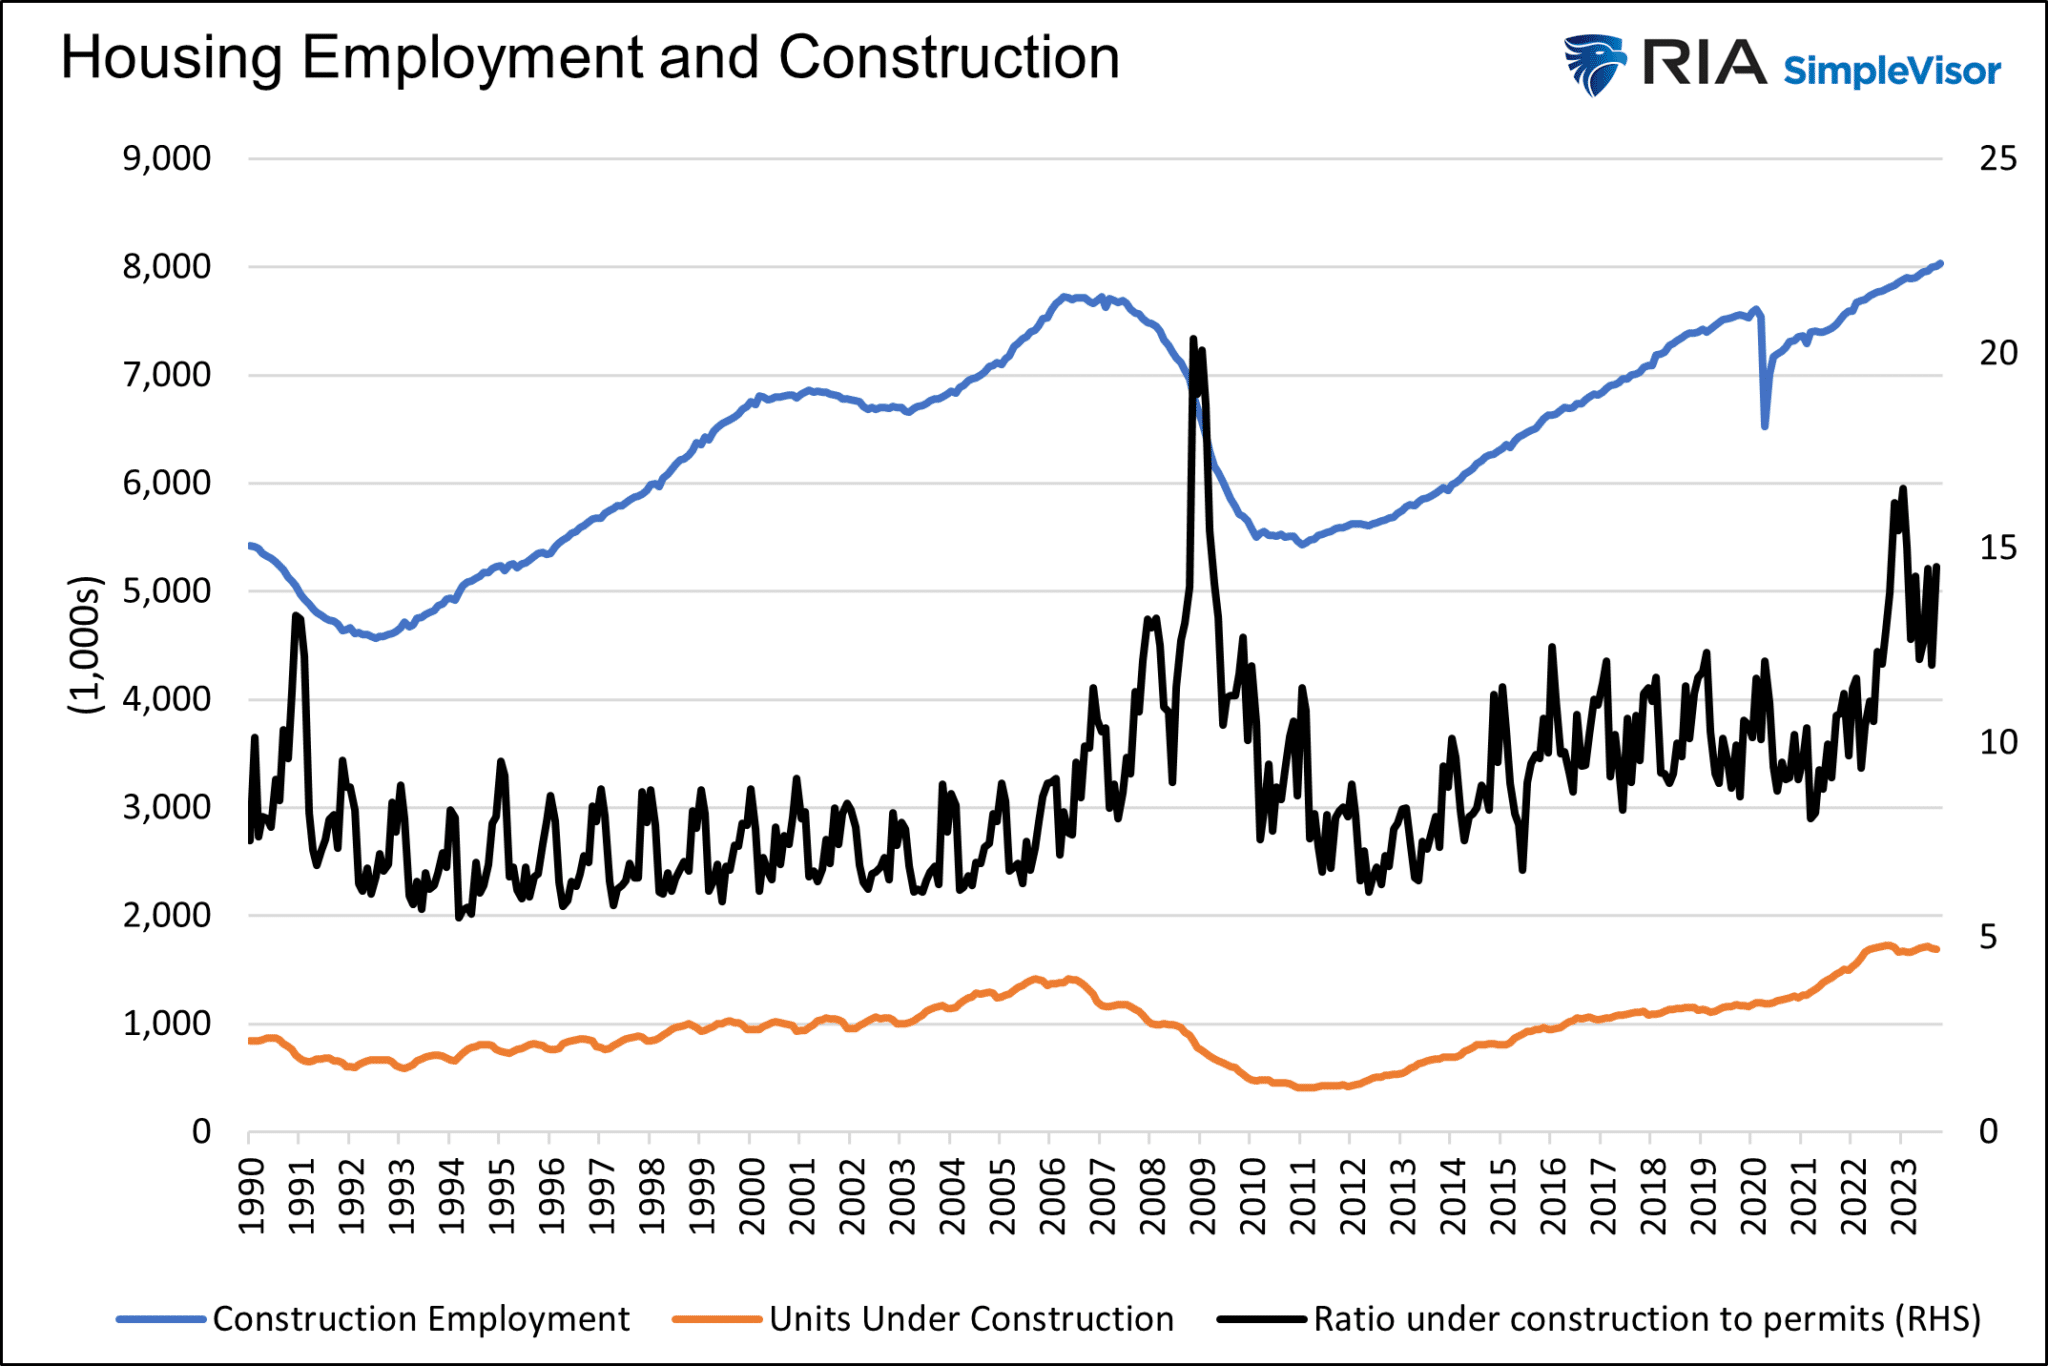
As shown below, construction employment trends with the number of housing units under construction. Currently, the number of units under construction and construction employment are at record highs. However, the number of permits and newly started projects is falling.
The black line shows the ratio of units under construction to permits (but not started). The ratio is rising as there are fewer newly permitted projects than current ones. As we saw in 1990 and 2008, that may bode poorly for construction employment.

Temporary Help Employees And Teens
Temporary workers and the youth are typically the most expendable employees. Further, they often have little allegiance to the company and are financially the cheapest to let go. Further, they usually work in the most economically sensitive sectors.
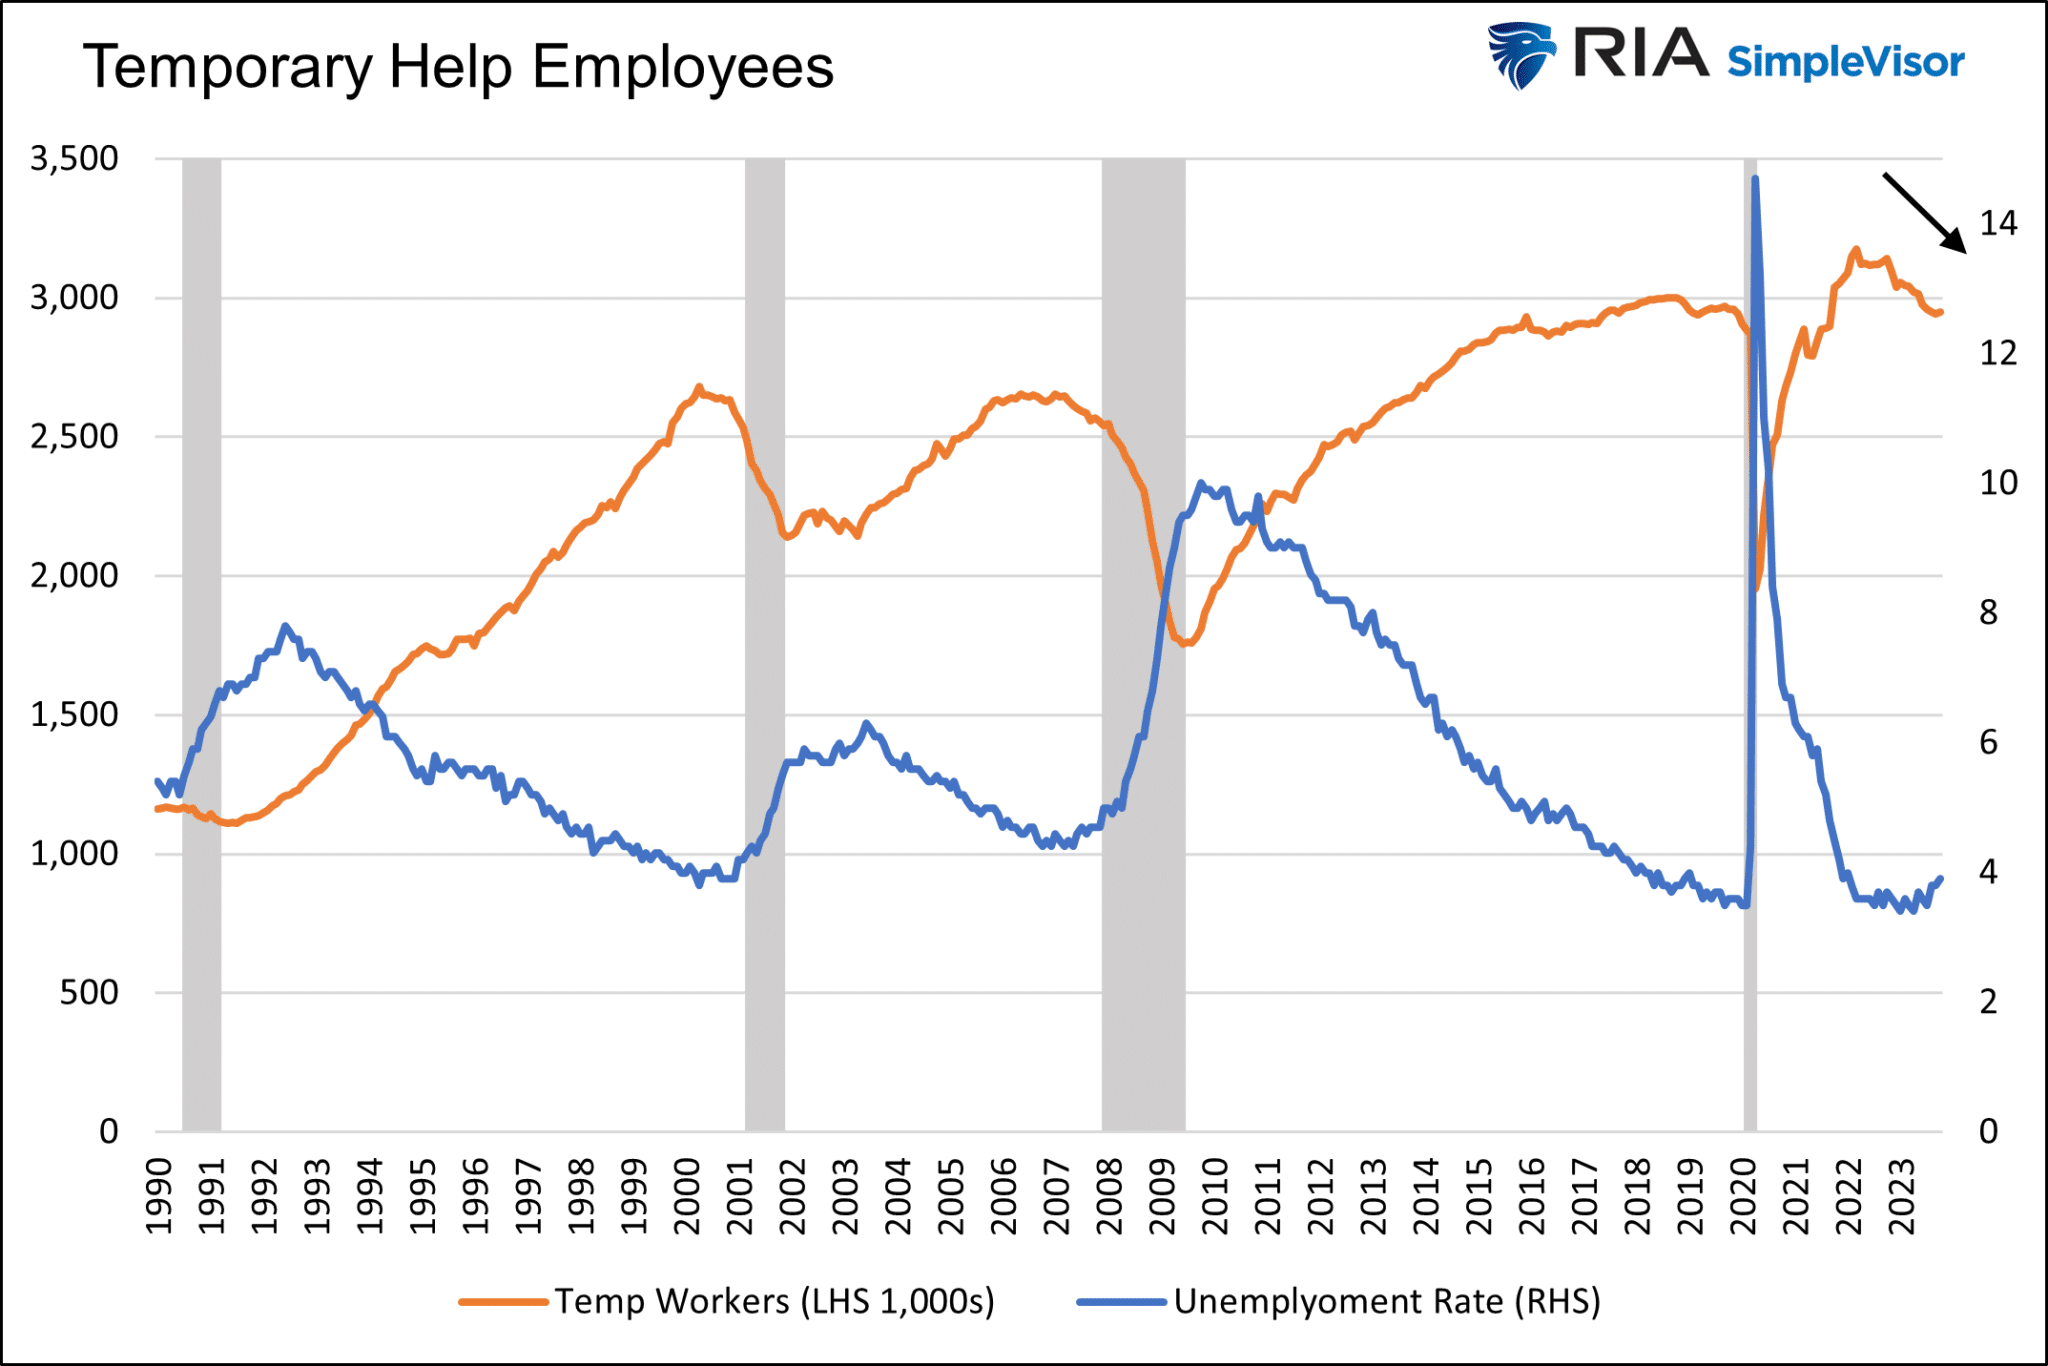
The graph below shows the number of temporary workers commonly declines as the unemployment rate rises. Temporary employment generally peaks before recessions and declines during them. It increases consistently during periods of growth.
The number of temporary workers has been falling since March 2022. In the prior thirty years, there were very few instances where the number of temporary workers declined in a growth cycle. Those that did occur were very short-lived. This instance stands out like a sore thumb and may likely be a precursor to a higher unemployment rate.
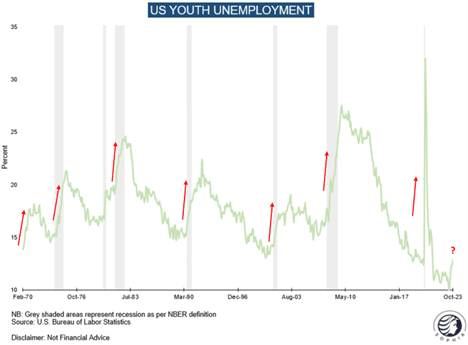
The following graph, courtesy of Florian Kronawitter’s article Will It Hold, shows that youth unemployment is rising rapidly, albeit the current level is still amongst the lowest since 1970.
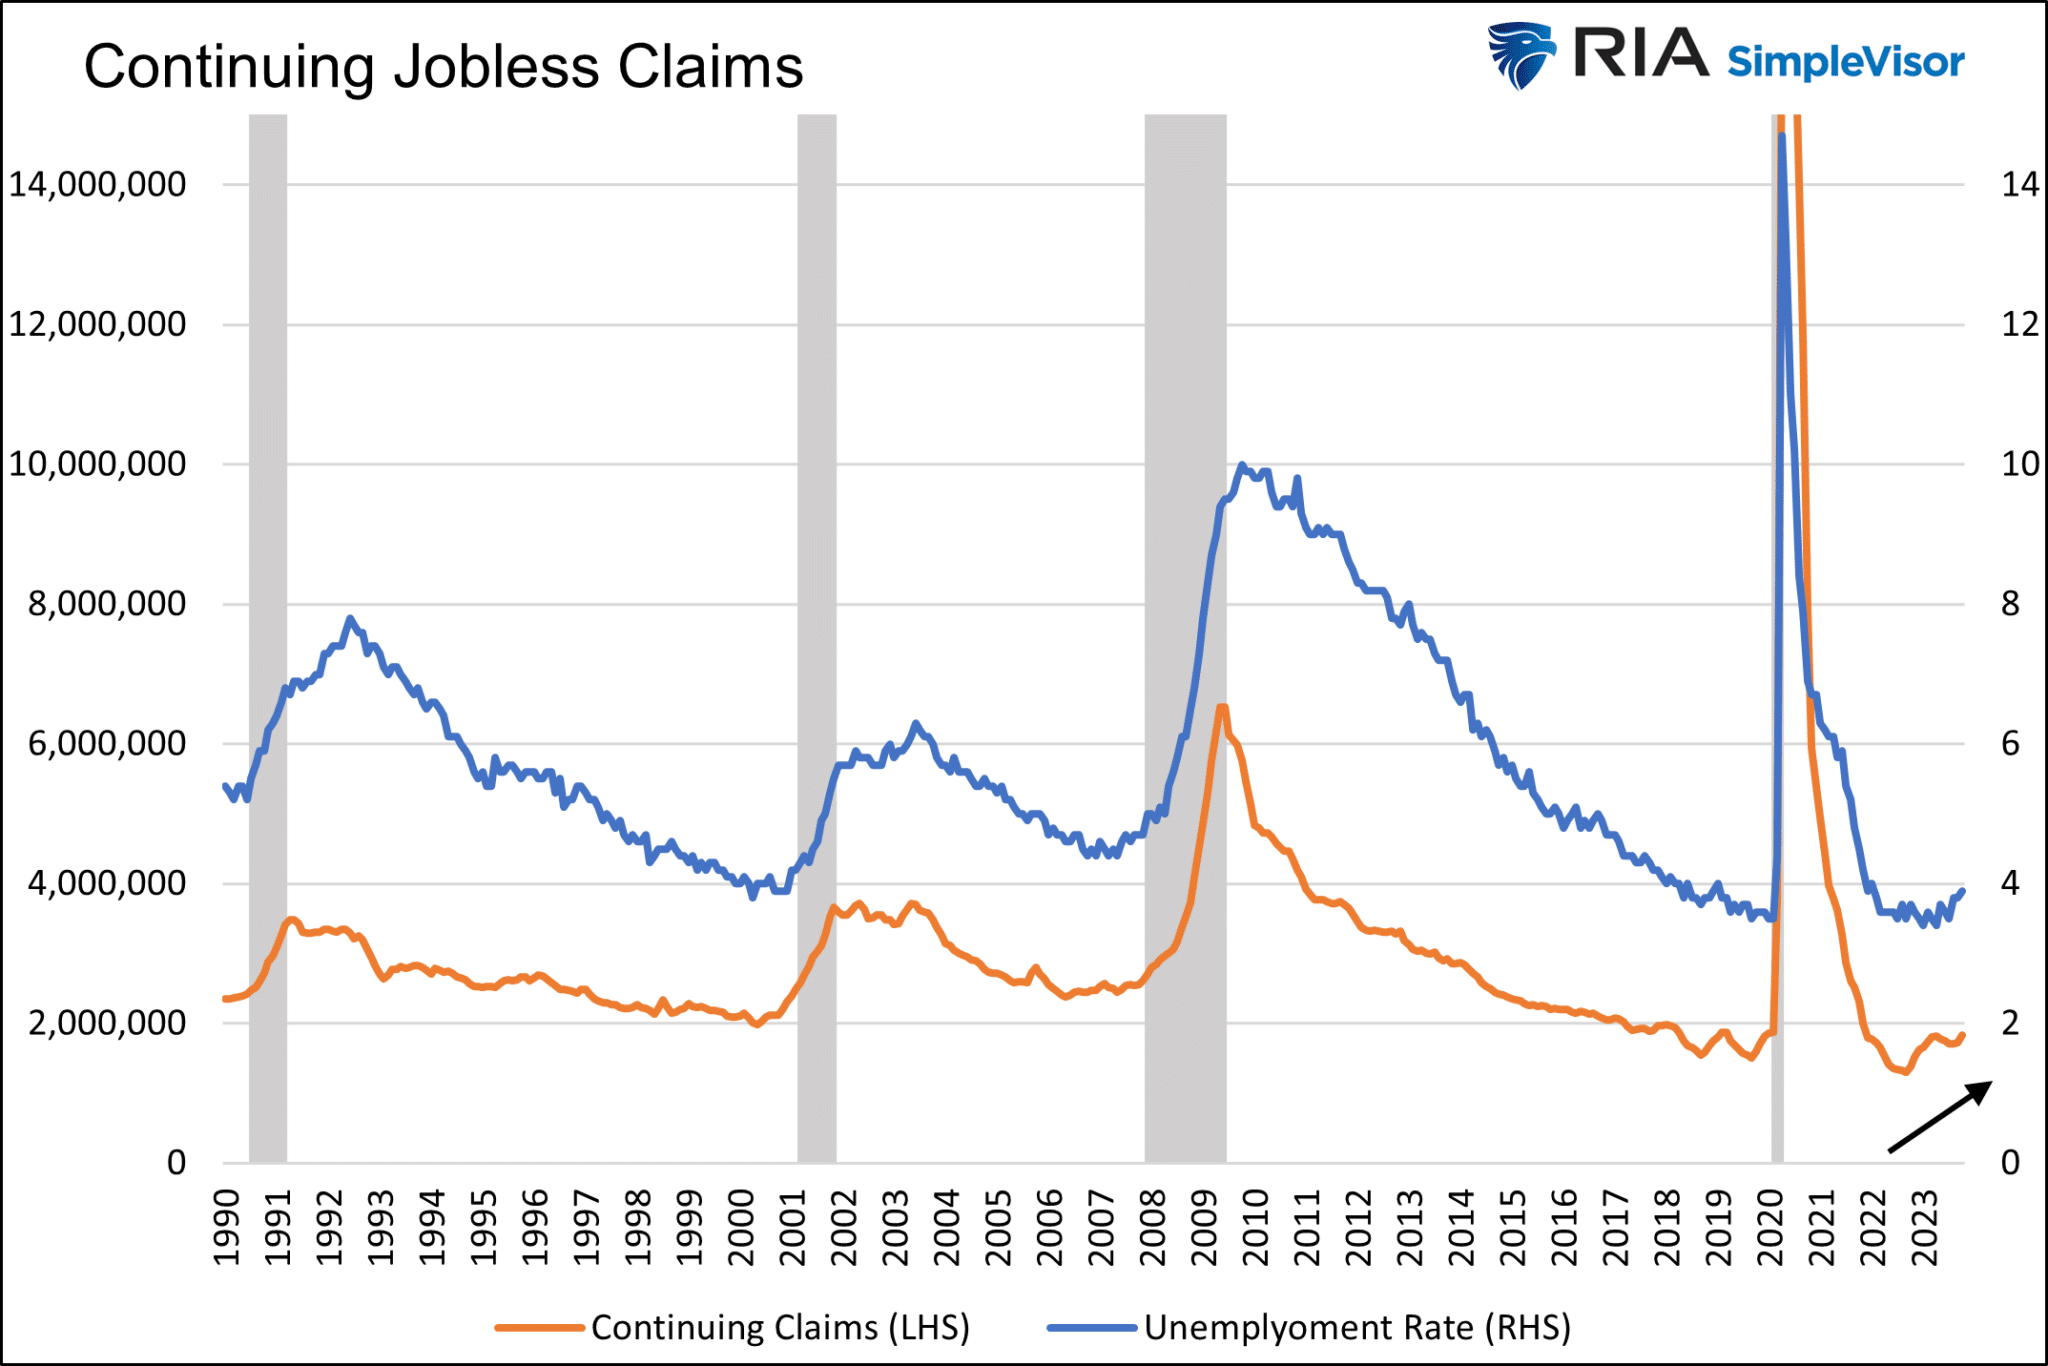
Initial and Continuing Jobless Claims
The Department of Labor provides initial and continuing jobless claims data. Unlike the monthly Bureau of Labor Statistics (BLS) employment report based on corporate and individual surveys, claims data is based on actual state filings by newly unemployed people. Accordingly, the data is more reliable. Further, it is reported weekly, making it timelier.
Initial jobless claims are hovering at a historically low level. However, continuing claims, measuring how long people who previously filed jobless claims remain unemployed, reached their highest level of the past three months at 1.834 million. Continuing Claims have been rising since September 2022, but, like most data we share in this article, the number of continuing claims is low. The duration of the current increase is not typical in non-recessionary periods. The data implies jobs are becoming more challenging to find.

Unemployment Rate
In April, the unemployment rate stood at 3.4%, the lowest in over fifty years. Since then, it has slowly turned higher, standing today at 3.9%. The unemployment rate always turns up as a recession gets underway. Therefore, we need to pay attention as there have been no instances since 1948 when the unemployment rate rose by half a percent, and the economy was not in a recession or entering one within months.
To help us better track the unemployment rate, we combine the Sahm Rule and a chart one of our clients sent in.
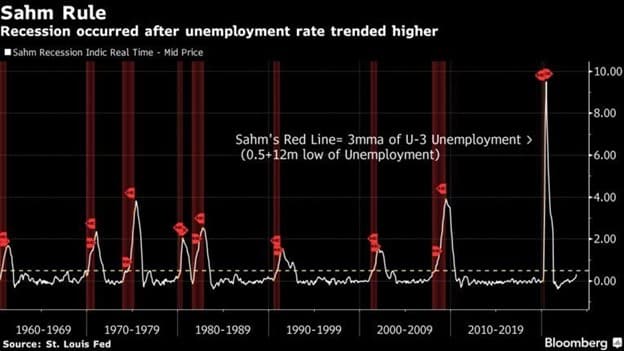
In one of our recent daily Commentaries, we wrote the following about the Sahm Rule:
There is an economic rule of thumb called the Sahm Rule, which has a 100% track record predicting recessions. The rule’s premise states that if the three-month moving average of the unemployment rate increases by 0.5% above the 12-month unemployment low, a recession is not only likely but has probably started already. The Bloomberg graph below shows the current Sahm measure alert has not been triggered. Last Friday, the BLS reported the unemployment rate rose to 3.9% from a low of 3.4% in April. While the difference is +0.5%, the Sahm rule uses the three-month moving average, which is 3.83%. A reading of 4% or higher in the next month’s unemployment rate would trigger the alert, as would two consecutive months of 3.9%.
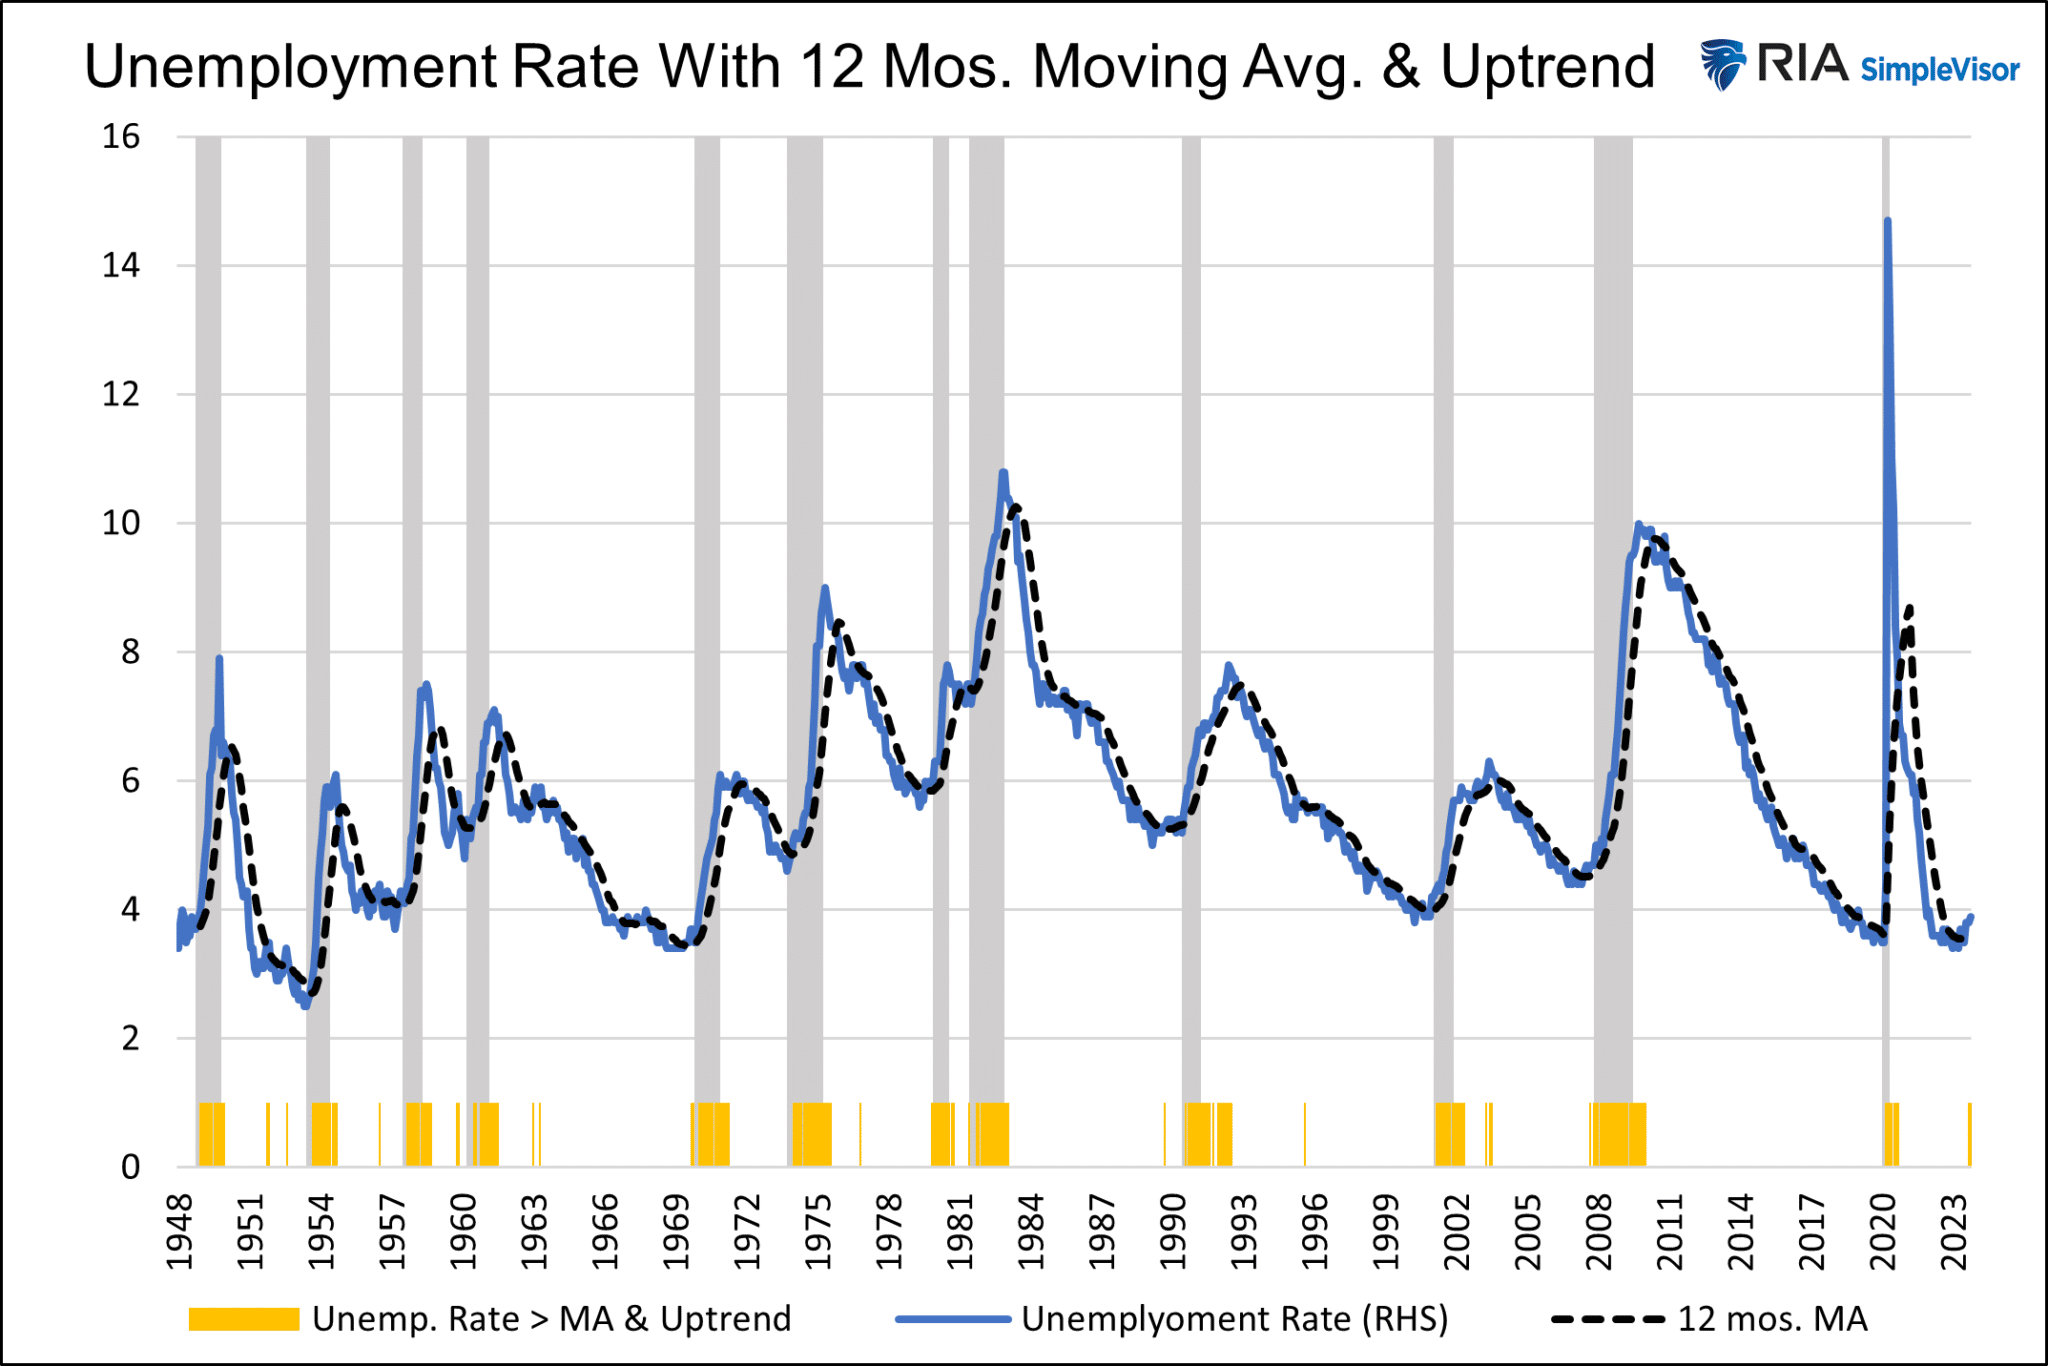
After the last unemployment report, one of our astute clients sent us a graph comparing the unemployment rate to its 12-month moving average. He discovers that when the unemployment rate rises above its moving average, it starts rising rapidly, and a recession ensues.
We combine his moving average calculation and a more precise version of the Sahm Rule. Our warning occurs if the unemployment rate crosses above its 12-month moving average and the unemployment rate has risen by .3% or more over the last six months.
We highlight these instances in yellow below. Since 1948, our tool signaled every recession with only a few false signals. Other than the false alarm in 1996, the other signals occurred slightly before a recession or in the aftermath of one.
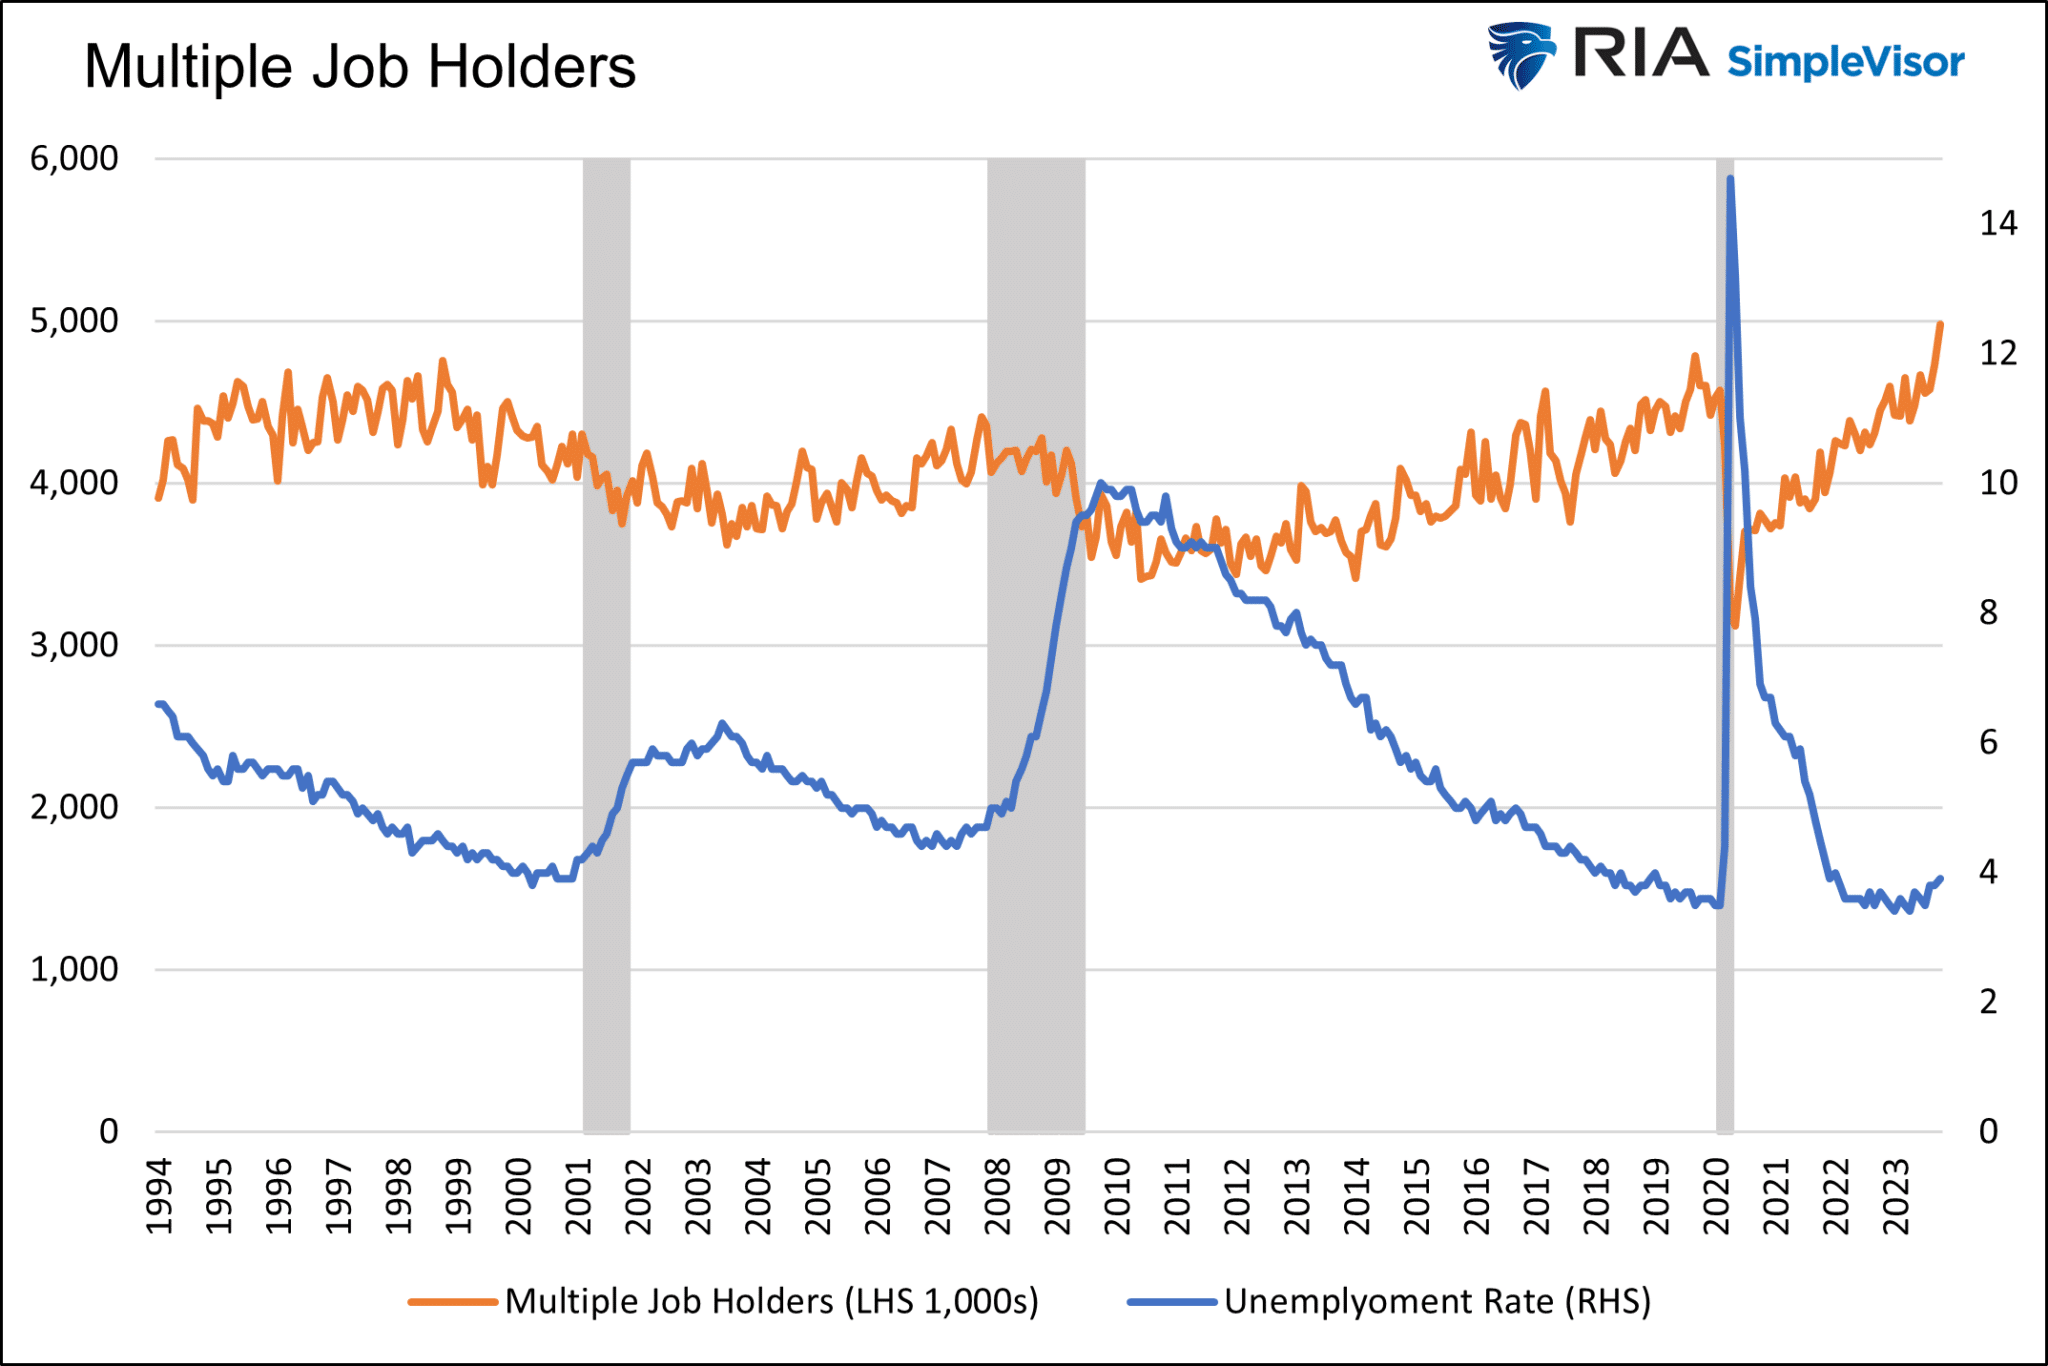
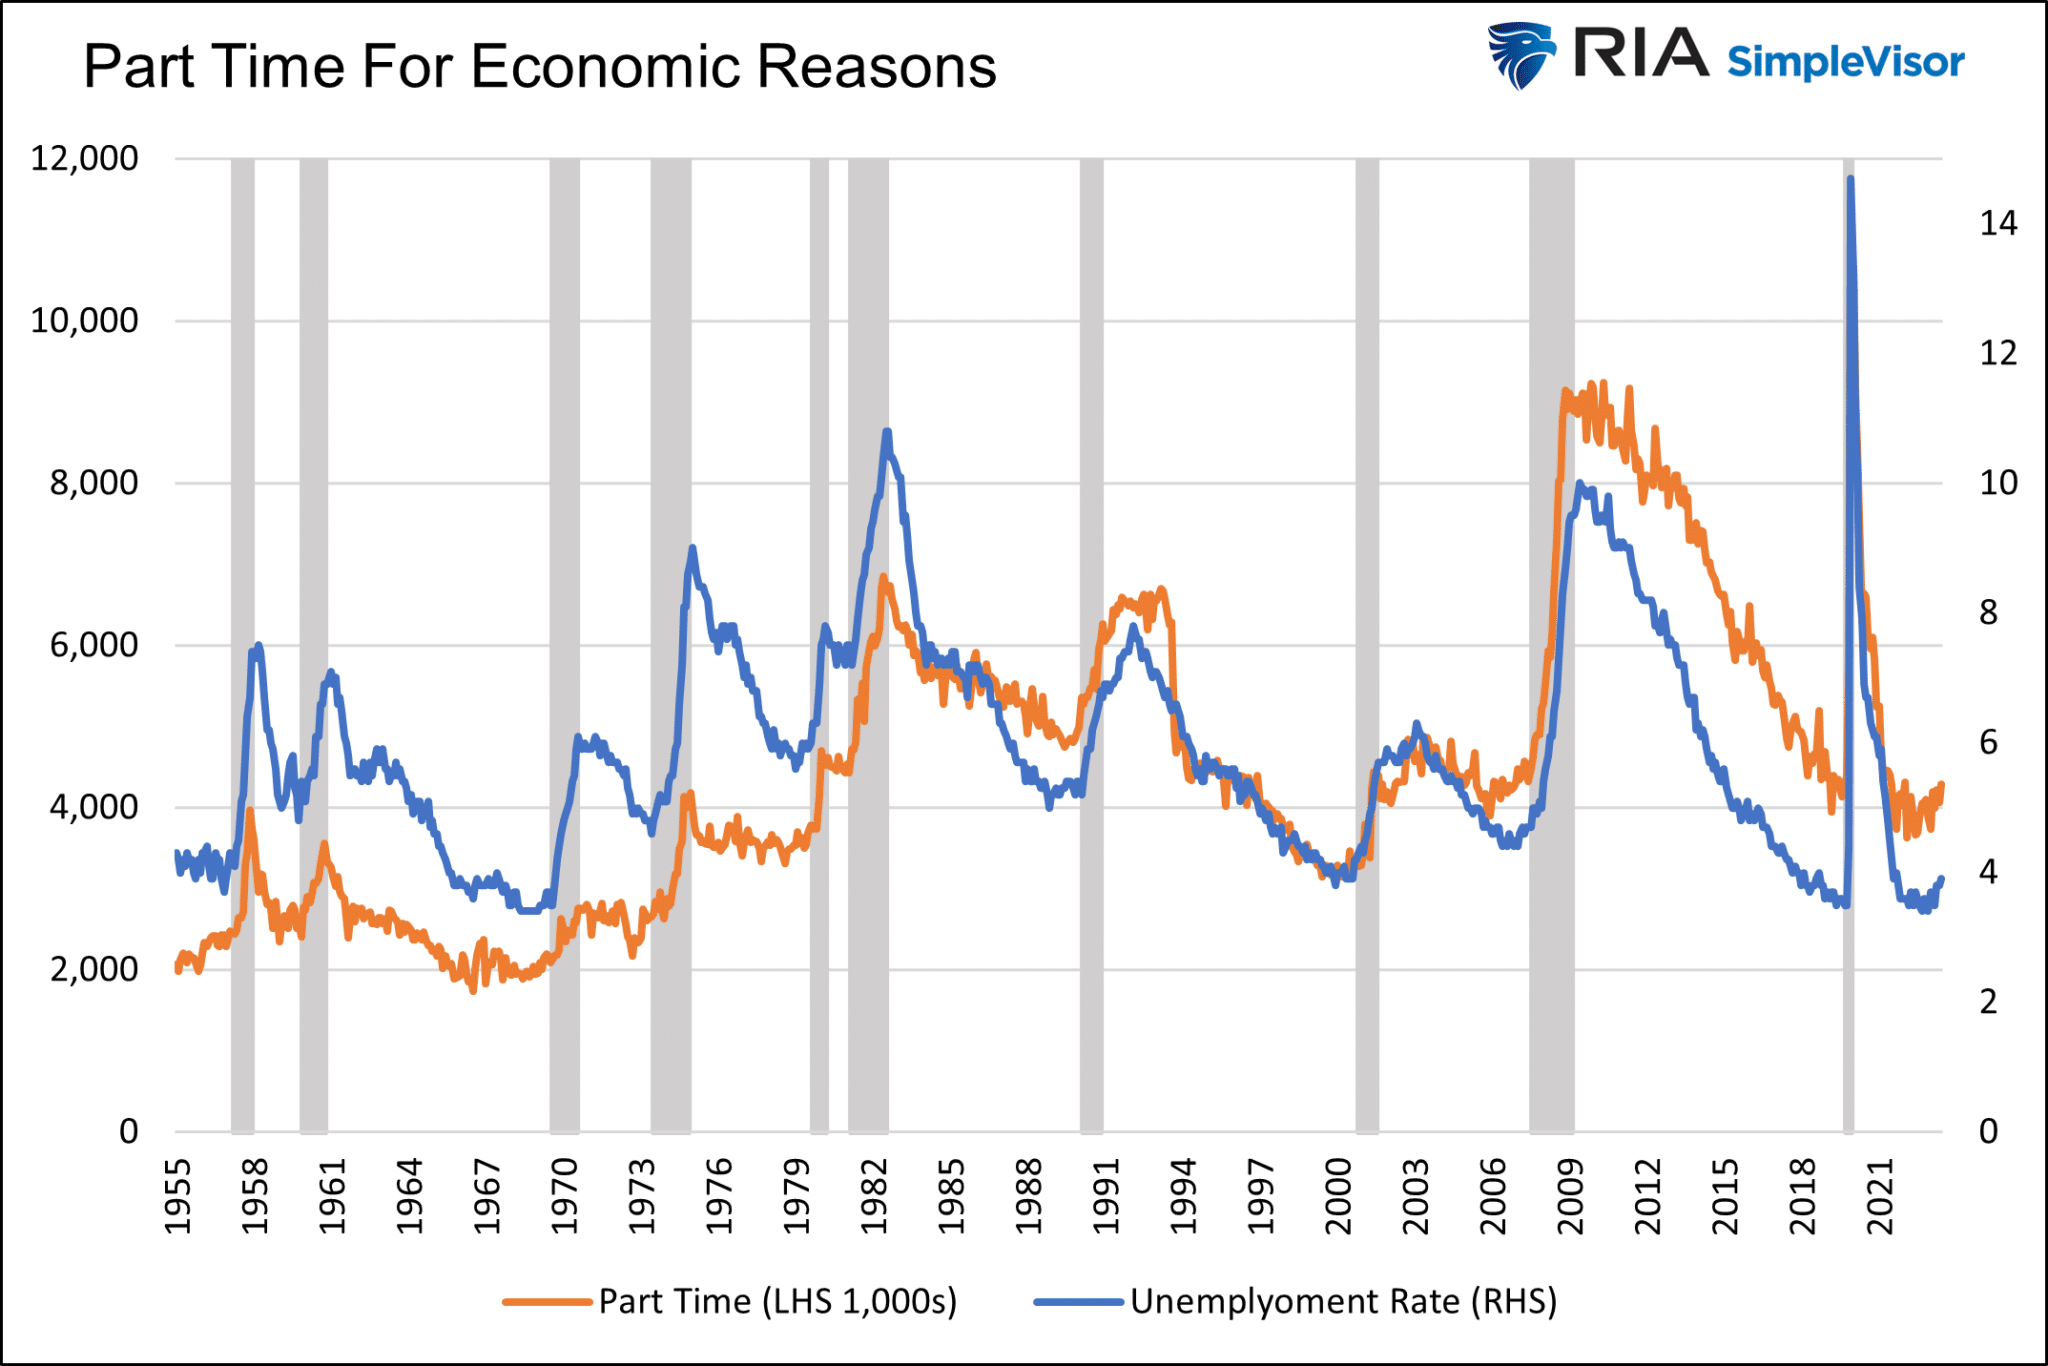
Multiple Job Holders and Part Time Workers
The following two graphs highlight the financial health of individuals. During the early part of an economic growth cycle, the number of people needing multiple jobs declines as full-time jobs become more plentiful. As the cycle gets extended and the job market tightens, some people are forced to take on multiple jobs. Currently, the number of multiple job holders is at a record high. More telling, as a percentage of the total number of employees, it is the highest since the financial crisis.
The second graph shows the strong correlation between those working part-time for economic reasons and the unemployment rate. The number of part-time workers has steadily risen over the last year.

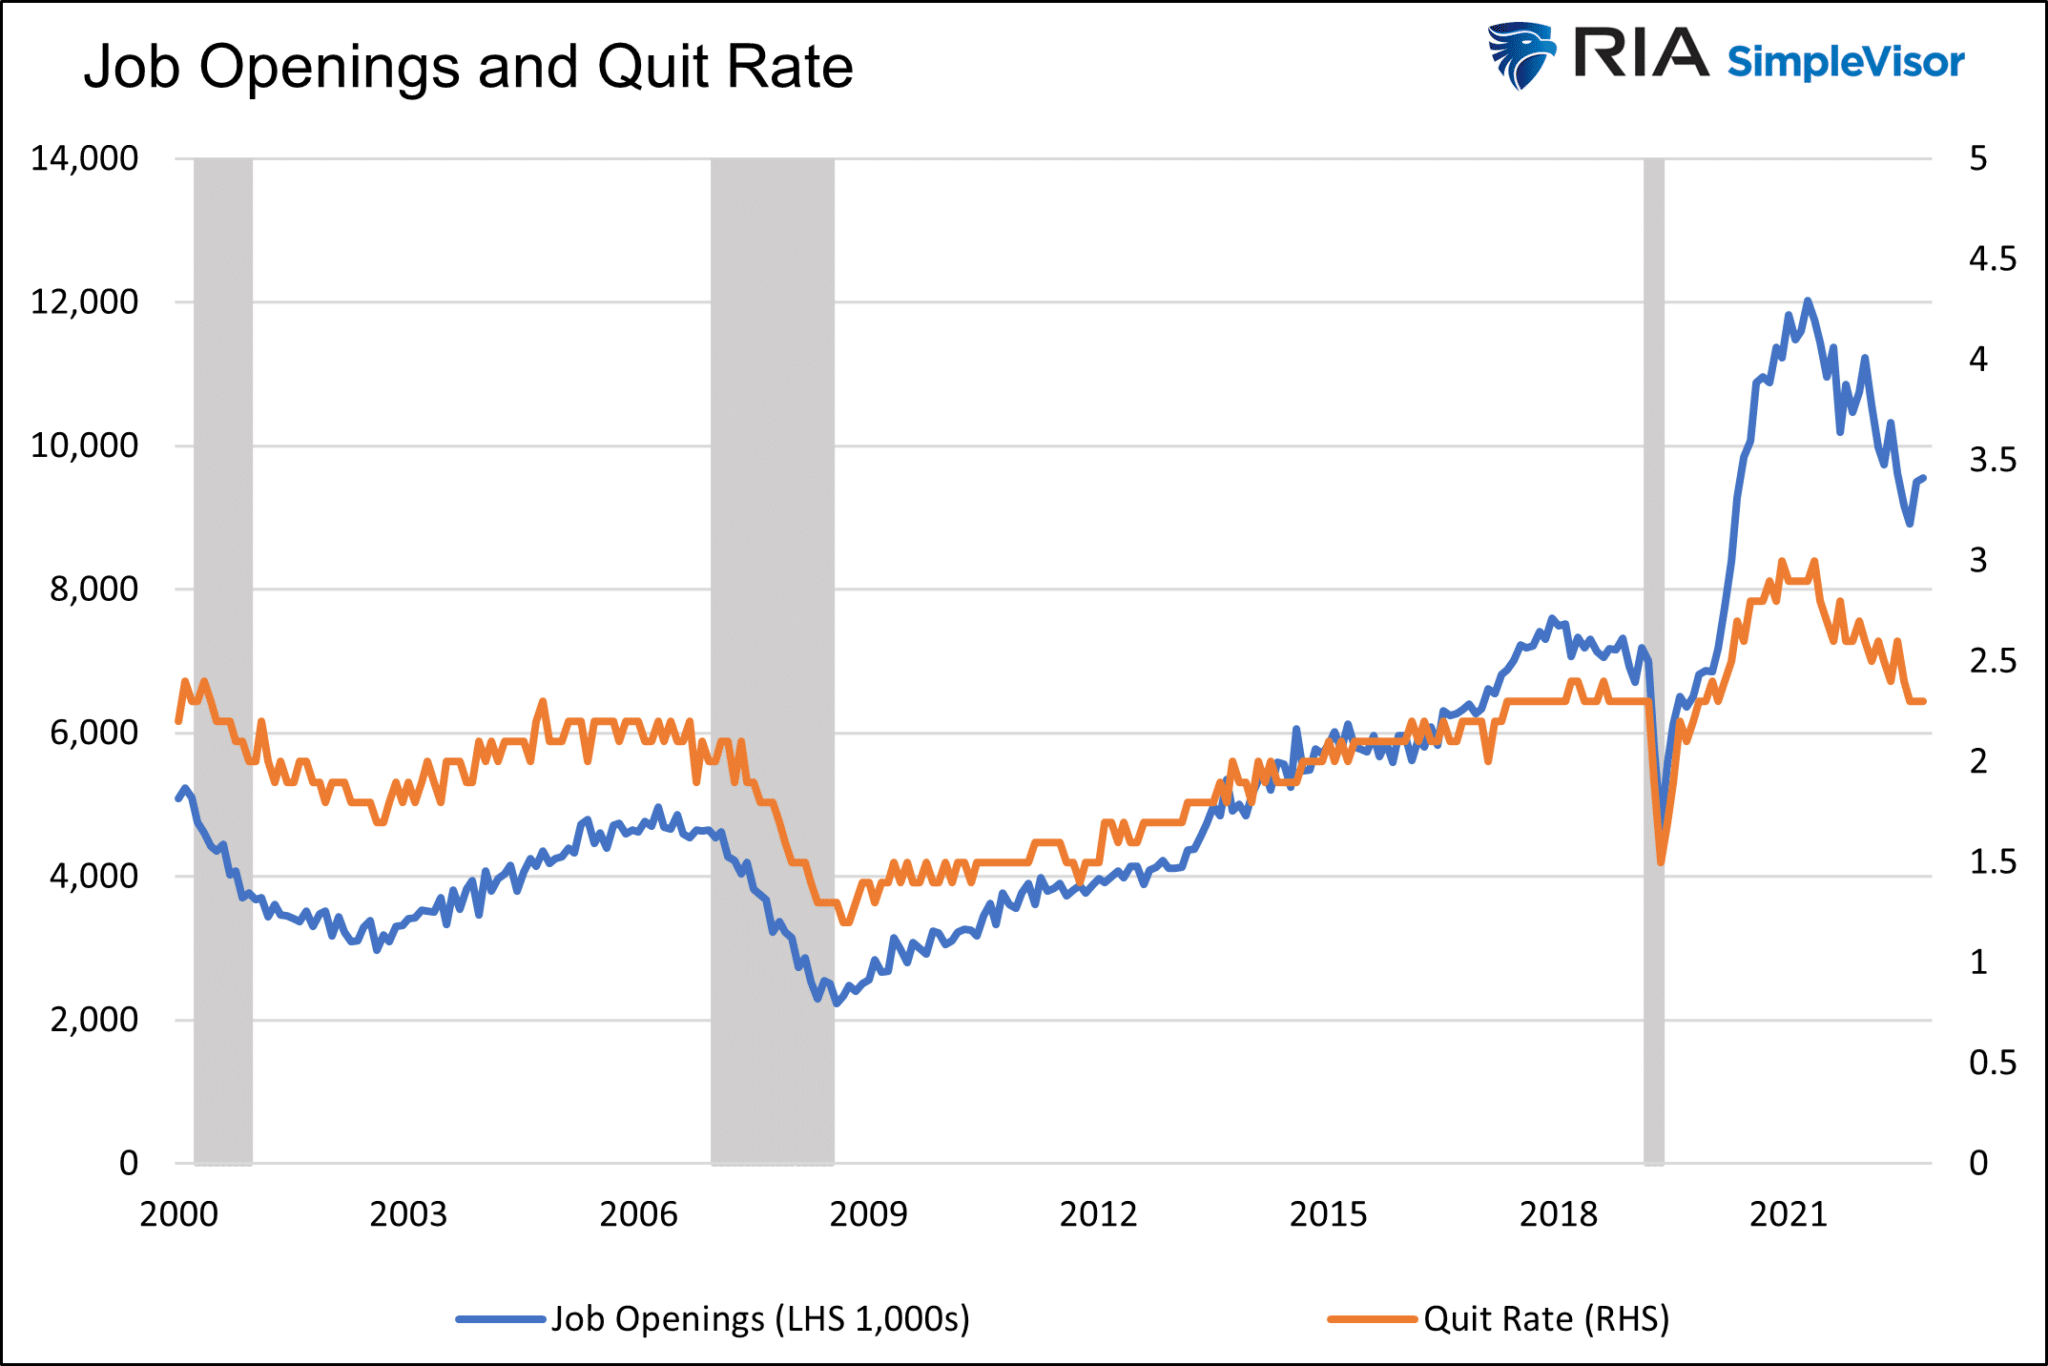
The BLS JOLTs Report
The BLS publishes a monthly report entitled the Job Openings and Labor Turnover Report, aka JOLTs. Two good leading indicators within this report help appreciate whether the labor market is expanding or contracting.
During economic expansion, job openings tend to increase as companies expand. Accordingly, because of increased hiring, companies find it harder to hire qualified employees.
The quit rate, measuring the number of people who recently quit their jobs to the total number of employees, helps us gauge how emboldened workers are about finding a new job. A higher quit rate occurs when individuals feel the labor market is sufficiently tight, whereas they can quit and easily find a better or higher-paying job.
The graph below shows the job openings rate is still well above pre-pandemic levels but has been trending lower for a year and a half. The quit rate is now back to pre-pandemic levels. Neither indicator points to a weak job market, but their trends indicate a deteriorating job market if they continue.
Summary
Economic deterioration or normalization? That question best defines the quandary the employment market presents us.
The labor market is undoubtedly deteriorating and sending signals that have been historically valuable warnings that a recession is coming. However, the massive fiscal stimulus and odd behavioral changes occurring since 2020 should make us consider this time may be different.
It’s tough to tell if the labor market is warning of a recession or just normalizing to a more sustainable level of employment.
Time will tell, and you now have some data to watch closely to help you answer our question.


Michael Lebowitz, CFA is an Investment Analyst and Portfolio Manager for RIA Advisors. specializing in macroeconomic research, valuations, asset allocation, and risk management. RIA Contributing Editor and Research Director. CFA is an Investment Analyst and Portfolio Manager; Co-founder of 720 Global Research.
Follow Michael on Twitter or go to 720global.com for more research and analysis.
Customer Relationship Summary (Form CRS)
Also Read


