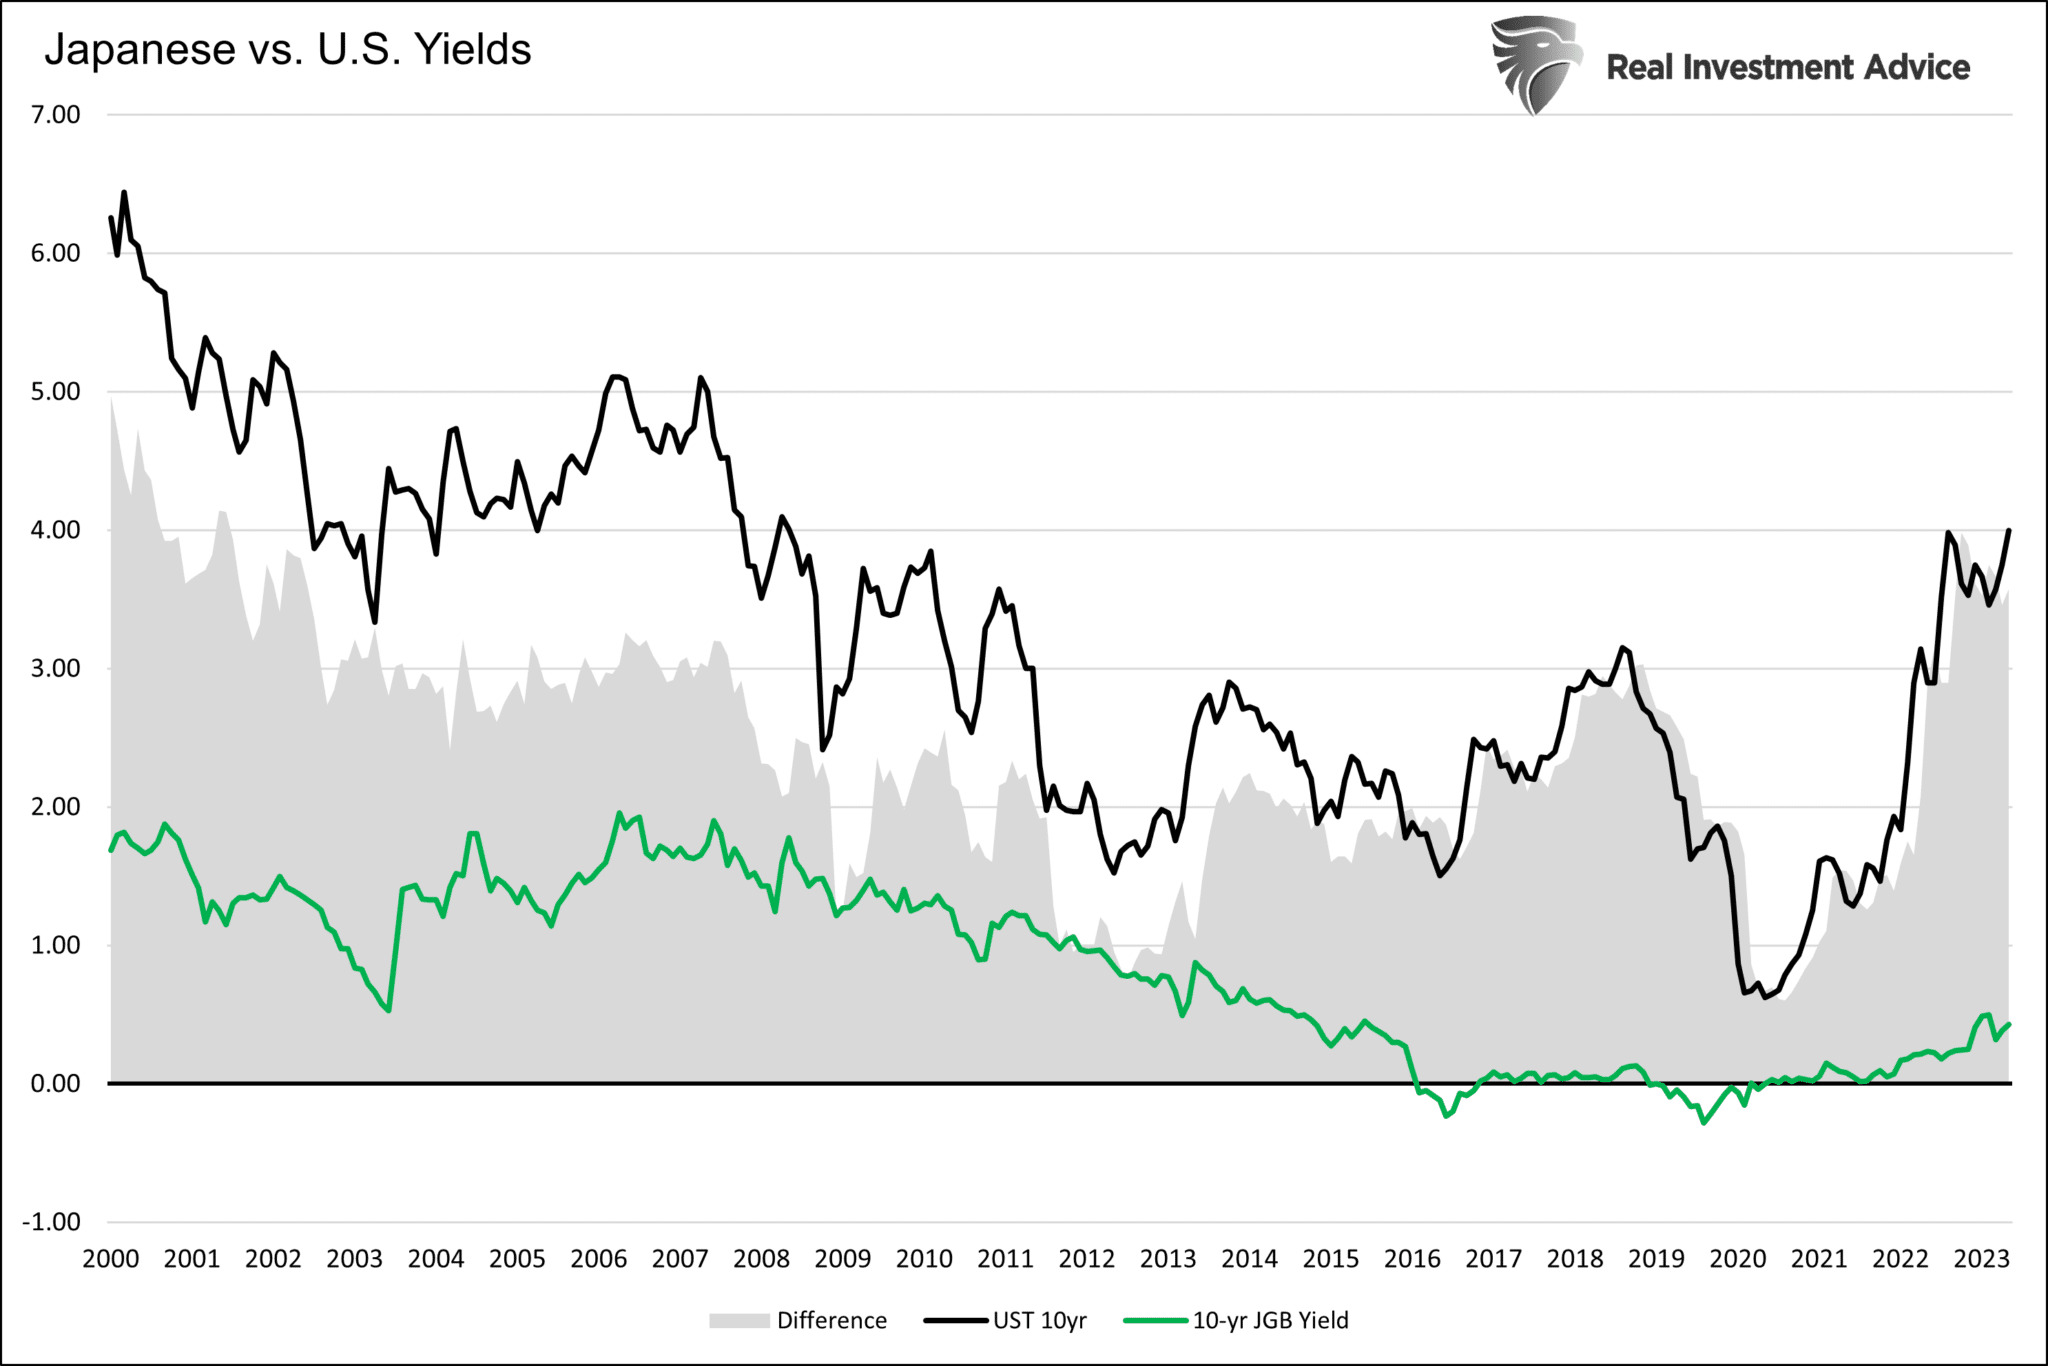
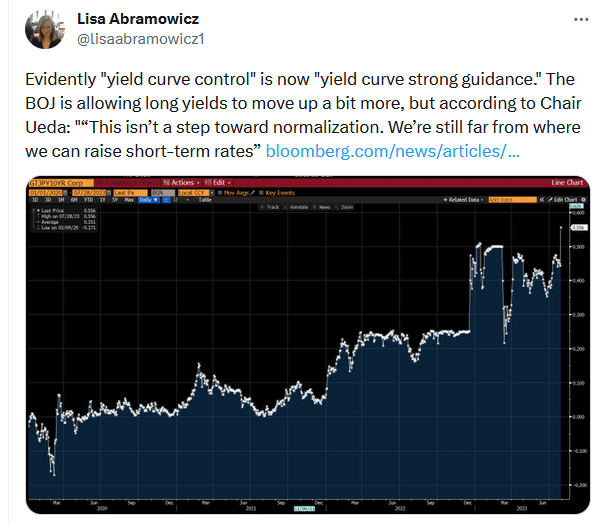
Ten and 30-year U.S. Treasury bond yields rose sharply, with their yields piercing 4%. The driver was a change in the Bank of Japan’s (BOJ) monetary policy. The BOJ adjusted how they manage yields, aka yield curve control (YCC). They will now conduct YCC via “flexible” operations. Before the flexible stance, the BOJ had a hard cap on ten-year yields at 0.5%. Consequently, they would intervene in markets and buy bonds as needed to ensure their yield did not eclipse 0.5%. The measure was only used when its cap was breached. Thursday’s action moved the cap to 1.0% and made it flexible. The flexible cap allows them to increase yields but manage trading so they don’t immediately gap to 1%. Given Japan’s high indebtedness, rising inflation, poor demographics, and negligible economic growth, they likely fear breaking something if yields rose immediately to 1%.
Why is the new flexible approach and higher yield cap affecting U.S. yields? The BOJ has spewed massive amounts of liquidity to keep interest rates extremely low. Therefore, low Japanese yields, and poor stock market returns, incentivized many individuals and pension funds to chase U.S. assets. Consequently, a good chunk of the money ended up in the U.S. Treasury markets. Further, a weak yen and meager rates allowed hedge funds to borrow yen, convert to dollars, and buy U.S. assets, in what is called a carry trade. The flow of capital from Japan ended up in the U.S. Treasury markets. Consequently, the flexible approach to raising yields may incentivize Japanese individuals and institutions to repatriate their money.
What To Watch Today
Earnings

Economy
Market Trading Update
Patience has been hard to come by as of late as stock prices continue trading higher.
“We must remember that market advances can only go so far before an eventual correction occurs. My best guess is that if the markets are to reach all-time highs this year, we will likely have a correction to reset some of the more extreme overbought conditions, as shown below. Any pullback to the 50-DMA is likely a good entry point to increase exposure on a better risk/reward basis.”
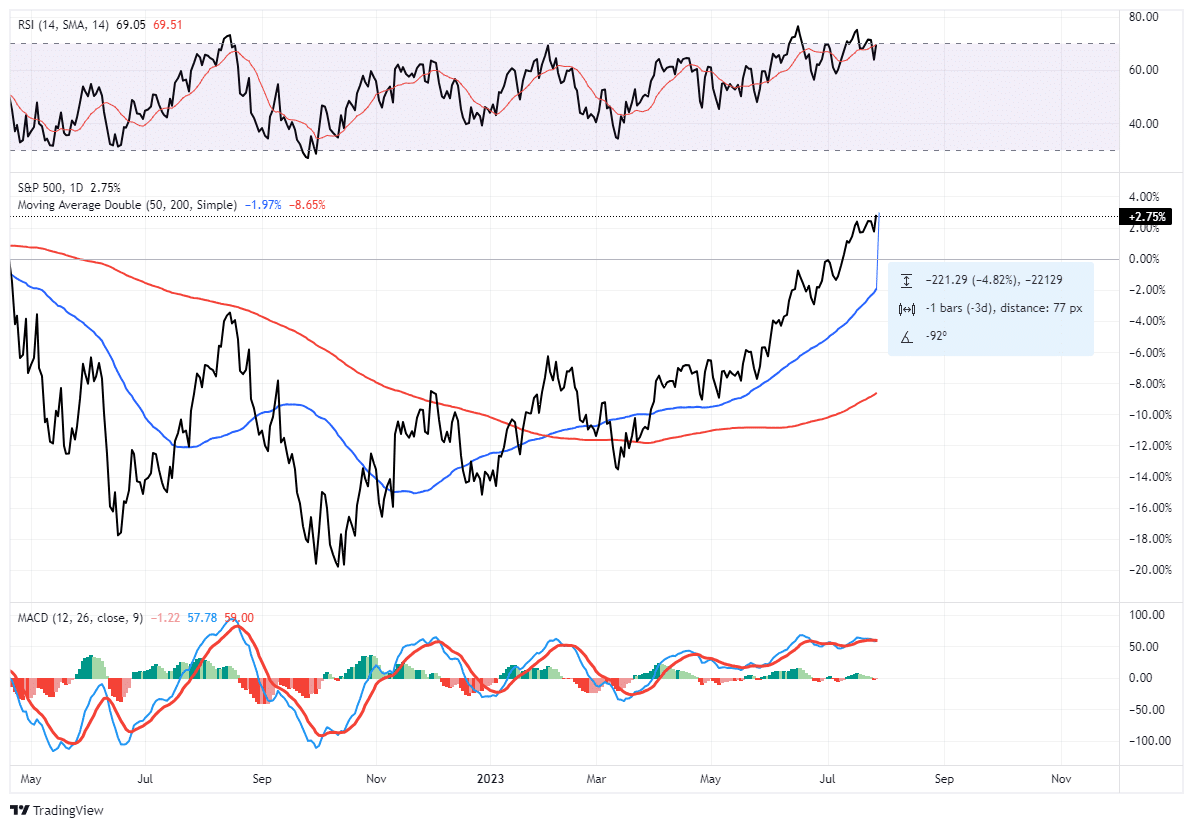
As shown below, the S&P 500 is set to close out its fifth straight month of gains. In addition to being up six out of the seven months this year, returns are unusually high, with the S&P advancing 18% year-to-date.
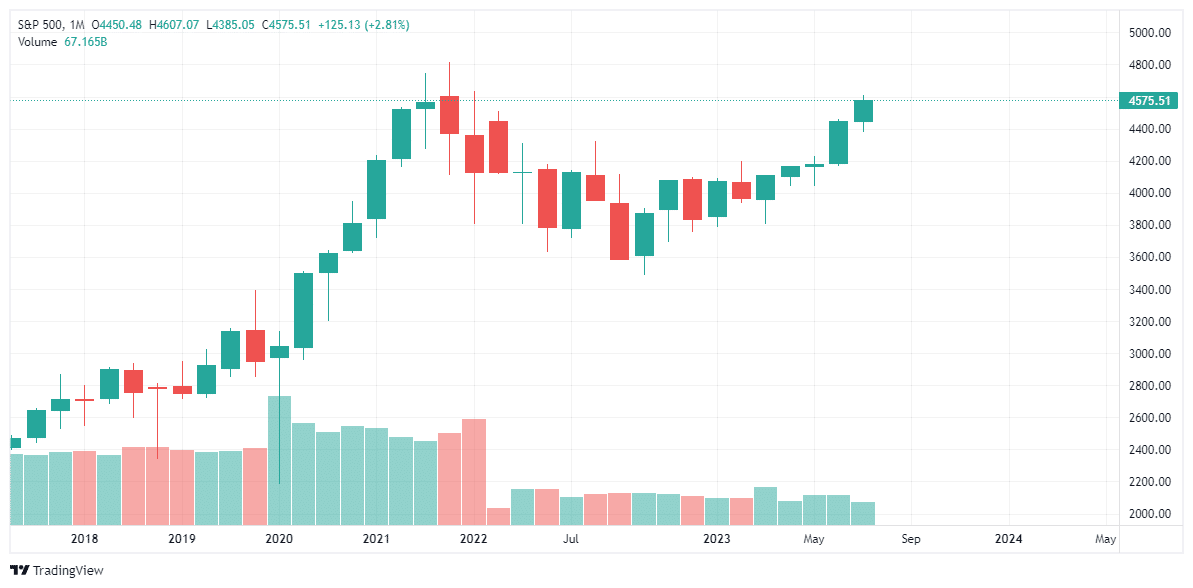
There is little doubting the incredibly bullish tailwind for the US equities despite the Fed hiking interest rates and reducing its balance sheet. Regardless, if we look at the six prior times the S&P 500 was up five straight months in July, the return for the year’s balance was 8% on average with a 100% win rate.
Broadening out the analysis to include only those years when the January-through-July returns were 10% or more yields a more robust sample size of 21 instances going back to 1960. These years return on average 4.8% from August to December, with 95% of the results positive. (The only negative return was in 1987 due to the Black Monday crash.)
I certainly understand and have repeatedly acknowledged the many bearish signals and recessionary signals. While those signals continue to suggest a recessionary economic outcome, which should lead to lower stock prices by its very nature, there is an undeniable momentum in the markets. As such, we have to trade the market we have while remaining on alert for risks as they develop.

The Week Ahead
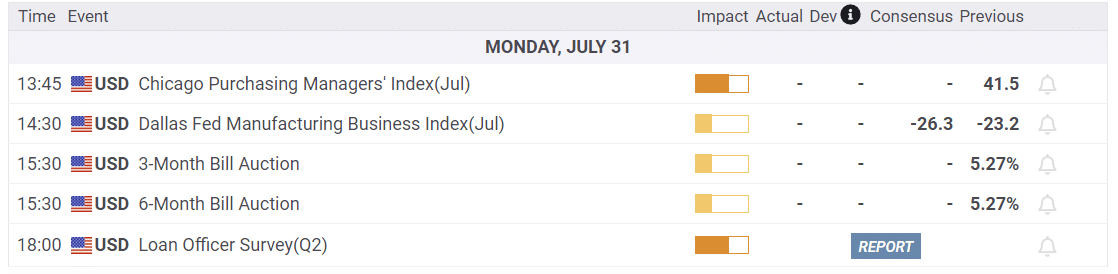
This week will feature key manufacturing indexes and employment data. The most critical data will be Friday’s BLS employment report. Expectations are for a gain of 200k jobs, down slightly from last month. The unemployment rate is expected to remain unchanged at 3.6%. JOLTs and ADP will provide further insight. The national ISM manufacturing and service sector surveys, along with the Chicago PMI and Dallas Fed, will provide recent data on the state of the economy.
Apple and Amazon report earnings after the close on August 3. This will be the last big week of earnings reports for this cycle. Other companies will report after this week, including those on different quarterly cycles. NVDA, for instance, doesn’t report earnings until late August, as their fiscal quarter ends in July.
Fed members will begin publically speaking. As we wrote in yesterday’s Commentary, we will likely hear varying opinions regarding the next steps for the Fed.
Unlike the hawks, the doves think inflation will continue to trend lower, with small odds of an echo bounce in inflation. As such, their predominant goal is avoiding a recession. Cutting rates sooner will help offset the inevitable lag effects of the prior rate hikes that will become an economic headwind. The hawks, unlike doves, are concerned that inflation may bounce back as it did numerous times in the 1970s. Powell and others seem content waiting until 2025 for rate cuts. They are in the “do whatever it takes,” including a recession and higher employment to kill high inflation camp.
Are You Surprised The Economy Is Doing So Well?
If your answer is yes, you are not alone. As we show below, the Citi Economic Surprise Index is at its highest level in over two years. This indicates that economists have been underestimating the economy. The Surprise Index tends to be cyclical, meaning economists go through stretches where they consistently over or underestimate economic activity. Accordingly, we must consider we are nearing a period where economic data starts surprising to the downside of forecasts.

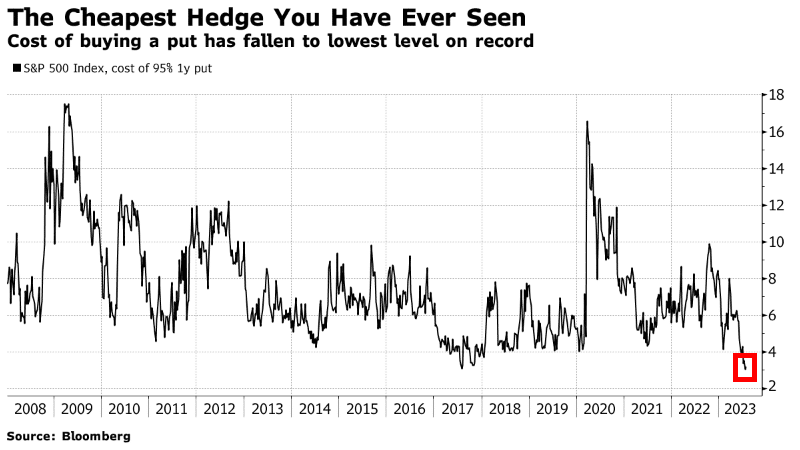
Hedging Stocks With Options Is Dirt Cheap
Per Bloomberg-
“US stock bulls have grown so confident in the market that the cost of buying protection against a 5% dip in the next YEAR has fallen to what BofA strategist Ben Bowler is calling the ‘cheapest you likely have ever seen.’”
The graph shows that the cost of buying a put on the S&P 500 (SPY) is now the cheapest it has been in at least fifteen years. The following example helps us appreciate the math behind the graph.
A SPY put with a June 28, 2024 expiration and a strike of 430 costs 16.70. That equates to a cost of $1,670 per option. If SPY closes below 430 at expiration, the put owner will make $100 for every point SPY is below 430. The cost in percentage terms is 3.67%. In other words, you can hedge a portfolio against a 5% or greater drop for less than 4%.
Tweet of the Day
Please subscribe to the daily commentary to receive these updates every morning before the opening bell.
If you found this blog useful, please send it to someone else, share it on social media, or contact us to set up a meeting.

