
The Fed often stresses that it prefers core inflation measures, which exclude food and energy prices. They do this for a few reasons. First, food and energy tend to be more volatile than most other goods. Accordingly, they can distort the broader price trends. Second, food and energy prices are affected by many variables, many of which the Fed is unable to manage. Lastly, the Fed believes core inflation is a better predictive measure of inflation.
So, while the Fed prefers to ignore food and energy prices, they also heavily rely on energy prices, albeit indirectly. Jerome Powell and other Fed members have emphasized that inflation expectations are very important to follow as they influence inflation. The problem with the Fed’s logic is that energy prices greatly sway inflation expectations. The graph on the left shows crude oil and 1-year inflation expectations. As shown, they track each other closely. We share the same data in a scatter plot to the right to highlight the relationship further. The R-squared (.57) is statistically significant.
Bottom line: energy is used to manufacture, produce, and ship a wide range of goods. While the Fed may want to ignore energy prices, they are too important to the economy, the prices of other goods, and our inflation expectations to dismiss.

What To Watch Today
Earnings
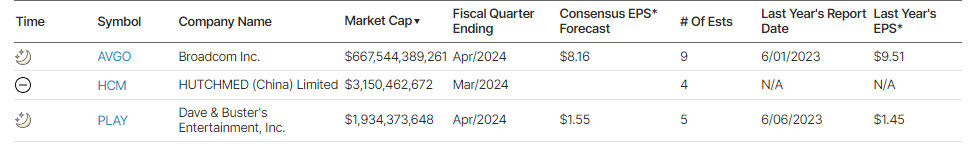
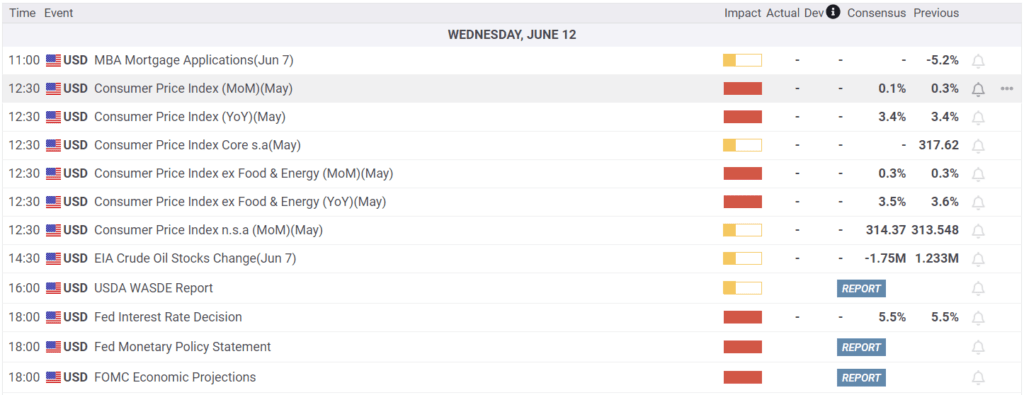
Economy
Market Trading Update
In yesterday’s commentary, we discussed the decline in oil prices and how, from a trading perspective, this sets up a decent opportunity for an energy trade. Adding to that thesis were two other points for why we added to our position in Diamondback Energy (FANG) in our equity portfolio yesterday.
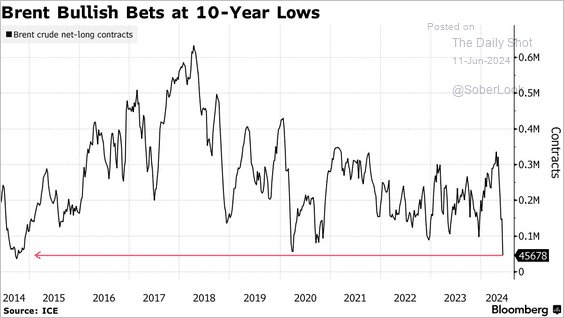
The first is that speculative trading accounts sharply reduced their bets on oil. The recent sharp liquidation of those contracts provides the fuel for a reversal trade.
Secondly, over the last 10 weeks, energy has been corrected from being overbought to being oversold on a relative and absolute performance basis.
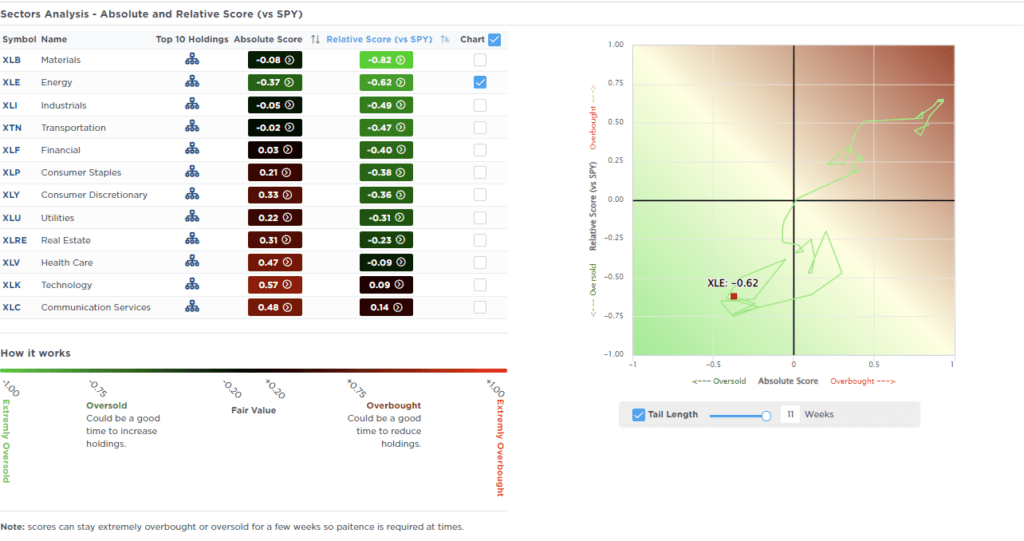
While this does not mean that energy stocks are about to explode higher, the data does suggest that a tradable opportunity is present over the next few months. Such is particularly true as we enter peak driving and hurricane season, where potential demand and drilling disruptions could increase prices.

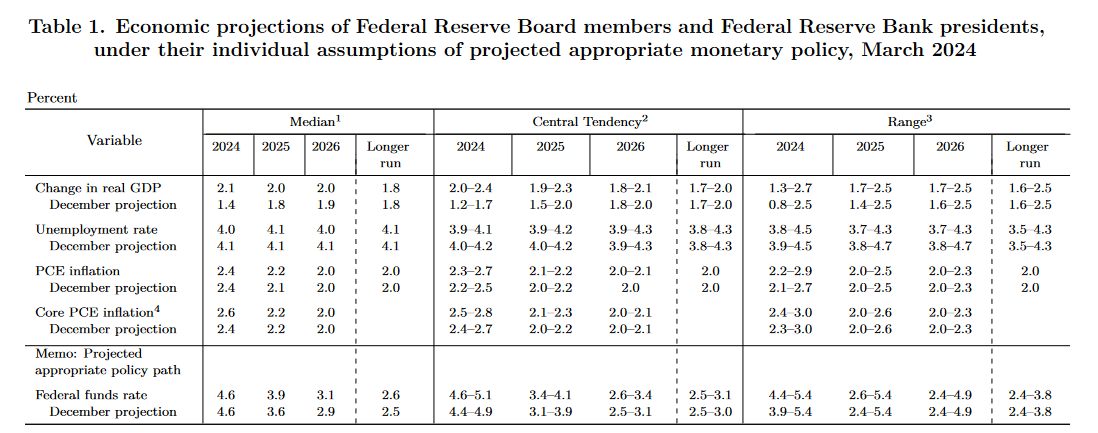
New Fed Dot Plots Today
Part of today’s FOMC announcement will include the revised economic projections, aka dot plots. The table below shows the projections from March. Revisions to the unemployment rate and GDP will shed light on how their views may have changed over the past three months due to some weaker-than-expected economic data. Projections for Core PCE were increased by 0.2% at the March meeting. If they lower it back down, it will infer confidence that inflation is falling again after having stalled.
Lastly, and certainly most important for investors, is the Fed’s outlook on the Fed Funds rate. In March, they thought they could reduce Fed Funds by .75% by year-end. The Fed Funds market implies equal odds of 25 or 50 bps in cuts by year-end. We suspect the Fed will gravitate toward the market’s view. The Fed will probably want to avoid adjusting rates at the September meeting because it’s an election year. Furthermore, July may be too early for a cut unless inflation declines more than expected. If we assume they skip the next two meetings, that only leaves two more meetings before the year’s end.
The Bogus Gas Price Narrative
Given our opening paragraphs about the connection between energy prices and inflation expectations and how the Fed may proceed with monetary policy, it’s worth debunking a narrative. As much as you keep hearing, gas prices are not spiking. Yes, they have been up over 10% for the year to date. However, gas prices tend to follow a seasonal pattern, increasing into the summer driving season and then giving up those price increases in the year’s second half.
The graph below charts the average weekly year-to-date change in gas prices from 2005 to 2023 and compares it to the change in gas prices this year. As shown, gas prices rose more than the average in the first fifteen weeks of 2024. However, that reversed sharply. The current year-to-date change is now about 10% less than is typical for this time of the year. Gasoline prices are volatile, so we should be careful not to read too much into this graph. But, the narrative that high gas prices are a reason to suspect inflation is rising is false.

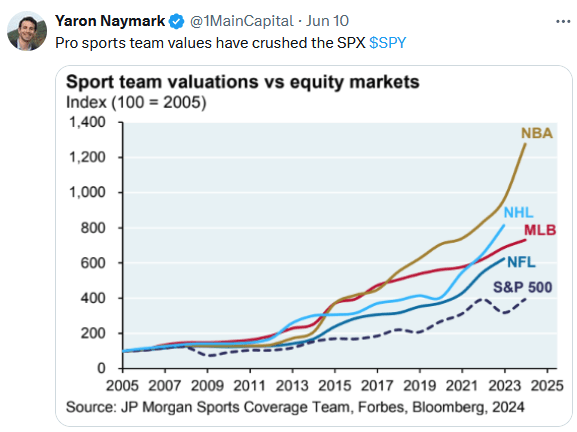
Tweet of the Day
“Want to achieve better long-term success in managing your portfolio? Here are our 15-trading rules for managing market risks.”
Please subscribe to the daily commentary to receive these updates every morning before the opening bell.
If you found this blog useful, please send it to someone else, share it on social media, or contact us to set up a meeting.

