


In this 07-16-21 issue of “Earnings Seasons Kicks Off With Markets Priced For Perfection.”
- Market Pulls Back As Signals Turn
- Earnings Season Has A High Bar
- Markets Priced For Perfection
- Portfolio Positioning
- Sector & Market Analysis
- 401k Plan Manager
Follow Us On: Twitter, Facebook, Linked-In, Sound Cloud, Seeking Alpha
Are you worried about the potential for a market correction, a surge in inflation, or are you unsure how to invest for your retirement? We can help. If you are not yet a client and would like to discuss your portfolio construction, please schedule a time to meet with one of our advisors below.

Market Pulls Back As Signals Turn
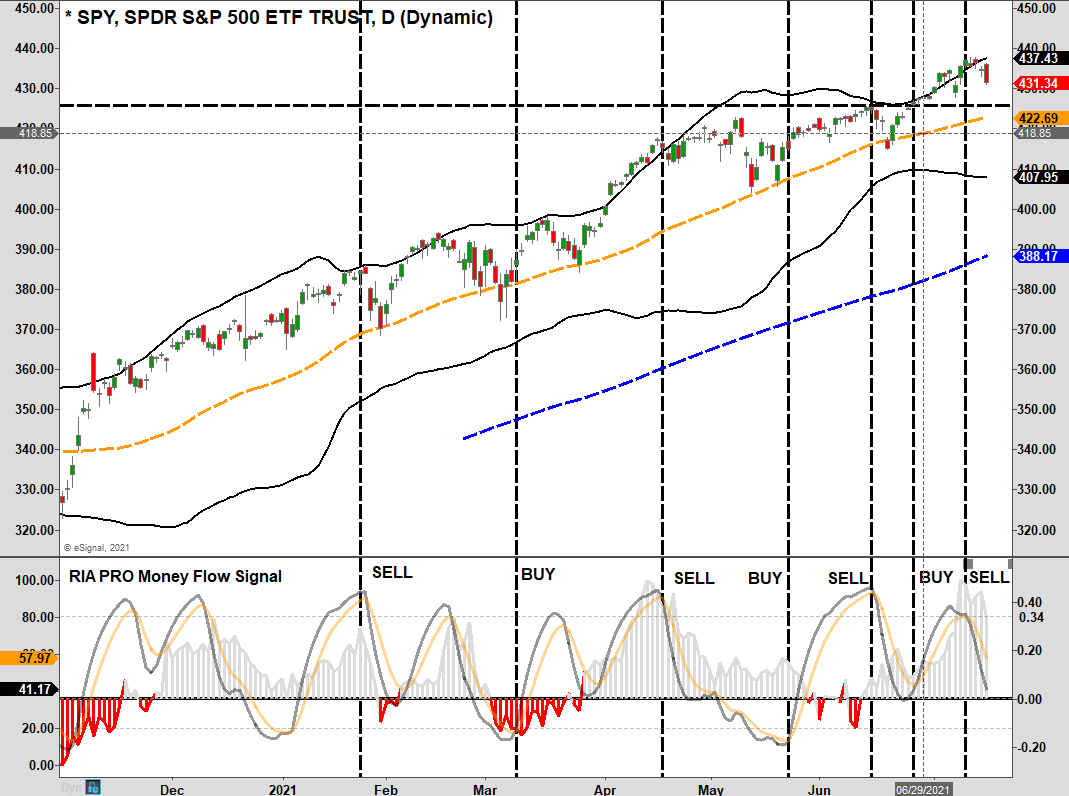
Last week, we discussed the market hit new highs with the index getting back to more extended and overbought conditions. To wit:
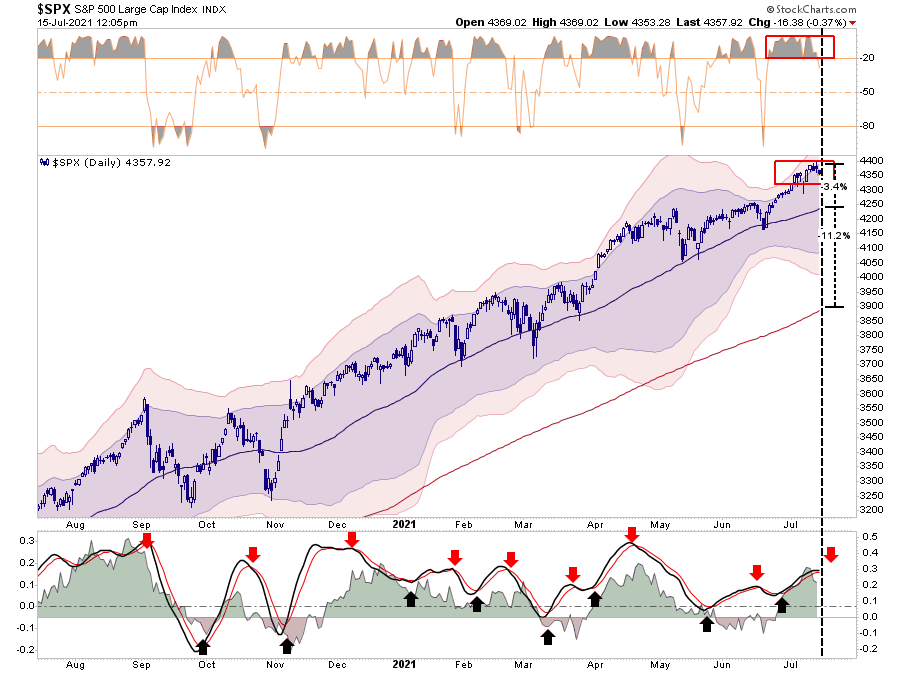
“While market volatility did pick up this past week, the index held its breakout support levels and closed at a new high. Such keeps the bullish bias intact. However, as shown, the money flow signals are now back to more elevated levels, which will provide resistance to higher prices short term.
“The bulls are indeed in charge of the markets currently, but the clock is ticking.”
Not surprisingly, the market stumbled this past week as technology began to fade its recent outperformance. But, of course, investors have been piling into the trade as of late, pushing it to more overbought extremes. As noted by Sentiment Trader on Friday:
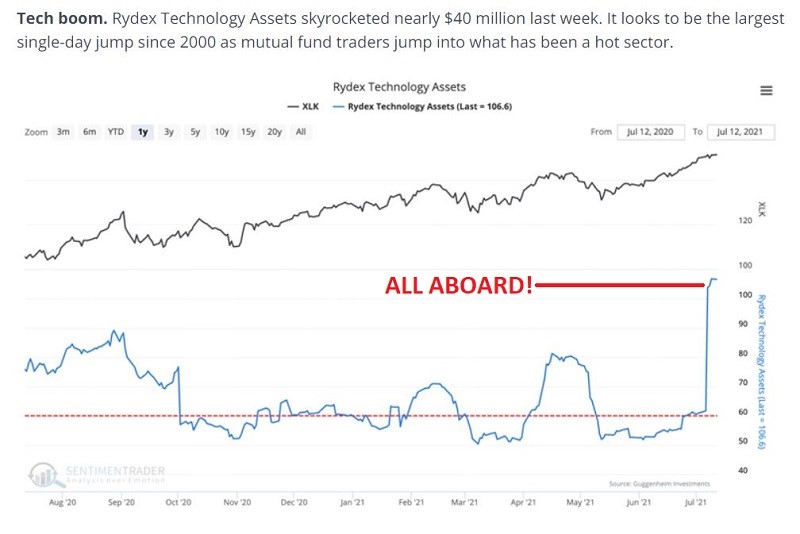
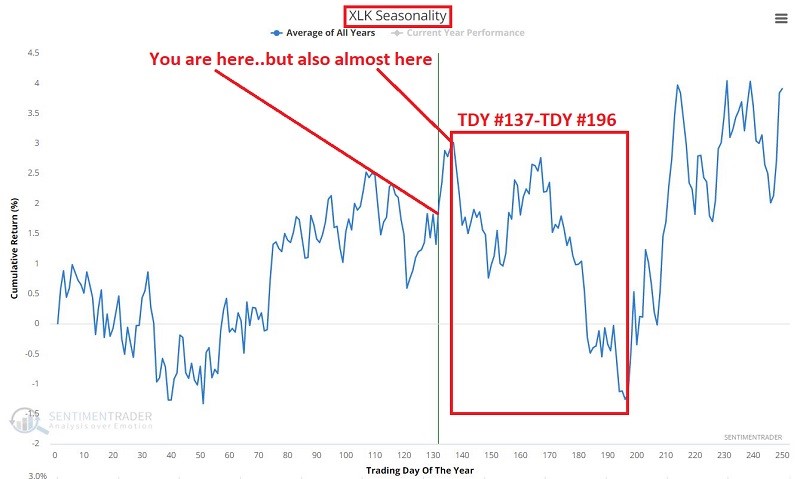
Of course, not surprisingly, investors are historically prone to “buying the most at the top.” With the seasonally weak trend of the Nasdaq approaching, with MACD’s triggering sell signals, there is likely to be some disappointment.
However, there are two reasons why investors are piling back into the 10-largest technology names:
- Portfolio managers need to be invested to generate performance, and the mega-cap Technology names are easy to “hide” in given the large daily trading volumes.
- These companies can generate earnings growth in a slowing economic environment.
The problem with the second point is that those top-10 mega-cap names generate the bulk of the earnings of the entire S&P 500 index. Such has only occurred at previous bull market peaks.
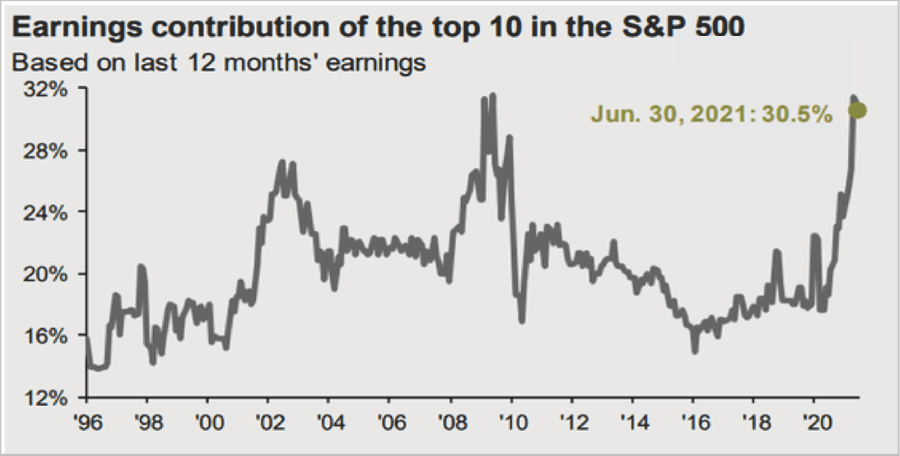
All of this suggests the risk of a correction remains elevated, particularly with the market priced for perfection.

Earnings Season Has A High Bar
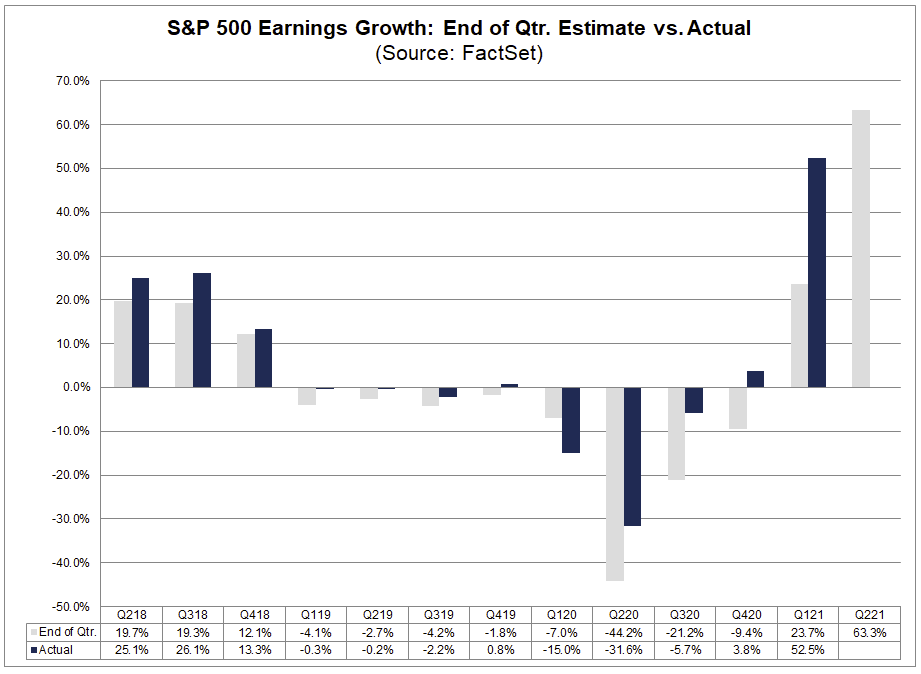
Over the last few months, the rush of analysts to upgrade earnings estimates for the S&P 500 is one for the record books. According to Factset:
“If the S&P 500 reports year-over-year growth in earnings of 69.3% in Q2, it would mark the highest (year-over-year) earnings growth rate reported by the index since Q4 2009 (109.1%).”
Of course, given the expectation of robust earnings growth for Q2, analysts still predict a double-digit price increase for the S&P 500. To wit:
“Industry analysts in aggregate predict the S&P 500 will see a price increase of 11.2% over the next 12 months. The bottom-up target price is calculated by aggregating the median target price estimates (based on company-level estimates submitted by industry analysts) for all companies in the index. On July 8, the bottom-up target price for the S&P 500 was 4803.62, which was 11.2% above the closing price of 4320.82.” – FactSet
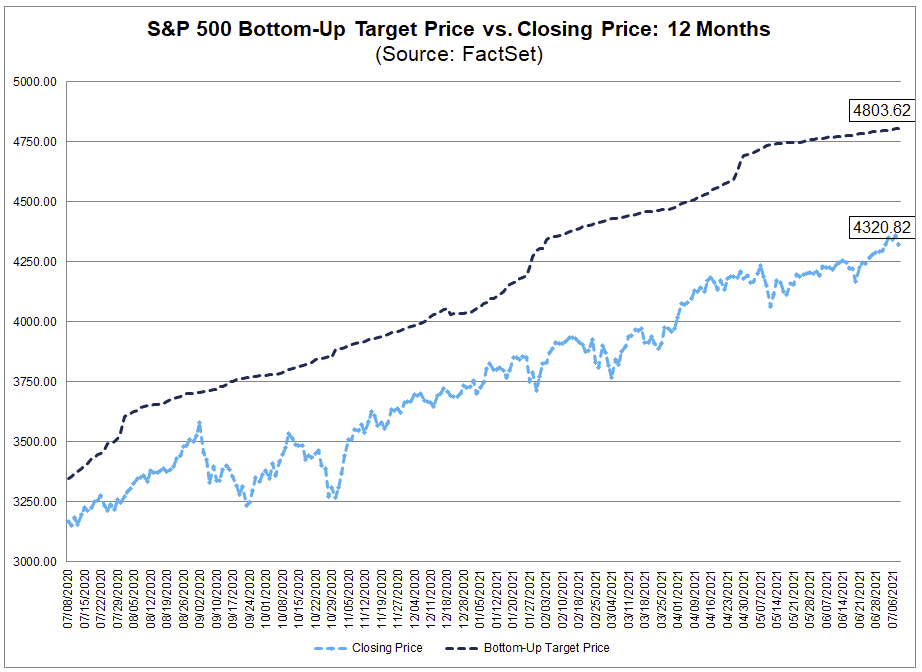
(Of course, it is worth noting the S&P NEVER matches its bottom-up price target. In other words, estimates are always too high compared to reality.)
Analysts have set a very high bar for the markets to hurdle, given already lofty valuations. With indices already well-stretched above their historical means, there is much room for disappointment.
With the currently very overbought short-term market, a 3% to 10% correction this summer remains likely.
In Case You Missed It

Markets Priced For Perfection
While earnings estimates are soaring on exuberant hopes of an indefinite economic boom, revenue may be telling a much different story. I noted this point earlier this week:
Investors should not dismiss the above quickly. First, revenue is what happens at the top line. Secondly, revenue CAN NOT grow faster than the economy. Such is because revenue comes from consumers, and consumption makes up 70% of the GDP calculation. Earnings, however, are what happens at the bottom line and are subject to accounting gimmicks, wage suppression, buybacks, and other manipulations.
Since 2009, corporate operating earnings grew cumulatively by 339%. Yet, during that same period, the cumulative growth of revenue is only up 63%. It is through “accounting magic” that revenue gets multiplied to the bottom line. Out of each dollar of earnings, 82% is from accounting “management,” and just 18% is from revenue.
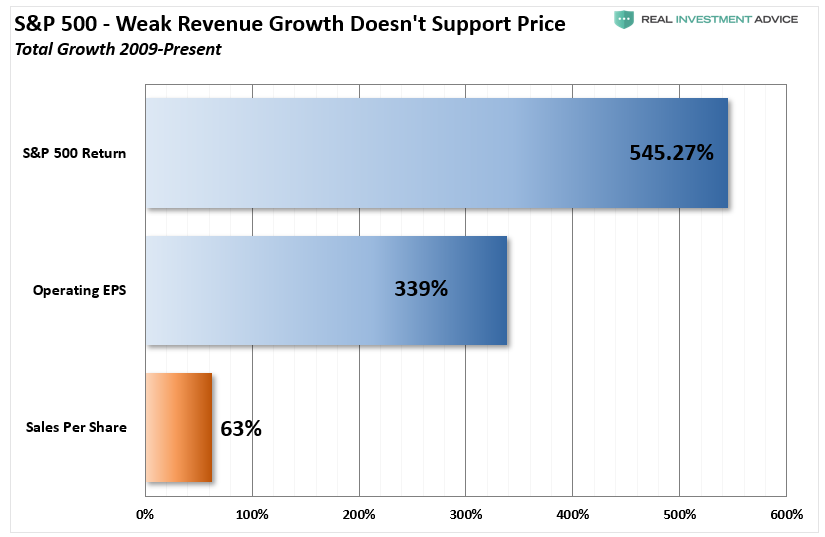
The majority of the rise in “profitability” came from various cost-cutting measures and accounting gimmicks rather than actual increases in top-line revenue. While tax cuts certainly provided the capital for a surge in buybacks, revenue growth, the result of a consumption-based economy, remains muted.
The Valuation Problem
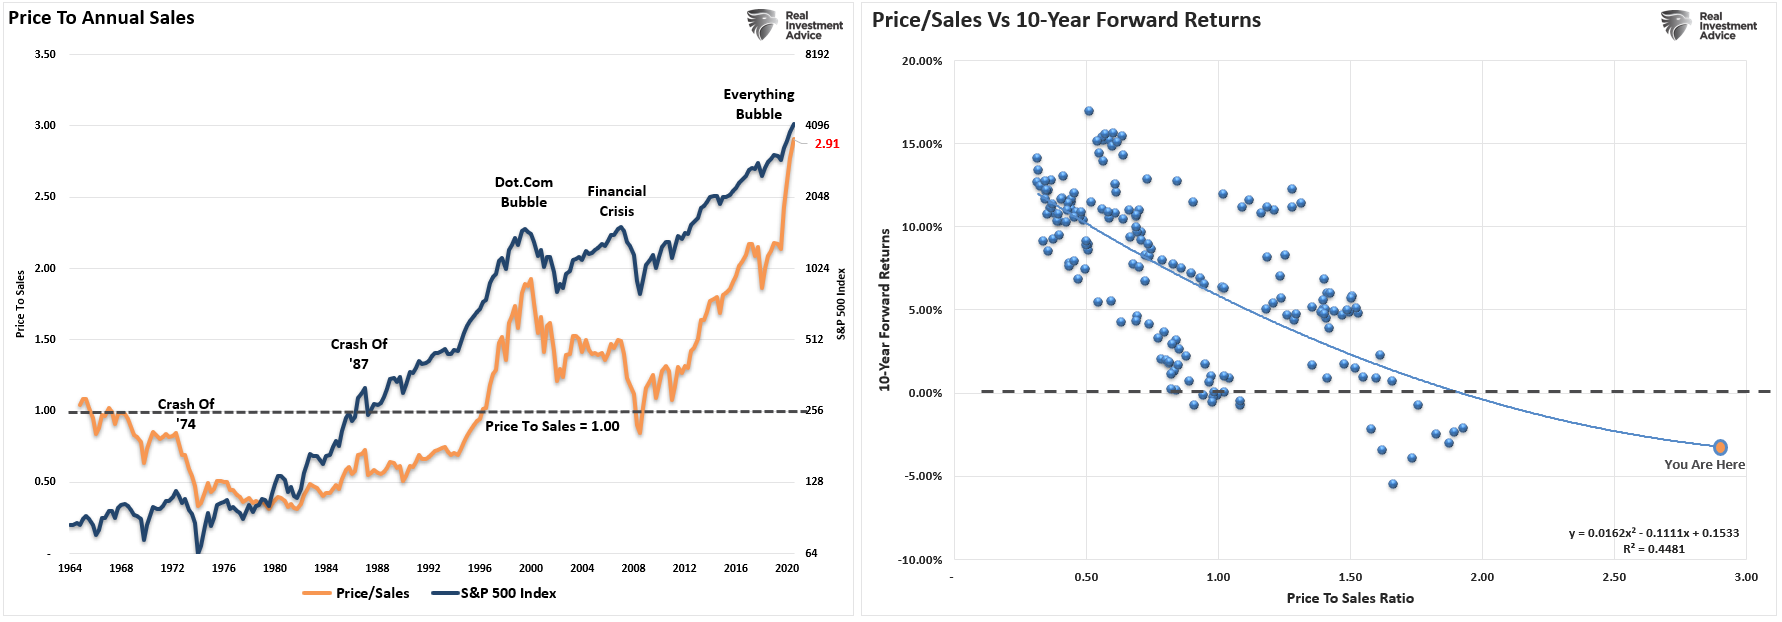
The problem is the market surged higher due to the ongoing liquidity injections from the Federal Reserve. While liquidity drives asset prices higher, it does not foster economic activity, which creates corporate revenue. Currently, the price-to-sales (revenue) ratio is at the highest level ever. As shown, the historical correlation suggests outcomes for investors will not be kind.
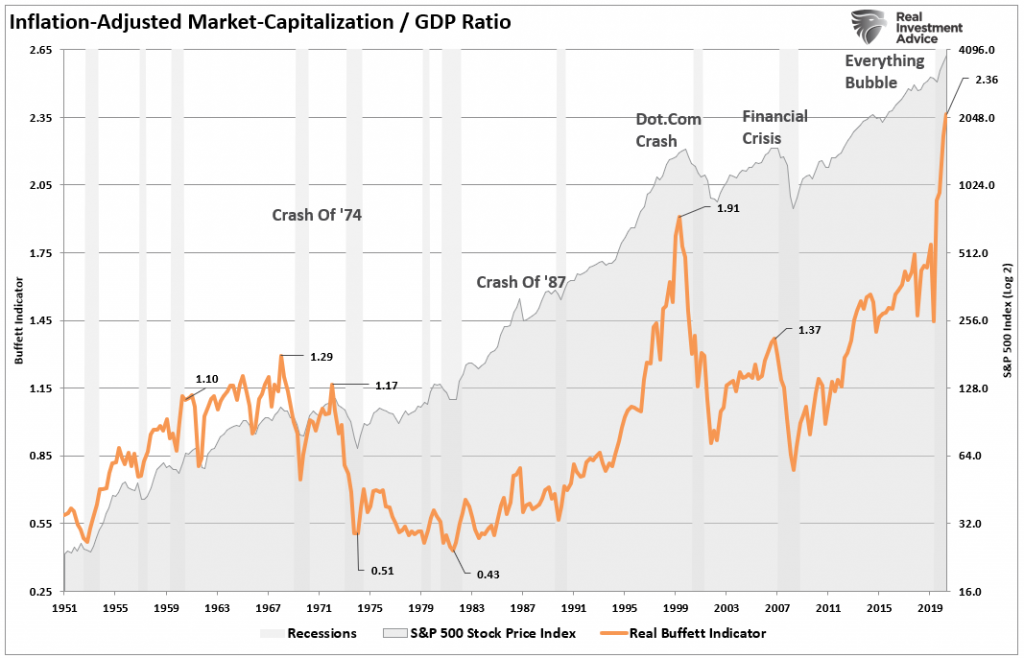
Of course, given that revenue can only grow roughly as fast as the economy, the market-capitalization to GDP ratio is very important. While the “price” of the market can outpace economic growth in the short term, it can’t do so indefinitely. Thus, at 2.4x economic growth, the market is highly overvalued relative to what the economy can generate in revenue growth.
Lastly, with markets currently perched near all-time highs, both operating and reported earnings will fall in Q2 versus Q1 as economic growth peaks. (We have repeatedly warned of this issue.)
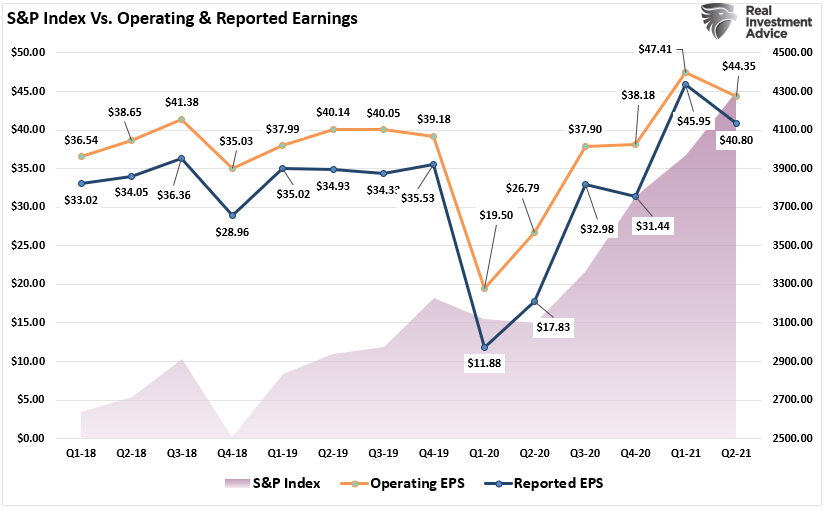
Note that as of Q2-2021, operating earnings (earnings without all the bad stuff) will only be 10% higher than they were in 2018. Yet, the market is currently trading 48% higher.
Even with the “sharpest recovery in earning in history,” the market continues to expand its valuation multiple. (Chart below uses current estimates for Q2-2021) So much for earnings catching up with the price.
As I said, investors have priced the market for perfection. Therefore, any disappointment could lead to poor outcomes for investors taking on excess risk.

Portfolio Update
I wanted to wrap up today’s note with some comments from my colleague Doug Kass on “Lessons Learned & Relearned.” As investors, the market has a habit of teaching us we aren’t as smart as we think.
* We learn from history, which usually rhymes.
* Liquidity is an overriding market force and influence as markets are a function of demand versus supply. The size of the Fed’s balance sheet will have an overriding impact on the markets. But the reduced supply of equities also is an important part of the investment equation. (There are about half the listed companies compared to what existed two decades ago. Of the companies still listed, more than 25% of outstanding shares are retired).
* A market in motion tends to stay in motion. Higher valuations usually beget higher valuations (and vice versa). A bona fide (and correct) contrarian view is a low probability practice. But, when the contrarian is correct, it can deliver large payoffs.
* Markets and emotions often go to extremes. Importantly, mean regression is a powerful force and consistent feature in the market.
* Seek precision when playing chess but not when investing.
* The notion, held by some, that the direction of the broad markets is a function of the health of speculative stocks is grossly incorrect. Crap doesn’t lead except for brief periods of time.
* It is fine to take chances and make mistakes. However, while it might work briefly, it is foolish to trade stocks with admittedly little value simply because they are moving higher.
* Avoid “group stink” as it can be harmful to your investment well being“
The risk of a correction is high but not necessarily immediate.
Manage your risk accordingly.
Have a great weekend.
By Lance Roberts, CIO
Market & Sector Analysis
Analysis & Stock Screens Exclusively For RIAPro Members
S&P 500 Tear Sheet
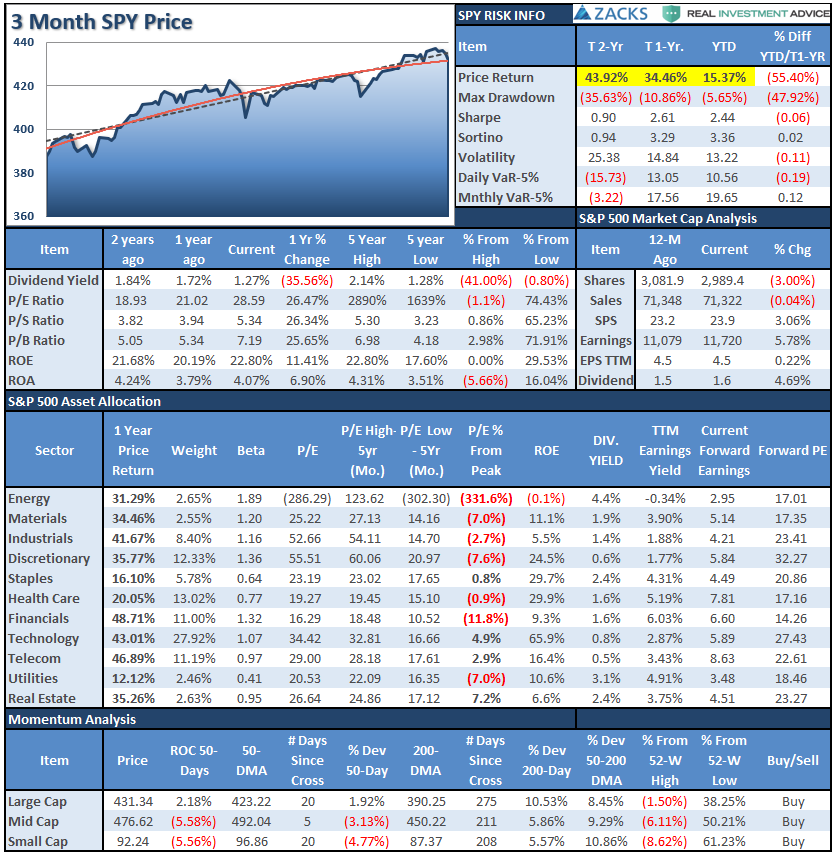
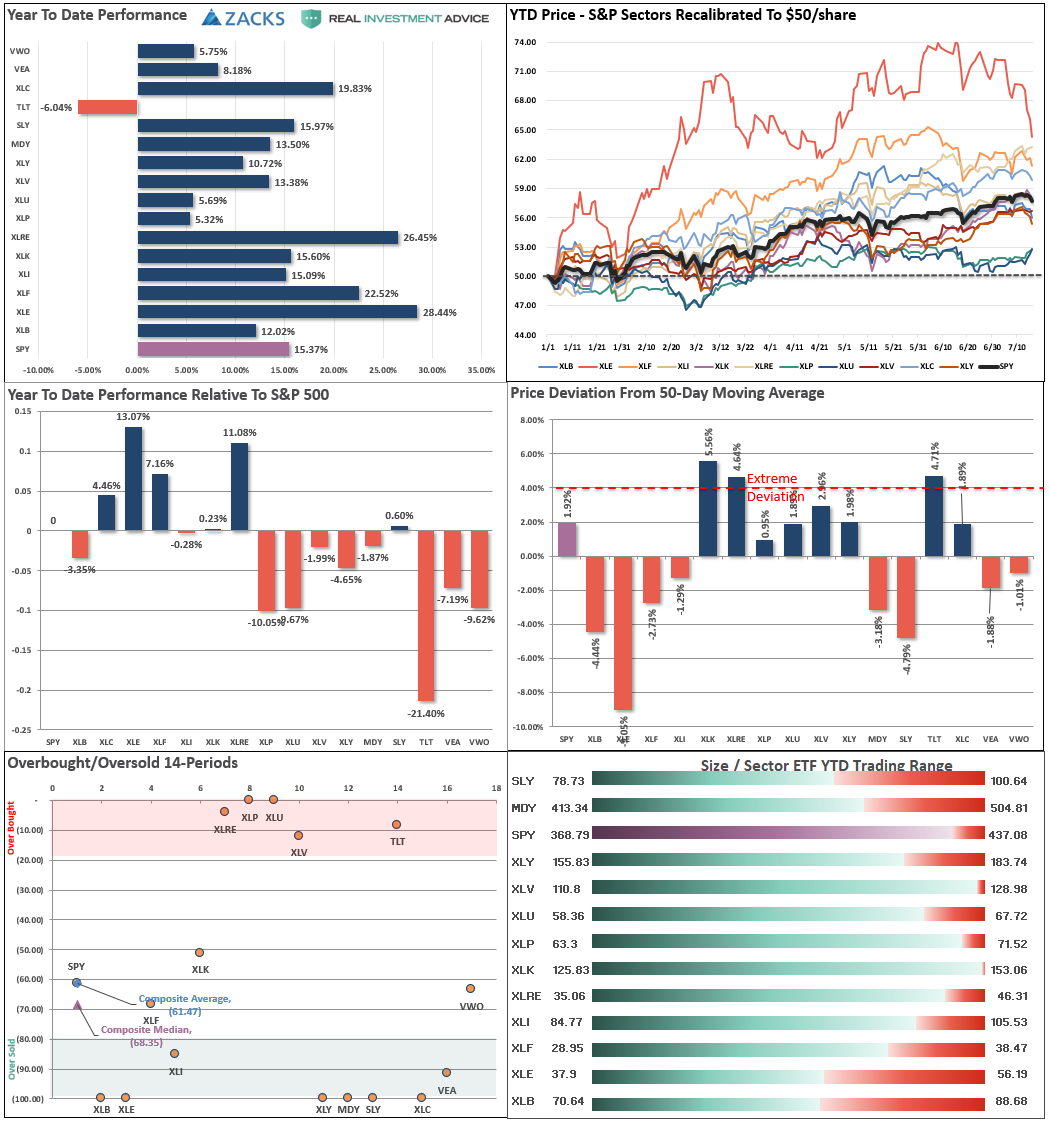
Performance Analysis
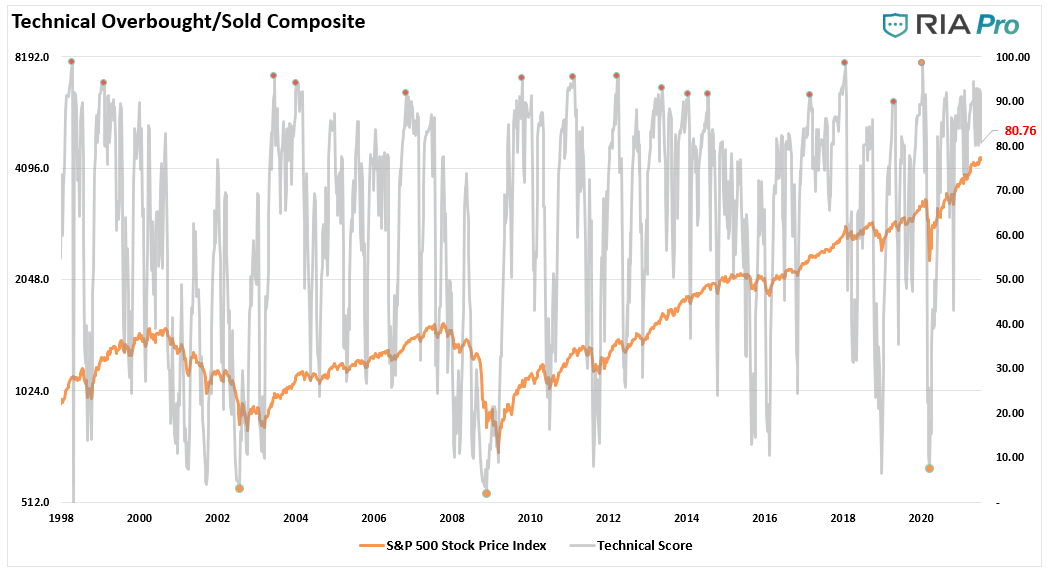
Technical Composite
The technical overbought/sold gauge comprises several price indicators (RSI, Williams %R, etc.), measured using “weekly” closing price data. Readings above “80” are considered overbought, and below “20” are oversold. The current reading is 80.76 out of a possible 100.
Portfolio Positioning “Fear / Greed” Gauge
The “Fear/Greed” gauge is how individual and professional investors are “positioning” themselves in the market based on their equity exposure. From a contrarian position, the higher the allocation to equities, to more likely the market is closer to a correction than not. The gauge uses weekly closing data.
NOTE: The Fear/Greed Index measures risk from 0-100. It is a rarity that it reaches levels above 90. The current reading is 85.37 out of a possible 100.

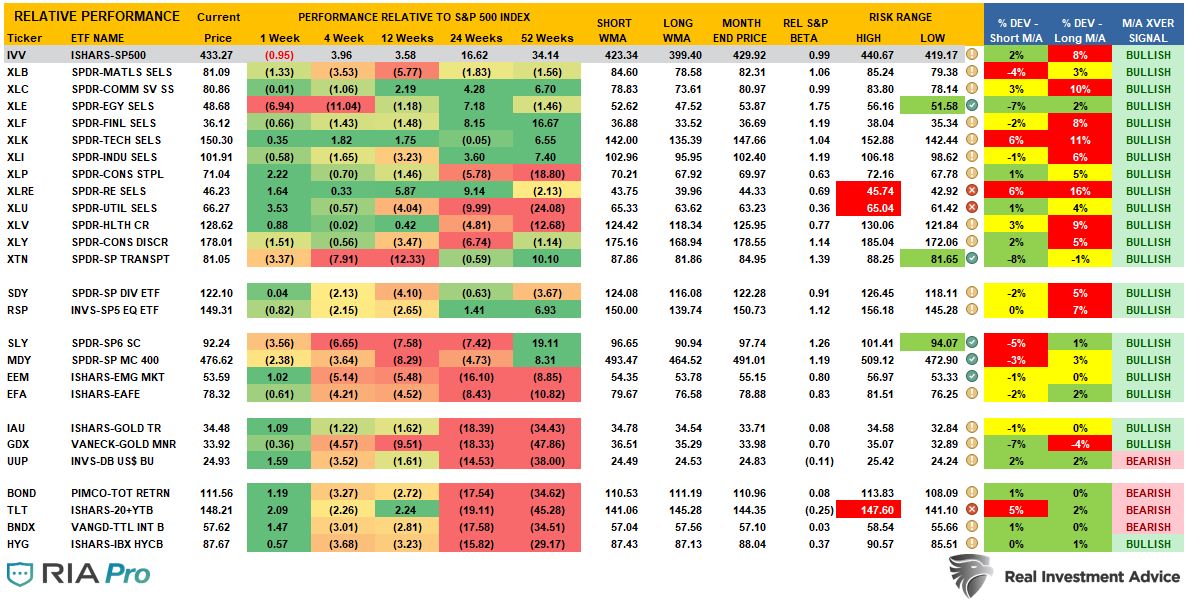
Sector Model Analysis & Risk Ranges
How To Read This Table
- The table compares each sector and market to the S&P 500 index on relative performance.
- “MA XVER” is determined by whether the short-term weekly moving average crosses positively or negatively with the long-term weekly moving average.
- The risk range is a function of the month-end closing price and the “beta” of the sector or market.
- Table shows the price deviation above and below the weekly moving averages.
Weekly Stock Screens
Currently, there are four different stock screens for you to review. The first is S&P 500 based companies with a “Growth” focus, the second is a “Value” screen on the entire universe of stocks, and the last are stocks that are “Technically” strong and breaking above their respective 50-dma.
We have provided the yield of each security and a Piotroski Score ranking to help you find fundamentally strong companies on each screen. (For more on the Piotroski Score – read this report.)
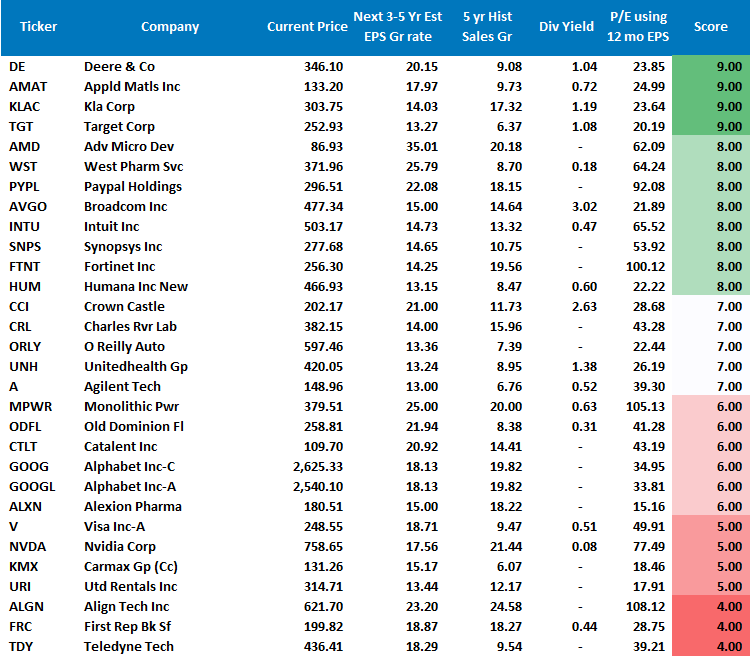
S&P 500 Growth Screen

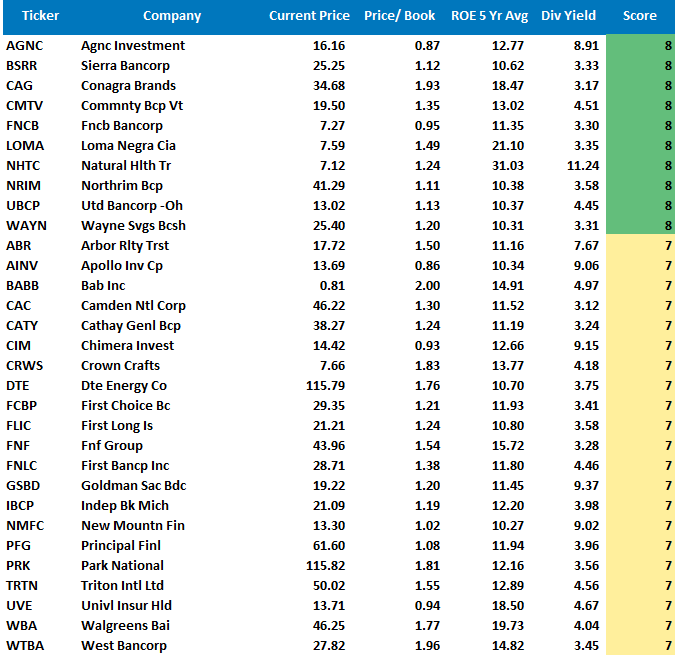
Low P/B, High-Value Score, High Dividend Screen
Fundamental Growth Screen
Aggressive Growth Strategy

Portfolio / Client Update
Not much to update from this past week. As noted:
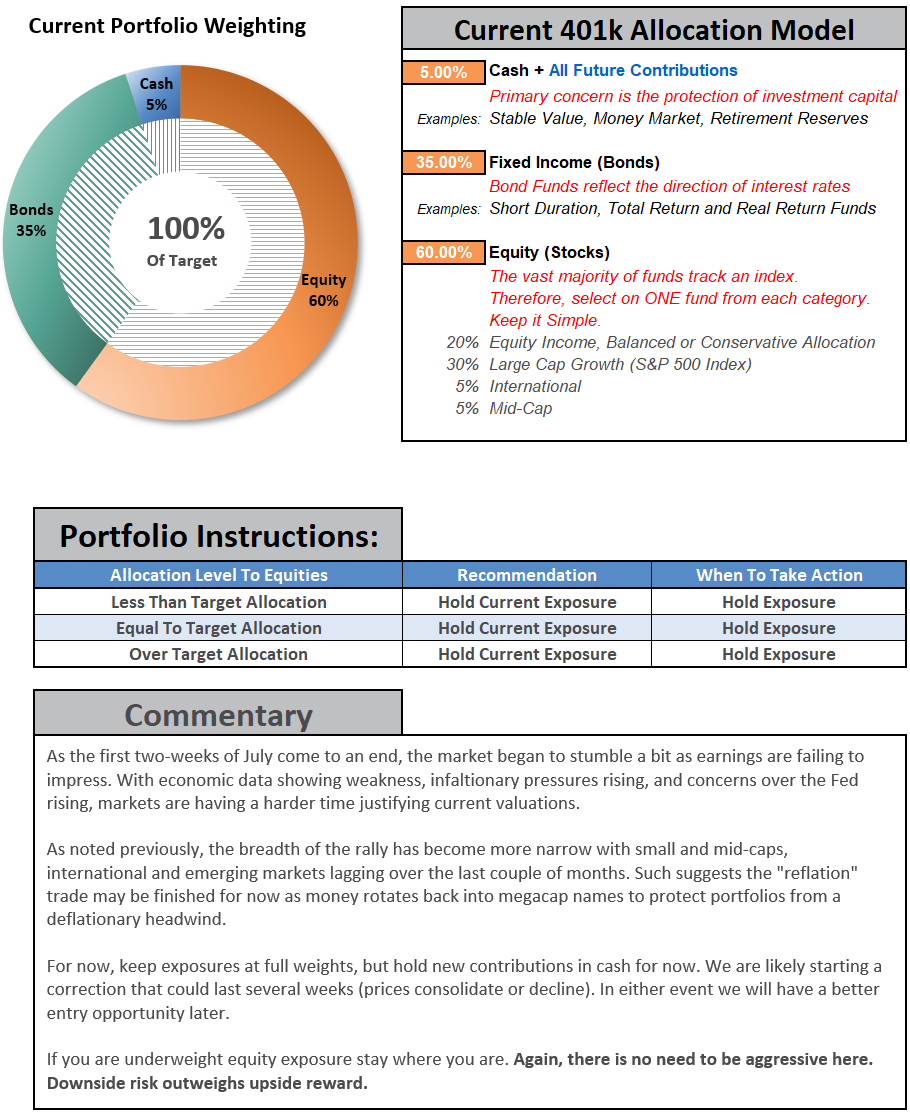
“With our money flow signals returning to peaks, which typically precede a pickup in volatility, we took the opportunity to reduce our index trading positions. That action raised our cash levels by 5% to provide a bit more of a cash cushion for now.”
Over the next 3-weeks, we will enter the heart of earnings season for the S&P 500. As discussed in the main body of this week’s newsletter, earnings appear to have peaked with economic activity in Q2, so the valuation question will become much more important going forward.
However, in the short term, the psychology of “Fed liquidity” continues to override the fundamental underpinnings of the market. So, for now, we will continue to let our positions participate with the underlying momentum until it requires a change.
Regardless, we continue to monitor the markets closely. If our signals become aligned, we will take further action to reduce risk exposures accordingly. As stated last week, there are no “red flags,” but if things change, we will change as well.
Portfolio Changes
During the past week, we made minor changes to portfolios. In addition, we post all trades in real-time at RIAPRO.NET.
*** Trading Update – Equity and Sector Models ***
“This morning, we took some profits in LIT in the sector model as it is overbought and replaced it with XLB, which got oversold. Both trades were for .5%. The trade will slightly reduce net exposure as LIT was overallocated and XLB slightly under-allocated versus the model.” – 07/12/2021
ETF Model
- Reduce LIT to 2.5% of the portfolio.
- Increase XLB to 2% of the portfolio.
As always, our short-term concern remains the protection of your portfolio. Accordingly, we have shifted our focus from the election back to the economic recovery and where we go from here.
Lance Roberts
CIO
THE REAL 401k PLAN MANAGER
A Conservative Strategy For Long-Term Investors
If you need help after reading the alert, do not hesitate to contact me.

401k Model Performance Analysis
Model performance is a two-asset model of stocks and bonds relative to the weighting changes made each week in the newsletter. Such is strictly for informational and educational purposes only, and one should not rely on it for any reason. Past performance is not a guarantee of future results. Use at your own risk and peril.

Have a great week!


Lance Roberts is a Chief Portfolio Strategist/Economist for RIA Advisors. He is also the host of “The Lance Roberts Podcast” and Chief Editor of the “Real Investment Advice” website and author of “Real Investment Daily” blog and “Real Investment Report“. Follow Lance on Facebook, Twitter, Linked-In and YouTube
Customer Relationship Summary (Form CRS)
Also Read


